Subsaharan African vs Dominican Disability Age 65 to 74
COMPARE
Subsaharan African
Dominican
Disability Age 65 to 74
Disability Age 65 to 74 Comparison
Sub-Saharan Africans
Dominicans
25.1%
DISABILITY AGE 65 TO 74
0.6/ 100
METRIC RATING
253rd/ 347
METRIC RANK
26.7%
DISABILITY AGE 65 TO 74
0.0/ 100
METRIC RATING
294th/ 347
METRIC RANK
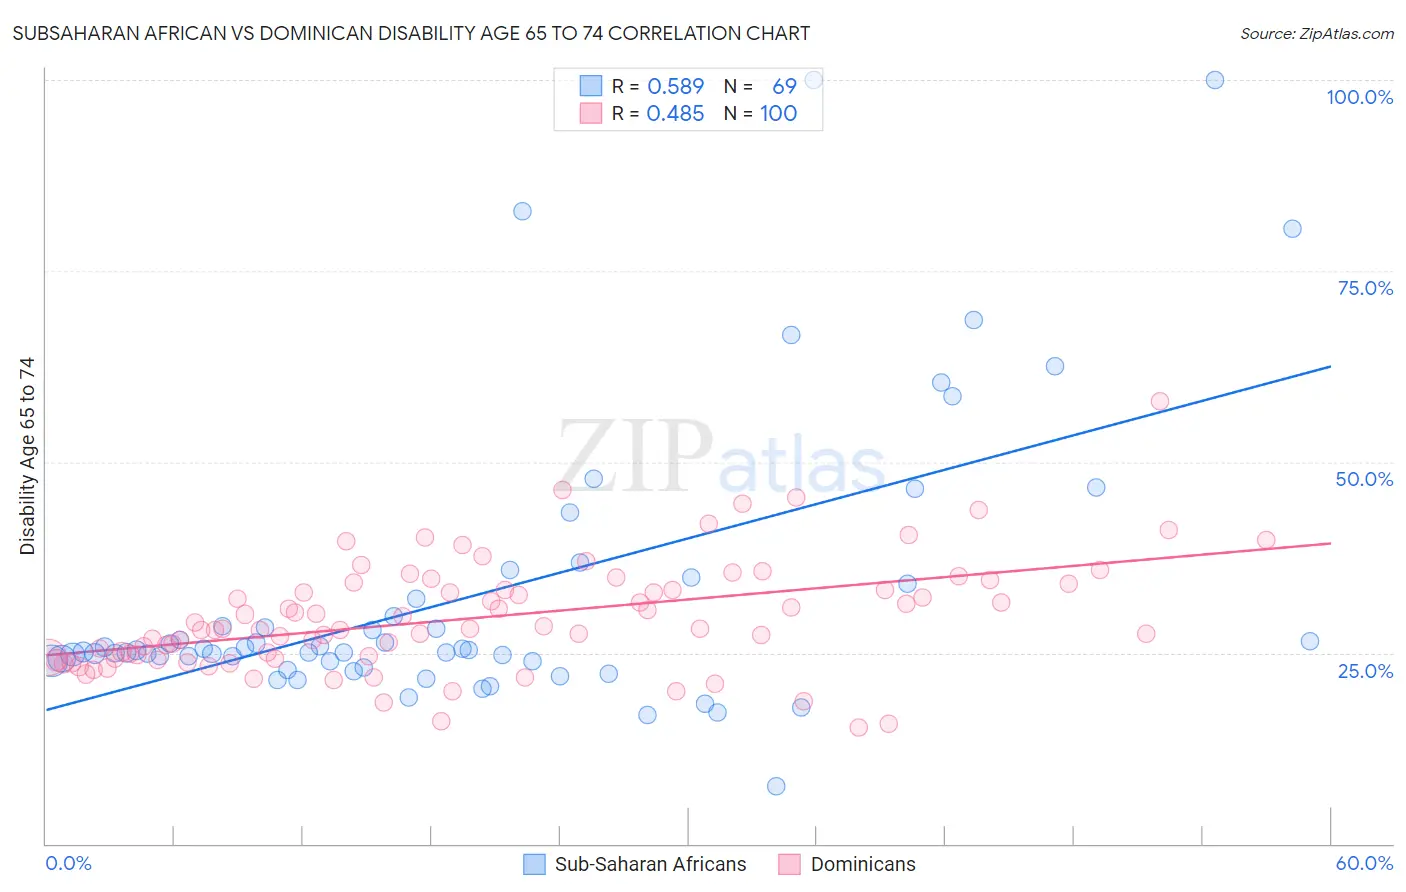
Subsaharan African vs Dominican Disability Age 65 to 74 Correlation Chart
The statistical analysis conducted on geographies consisting of 506,486,159 people shows a substantial positive correlation between the proportion of Sub-Saharan Africans and percentage of population with a disability between the ages 65 and 75 in the United States with a correlation coefficient (R) of 0.589 and weighted average of 25.1%. Similarly, the statistical analysis conducted on geographies consisting of 354,107,357 people shows a moderate positive correlation between the proportion of Dominicans and percentage of population with a disability between the ages 65 and 75 in the United States with a correlation coefficient (R) of 0.485 and weighted average of 26.7%, a difference of 6.4%.
Disability Age 65 to 74 Correlation Summary
| Measurement | Subsaharan African | Dominican |
| Minimum | 7.5% | 15.3% |
| Maximum | 100.0% | 57.9% |
| Range | 92.5% | 42.6% |
| Mean | 32.6% | 29.6% |
| Median | 25.4% | 28.1% |
| Interquartile 25% (IQ1) | 23.9% | 24.3% |
| Interquartile 75% (IQ3) | 33.0% | 33.6% |
| Interquartile Range (IQR) | 9.1% | 9.4% |
| Standard Deviation (Sample) | 18.8% | 7.3% |
| Standard Deviation (Population) | 18.7% | 7.2% |
Similar Demographics by Disability Age 65 to 74
Demographics Similar to Sub-Saharan Africans by Disability Age 65 to 74
In terms of disability age 65 to 74, the demographic groups most similar to Sub-Saharan Africans are Immigrants from El Salvador (25.1%, a difference of 0.030%), Somali (25.1%, a difference of 0.080%), Nonimmigrants (25.0%, a difference of 0.23%), Central American (25.1%, a difference of 0.23%), and Salvadoran (25.0%, a difference of 0.43%).
| Demographics | Rating | Rank | Disability Age 65 to 74 |
| Immigrants | Iraq | 1.9 /100 | #246 | Tragic 24.7% |
| Indonesians | 1.1 /100 | #247 | Tragic 24.9% |
| Senegalese | 0.9 /100 | #248 | Tragic 24.9% |
| Immigrants | Fiji | 0.8 /100 | #249 | Tragic 25.0% |
| Salvadorans | 0.8 /100 | #250 | Tragic 25.0% |
| Immigrants | Nonimmigrants | 0.7 /100 | #251 | Tragic 25.0% |
| Immigrants | El Salvador | 0.6 /100 | #252 | Tragic 25.1% |
| Sub-Saharan Africans | 0.6 /100 | #253 | Tragic 25.1% |
| Somalis | 0.6 /100 | #254 | Tragic 25.1% |
| Central Americans | 0.5 /100 | #255 | Tragic 25.1% |
| Immigrants | Somalia | 0.4 /100 | #256 | Tragic 25.2% |
| Guamanians/Chamorros | 0.3 /100 | #257 | Tragic 25.3% |
| Marshallese | 0.3 /100 | #258 | Tragic 25.3% |
| Immigrants | Cambodia | 0.3 /100 | #259 | Tragic 25.3% |
| Malaysians | 0.2 /100 | #260 | Tragic 25.4% |
Demographics Similar to Dominicans by Disability Age 65 to 74
In terms of disability age 65 to 74, the demographic groups most similar to Dominicans are Hispanic or Latino (26.7%, a difference of 0.020%), Immigrants from Central America (26.6%, a difference of 0.11%), Blackfeet (26.6%, a difference of 0.28%), Bangladeshi (26.8%, a difference of 0.63%), and Spanish American Indian (26.4%, a difference of 1.2%).
| Demographics | Rating | Rank | Disability Age 65 to 74 |
| Immigrants | Laos | 0.0 /100 | #287 | Tragic 26.1% |
| Mexican American Indians | 0.0 /100 | #288 | Tragic 26.2% |
| Africans | 0.0 /100 | #289 | Tragic 26.2% |
| Immigrants | Cabo Verde | 0.0 /100 | #290 | Tragic 26.3% |
| Spanish American Indians | 0.0 /100 | #291 | Tragic 26.4% |
| Blackfeet | 0.0 /100 | #292 | Tragic 26.6% |
| Immigrants | Central America | 0.0 /100 | #293 | Tragic 26.6% |
| Dominicans | 0.0 /100 | #294 | Tragic 26.7% |
| Hispanics or Latinos | 0.0 /100 | #295 | Tragic 26.7% |
| Bangladeshis | 0.0 /100 | #296 | Tragic 26.8% |
| Fijians | 0.0 /100 | #297 | Tragic 27.0% |
| Immigrants | Yemen | 0.0 /100 | #298 | Tragic 27.0% |
| Potawatomi | 0.0 /100 | #299 | Tragic 27.0% |
| Immigrants | Dominican Republic | 0.0 /100 | #300 | Tragic 27.0% |
| Immigrants | Mexico | 0.0 /100 | #301 | Tragic 27.1% |