Subsaharan African vs Romanian Disability Age 65 to 74
COMPARE
Subsaharan African
Romanian
Disability Age 65 to 74
Disability Age 65 to 74 Comparison
Sub-Saharan Africans
Romanians
25.1%
DISABILITY AGE 65 TO 74
0.6/ 100
METRIC RATING
253rd/ 347
METRIC RANK
22.1%
DISABILITY AGE 65 TO 74
97.7/ 100
METRIC RATING
95th/ 347
METRIC RANK
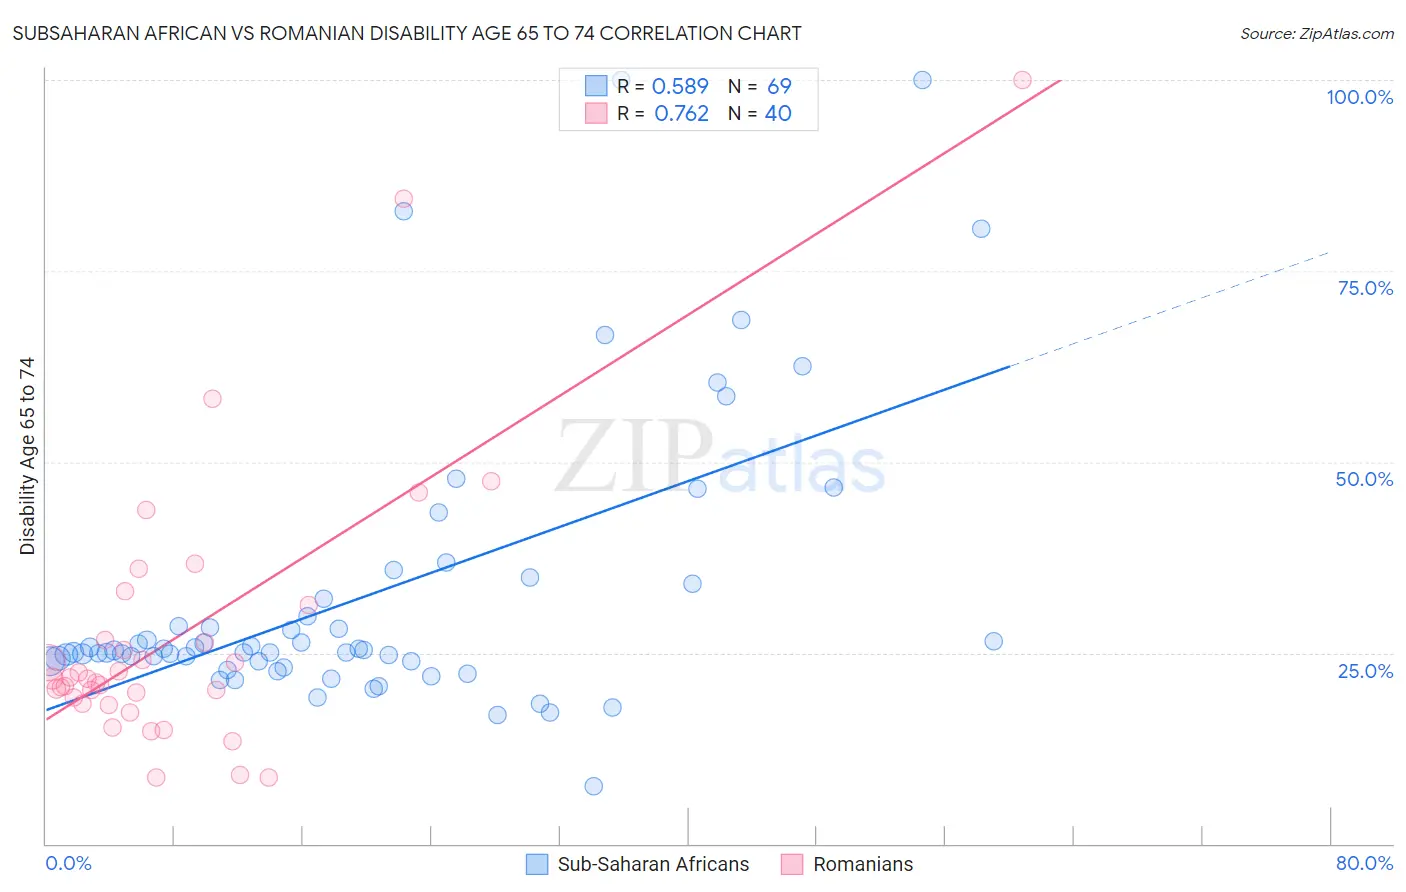
Subsaharan African vs Romanian Disability Age 65 to 74 Correlation Chart
The statistical analysis conducted on geographies consisting of 506,486,159 people shows a substantial positive correlation between the proportion of Sub-Saharan Africans and percentage of population with a disability between the ages 65 and 75 in the United States with a correlation coefficient (R) of 0.589 and weighted average of 25.1%. Similarly, the statistical analysis conducted on geographies consisting of 377,283,716 people shows a strong positive correlation between the proportion of Romanians and percentage of population with a disability between the ages 65 and 75 in the United States with a correlation coefficient (R) of 0.762 and weighted average of 22.1%, a difference of 13.6%.
Disability Age 65 to 74 Correlation Summary
| Measurement | Subsaharan African | Romanian |
| Minimum | 7.5% | 8.6% |
| Maximum | 100.0% | 100.0% |
| Range | 92.5% | 91.4% |
| Mean | 32.6% | 27.4% |
| Median | 25.4% | 21.6% |
| Interquartile 25% (IQ1) | 23.9% | 18.7% |
| Interquartile 75% (IQ3) | 33.0% | 29.0% |
| Interquartile Range (IQR) | 9.1% | 10.3% |
| Standard Deviation (Sample) | 18.8% | 18.5% |
| Standard Deviation (Population) | 18.7% | 18.3% |
Similar Demographics by Disability Age 65 to 74
Demographics Similar to Sub-Saharan Africans by Disability Age 65 to 74
In terms of disability age 65 to 74, the demographic groups most similar to Sub-Saharan Africans are Immigrants from El Salvador (25.1%, a difference of 0.030%), Somali (25.1%, a difference of 0.080%), Nonimmigrants (25.0%, a difference of 0.23%), Central American (25.1%, a difference of 0.23%), and Salvadoran (25.0%, a difference of 0.43%).
| Demographics | Rating | Rank | Disability Age 65 to 74 |
| Immigrants | Iraq | 1.9 /100 | #246 | Tragic 24.7% |
| Indonesians | 1.1 /100 | #247 | Tragic 24.9% |
| Senegalese | 0.9 /100 | #248 | Tragic 24.9% |
| Immigrants | Fiji | 0.8 /100 | #249 | Tragic 25.0% |
| Salvadorans | 0.8 /100 | #250 | Tragic 25.0% |
| Immigrants | Nonimmigrants | 0.7 /100 | #251 | Tragic 25.0% |
| Immigrants | El Salvador | 0.6 /100 | #252 | Tragic 25.1% |
| Sub-Saharan Africans | 0.6 /100 | #253 | Tragic 25.1% |
| Somalis | 0.6 /100 | #254 | Tragic 25.1% |
| Central Americans | 0.5 /100 | #255 | Tragic 25.1% |
| Immigrants | Somalia | 0.4 /100 | #256 | Tragic 25.2% |
| Guamanians/Chamorros | 0.3 /100 | #257 | Tragic 25.3% |
| Marshallese | 0.3 /100 | #258 | Tragic 25.3% |
| Immigrants | Cambodia | 0.3 /100 | #259 | Tragic 25.3% |
| Malaysians | 0.2 /100 | #260 | Tragic 25.4% |
Demographics Similar to Romanians by Disability Age 65 to 74
In terms of disability age 65 to 74, the demographic groups most similar to Romanians are Immigrants from Chile (22.1%, a difference of 0.060%), Immigrants from Canada (22.1%, a difference of 0.080%), Polish (22.0%, a difference of 0.11%), Immigrants from North America (22.1%, a difference of 0.11%), and Chilean (22.0%, a difference of 0.16%).
| Demographics | Rating | Rank | Disability Age 65 to 74 |
| Immigrants | Netherlands | 97.9 /100 | #88 | Exceptional 22.0% |
| Immigrants | Kuwait | 97.9 /100 | #89 | Exceptional 22.0% |
| Italians | 97.9 /100 | #90 | Exceptional 22.0% |
| Chileans | 97.9 /100 | #91 | Exceptional 22.0% |
| Poles | 97.8 /100 | #92 | Exceptional 22.0% |
| Immigrants | Canada | 97.8 /100 | #93 | Exceptional 22.1% |
| Immigrants | Chile | 97.7 /100 | #94 | Exceptional 22.1% |
| Romanians | 97.7 /100 | #95 | Exceptional 22.1% |
| Immigrants | North America | 97.5 /100 | #96 | Exceptional 22.1% |
| Immigrants | Southern Europe | 97.2 /100 | #97 | Exceptional 22.1% |
| Jordanians | 96.9 /100 | #98 | Exceptional 22.2% |
| Immigrants | Colombia | 96.8 /100 | #99 | Exceptional 22.2% |
| Uruguayans | 96.5 /100 | #100 | Exceptional 22.2% |
| Immigrants | England | 96.5 /100 | #101 | Exceptional 22.2% |
| Immigrants | Saudi Arabia | 96.4 /100 | #102 | Exceptional 22.2% |