Subsaharan African vs Zimbabwean Disability Age 65 to 74
COMPARE
Subsaharan African
Zimbabwean
Disability Age 65 to 74
Disability Age 65 to 74 Comparison
Sub-Saharan Africans
Zimbabweans
25.1%
DISABILITY AGE 65 TO 74
0.6/ 100
METRIC RATING
253rd/ 347
METRIC RANK
21.5%
DISABILITY AGE 65 TO 74
99.5/ 100
METRIC RATING
59th/ 347
METRIC RANK
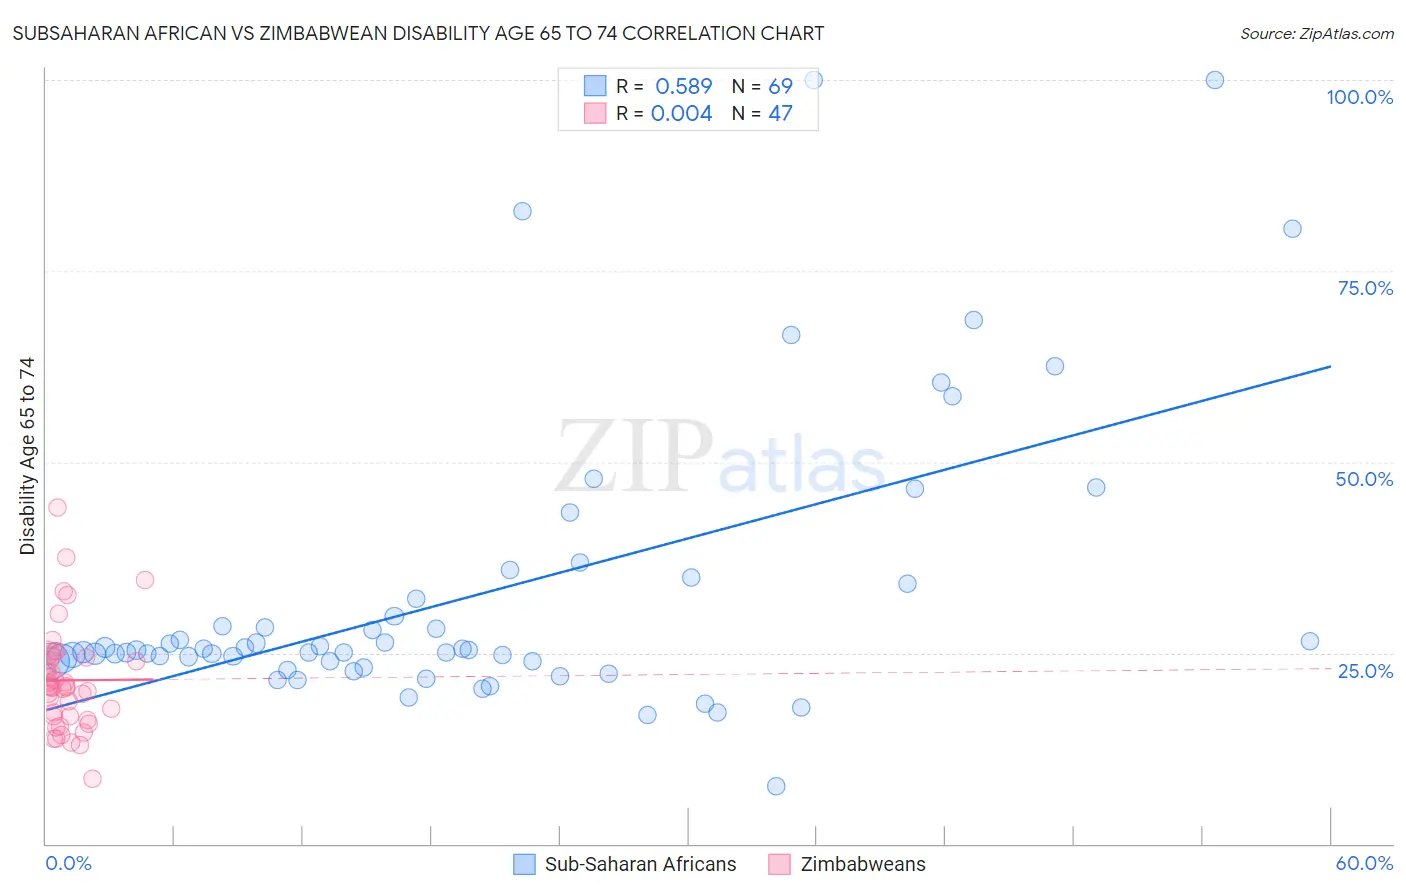
Subsaharan African vs Zimbabwean Disability Age 65 to 74 Correlation Chart
The statistical analysis conducted on geographies consisting of 506,486,159 people shows a substantial positive correlation between the proportion of Sub-Saharan Africans and percentage of population with a disability between the ages 65 and 75 in the United States with a correlation coefficient (R) of 0.589 and weighted average of 25.1%. Similarly, the statistical analysis conducted on geographies consisting of 69,127,978 people shows no correlation between the proportion of Zimbabweans and percentage of population with a disability between the ages 65 and 75 in the United States with a correlation coefficient (R) of 0.004 and weighted average of 21.5%, a difference of 16.4%.
Disability Age 65 to 74 Correlation Summary
| Measurement | Subsaharan African | Zimbabwean |
| Minimum | 7.5% | 8.6% |
| Maximum | 100.0% | 44.0% |
| Range | 92.5% | 35.4% |
| Mean | 32.6% | 21.4% |
| Median | 25.4% | 20.5% |
| Interquartile 25% (IQ1) | 23.9% | 16.7% |
| Interquartile 75% (IQ3) | 33.0% | 24.4% |
| Interquartile Range (IQR) | 9.1% | 7.7% |
| Standard Deviation (Sample) | 18.8% | 6.8% |
| Standard Deviation (Population) | 18.7% | 6.7% |
Similar Demographics by Disability Age 65 to 74
Demographics Similar to Sub-Saharan Africans by Disability Age 65 to 74
In terms of disability age 65 to 74, the demographic groups most similar to Sub-Saharan Africans are Immigrants from El Salvador (25.1%, a difference of 0.030%), Somali (25.1%, a difference of 0.080%), Nonimmigrants (25.0%, a difference of 0.23%), Central American (25.1%, a difference of 0.23%), and Salvadoran (25.0%, a difference of 0.43%).
| Demographics | Rating | Rank | Disability Age 65 to 74 |
| Immigrants | Iraq | 1.9 /100 | #246 | Tragic 24.7% |
| Indonesians | 1.1 /100 | #247 | Tragic 24.9% |
| Senegalese | 0.9 /100 | #248 | Tragic 24.9% |
| Immigrants | Fiji | 0.8 /100 | #249 | Tragic 25.0% |
| Salvadorans | 0.8 /100 | #250 | Tragic 25.0% |
| Immigrants | Nonimmigrants | 0.7 /100 | #251 | Tragic 25.0% |
| Immigrants | El Salvador | 0.6 /100 | #252 | Tragic 25.1% |
| Sub-Saharan Africans | 0.6 /100 | #253 | Tragic 25.1% |
| Somalis | 0.6 /100 | #254 | Tragic 25.1% |
| Central Americans | 0.5 /100 | #255 | Tragic 25.1% |
| Immigrants | Somalia | 0.4 /100 | #256 | Tragic 25.2% |
| Guamanians/Chamorros | 0.3 /100 | #257 | Tragic 25.3% |
| Marshallese | 0.3 /100 | #258 | Tragic 25.3% |
| Immigrants | Cambodia | 0.3 /100 | #259 | Tragic 25.3% |
| Malaysians | 0.2 /100 | #260 | Tragic 25.4% |
Demographics Similar to Zimbabweans by Disability Age 65 to 74
In terms of disability age 65 to 74, the demographic groups most similar to Zimbabweans are Immigrants from Pakistan (21.5%, a difference of 0.030%), Immigrants from North Macedonia (21.6%, a difference of 0.030%), Egyptian (21.6%, a difference of 0.050%), Immigrants from Asia (21.5%, a difference of 0.070%), and Carpatho Rusyn (21.6%, a difference of 0.080%).
| Demographics | Rating | Rank | Disability Age 65 to 74 |
| Immigrants | France | 99.6 /100 | #52 | Exceptional 21.5% |
| Bhutanese | 99.6 /100 | #53 | Exceptional 21.5% |
| Immigrants | Italy | 99.6 /100 | #54 | Exceptional 21.5% |
| Immigrants | Romania | 99.5 /100 | #55 | Exceptional 21.5% |
| Immigrants | Denmark | 99.5 /100 | #56 | Exceptional 21.5% |
| Immigrants | Asia | 99.5 /100 | #57 | Exceptional 21.5% |
| Immigrants | Pakistan | 99.5 /100 | #58 | Exceptional 21.5% |
| Zimbabweans | 99.5 /100 | #59 | Exceptional 21.5% |
| Immigrants | North Macedonia | 99.5 /100 | #60 | Exceptional 21.6% |
| Egyptians | 99.5 /100 | #61 | Exceptional 21.6% |
| Carpatho Rusyns | 99.5 /100 | #62 | Exceptional 21.6% |
| Immigrants | Europe | 99.4 /100 | #63 | Exceptional 21.6% |
| Immigrants | Latvia | 99.4 /100 | #64 | Exceptional 21.6% |
| Immigrants | Russia | 99.4 /100 | #65 | Exceptional 21.6% |
| Maltese | 99.4 /100 | #66 | Exceptional 21.6% |