Subsaharan African vs Dutch West Indian Disability Age 65 to 74
COMPARE
Subsaharan African
Dutch West Indian
Disability Age 65 to 74
Disability Age 65 to 74 Comparison
Sub-Saharan Africans
Dutch West Indians
25.1%
DISABILITY AGE 65 TO 74
0.6/ 100
METRIC RATING
253rd/ 347
METRIC RANK
29.6%
DISABILITY AGE 65 TO 74
0.0/ 100
METRIC RATING
325th/ 347
METRIC RANK
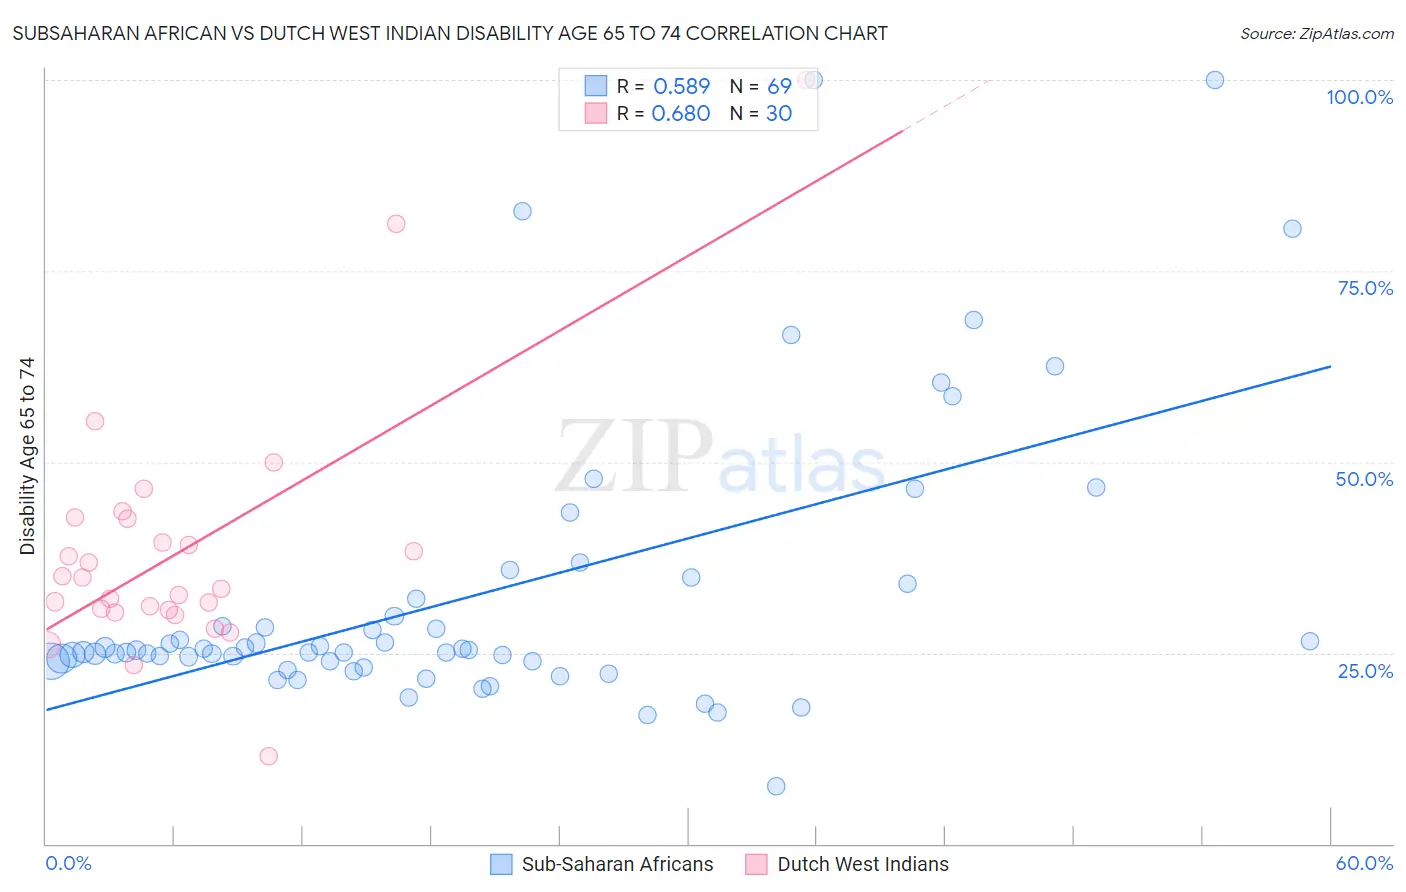
Subsaharan African vs Dutch West Indian Disability Age 65 to 74 Correlation Chart
The statistical analysis conducted on geographies consisting of 506,486,159 people shows a substantial positive correlation between the proportion of Sub-Saharan Africans and percentage of population with a disability between the ages 65 and 75 in the United States with a correlation coefficient (R) of 0.589 and weighted average of 25.1%. Similarly, the statistical analysis conducted on geographies consisting of 85,748,630 people shows a significant positive correlation between the proportion of Dutch West Indians and percentage of population with a disability between the ages 65 and 75 in the United States with a correlation coefficient (R) of 0.680 and weighted average of 29.6%, a difference of 17.9%.
Disability Age 65 to 74 Correlation Summary
| Measurement | Subsaharan African | Dutch West Indian |
| Minimum | 7.5% | 11.5% |
| Maximum | 100.0% | 100.0% |
| Range | 92.5% | 88.5% |
| Mean | 32.6% | 38.5% |
| Median | 25.4% | 34.1% |
| Interquartile 25% (IQ1) | 23.9% | 30.5% |
| Interquartile 75% (IQ3) | 33.0% | 42.5% |
| Interquartile Range (IQR) | 9.1% | 12.0% |
| Standard Deviation (Sample) | 18.8% | 16.6% |
| Standard Deviation (Population) | 18.7% | 16.4% |
Similar Demographics by Disability Age 65 to 74
Demographics Similar to Sub-Saharan Africans by Disability Age 65 to 74
In terms of disability age 65 to 74, the demographic groups most similar to Sub-Saharan Africans are Immigrants from El Salvador (25.1%, a difference of 0.030%), Somali (25.1%, a difference of 0.080%), Nonimmigrants (25.0%, a difference of 0.23%), Central American (25.1%, a difference of 0.23%), and Salvadoran (25.0%, a difference of 0.43%).
| Demographics | Rating | Rank | Disability Age 65 to 74 |
| Immigrants | Iraq | 1.9 /100 | #246 | Tragic 24.7% |
| Indonesians | 1.1 /100 | #247 | Tragic 24.9% |
| Senegalese | 0.9 /100 | #248 | Tragic 24.9% |
| Immigrants | Fiji | 0.8 /100 | #249 | Tragic 25.0% |
| Salvadorans | 0.8 /100 | #250 | Tragic 25.0% |
| Immigrants | Nonimmigrants | 0.7 /100 | #251 | Tragic 25.0% |
| Immigrants | El Salvador | 0.6 /100 | #252 | Tragic 25.1% |
| Sub-Saharan Africans | 0.6 /100 | #253 | Tragic 25.1% |
| Somalis | 0.6 /100 | #254 | Tragic 25.1% |
| Central Americans | 0.5 /100 | #255 | Tragic 25.1% |
| Immigrants | Somalia | 0.4 /100 | #256 | Tragic 25.2% |
| Guamanians/Chamorros | 0.3 /100 | #257 | Tragic 25.3% |
| Marshallese | 0.3 /100 | #258 | Tragic 25.3% |
| Immigrants | Cambodia | 0.3 /100 | #259 | Tragic 25.3% |
| Malaysians | 0.2 /100 | #260 | Tragic 25.4% |
Demographics Similar to Dutch West Indians by Disability Age 65 to 74
In terms of disability age 65 to 74, the demographic groups most similar to Dutch West Indians are Yakama (29.6%, a difference of 0.23%), Apache (29.7%, a difference of 0.38%), Seminole (29.4%, a difference of 0.45%), Hopi (30.0%, a difference of 1.3%), and Puerto Rican (29.1%, a difference of 1.4%).
| Demographics | Rating | Rank | Disability Age 65 to 74 |
| Nepalese | 0.0 /100 | #318 | Tragic 28.0% |
| Arapaho | 0.0 /100 | #319 | Tragic 28.1% |
| Cherokee | 0.0 /100 | #320 | Tragic 28.2% |
| Comanche | 0.0 /100 | #321 | Tragic 28.3% |
| Aleuts | 0.0 /100 | #322 | Tragic 28.4% |
| Puerto Ricans | 0.0 /100 | #323 | Tragic 29.1% |
| Seminole | 0.0 /100 | #324 | Tragic 29.4% |
| Dutch West Indians | 0.0 /100 | #325 | Tragic 29.6% |
| Yakama | 0.0 /100 | #326 | Tragic 29.6% |
| Apache | 0.0 /100 | #327 | Tragic 29.7% |
| Hopi | 0.0 /100 | #328 | Tragic 30.0% |
| Choctaw | 0.0 /100 | #329 | Tragic 30.2% |
| Creek | 0.0 /100 | #330 | Tragic 30.2% |
| Chickasaw | 0.0 /100 | #331 | Tragic 30.2% |
| Natives/Alaskans | 0.0 /100 | #332 | Tragic 30.4% |