Subsaharan African vs Samoan Disability Age 65 to 74
COMPARE
Subsaharan African
Samoan
Disability Age 65 to 74
Disability Age 65 to 74 Comparison
Sub-Saharan Africans
Samoans
25.1%
DISABILITY AGE 65 TO 74
0.6/ 100
METRIC RATING
253rd/ 347
METRIC RANK
25.4%
DISABILITY AGE 65 TO 74
0.2/ 100
METRIC RATING
262nd/ 347
METRIC RANK
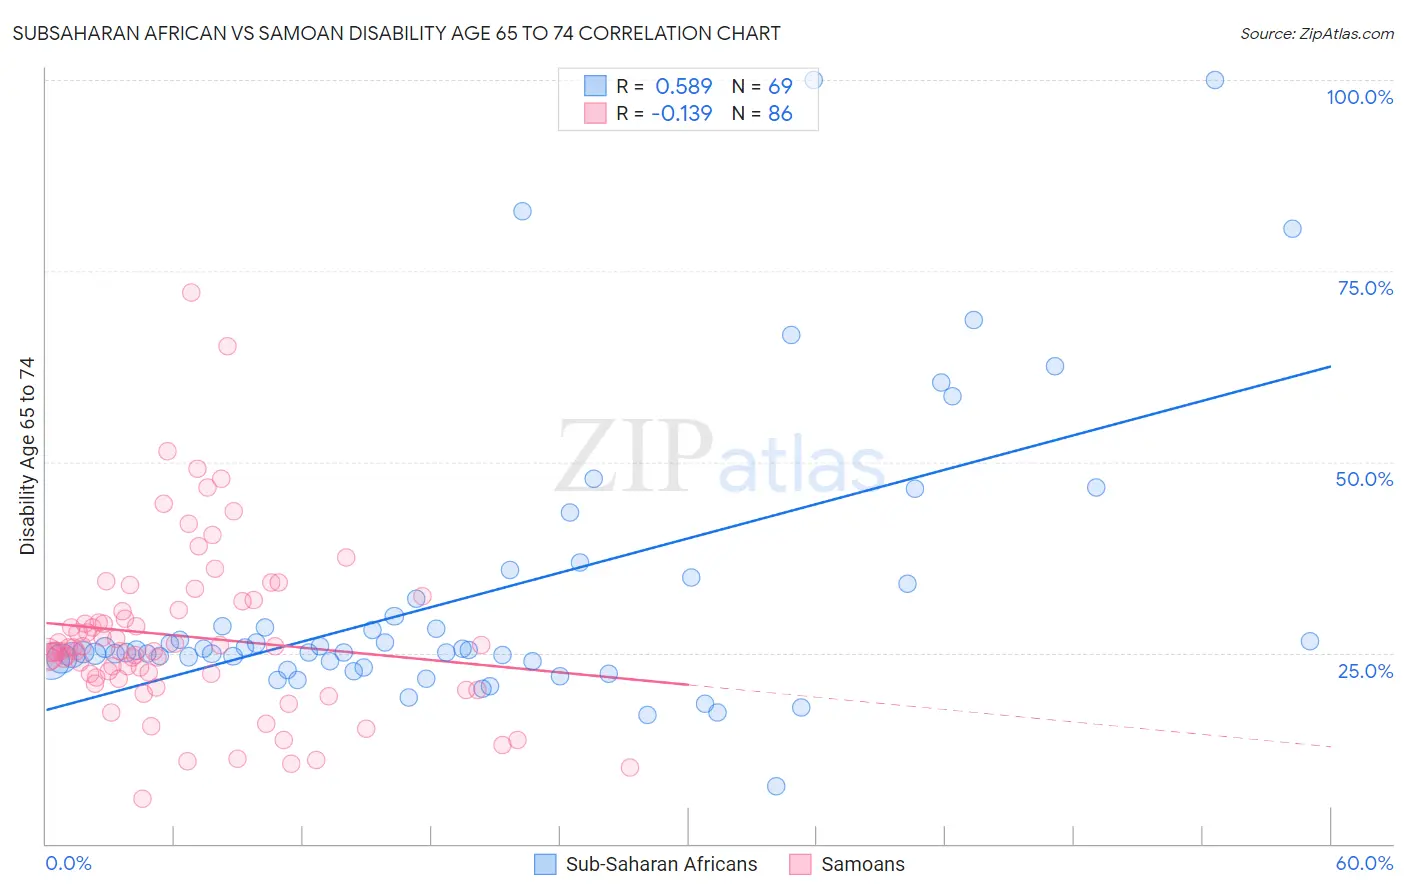
Subsaharan African vs Samoan Disability Age 65 to 74 Correlation Chart
The statistical analysis conducted on geographies consisting of 506,486,159 people shows a substantial positive correlation between the proportion of Sub-Saharan Africans and percentage of population with a disability between the ages 65 and 75 in the United States with a correlation coefficient (R) of 0.589 and weighted average of 25.1%. Similarly, the statistical analysis conducted on geographies consisting of 224,691,566 people shows a poor negative correlation between the proportion of Samoans and percentage of population with a disability between the ages 65 and 75 in the United States with a correlation coefficient (R) of -0.139 and weighted average of 25.4%, a difference of 1.5%.
Disability Age 65 to 74 Correlation Summary
| Measurement | Subsaharan African | Samoan |
| Minimum | 7.5% | 5.9% |
| Maximum | 100.0% | 72.2% |
| Range | 92.5% | 66.4% |
| Mean | 32.6% | 27.2% |
| Median | 25.4% | 25.3% |
| Interquartile 25% (IQ1) | 23.9% | 21.8% |
| Interquartile 75% (IQ3) | 33.0% | 30.7% |
| Interquartile Range (IQR) | 9.1% | 8.9% |
| Standard Deviation (Sample) | 18.8% | 11.1% |
| Standard Deviation (Population) | 18.7% | 11.1% |
Demographics Similar to Sub-Saharan Africans and Samoans by Disability Age 65 to 74
In terms of disability age 65 to 74, the demographic groups most similar to Sub-Saharan Africans are Immigrants from El Salvador (25.1%, a difference of 0.030%), Somali (25.1%, a difference of 0.080%), Nonimmigrants (25.0%, a difference of 0.23%), Central American (25.1%, a difference of 0.23%), and Salvadoran (25.0%, a difference of 0.43%). Similarly, the demographic groups most similar to Samoans are Iroquois (25.4%, a difference of 0.010%), Cape Verdean (25.4%, a difference of 0.10%), Malaysian (25.4%, a difference of 0.18%), Hawaiian (25.5%, a difference of 0.35%), and Guatemalan (25.5%, a difference of 0.40%).
| Demographics | Rating | Rank | Disability Age 65 to 74 |
| Indonesians | 1.1 /100 | #247 | Tragic 24.9% |
| Senegalese | 0.9 /100 | #248 | Tragic 24.9% |
| Immigrants | Fiji | 0.8 /100 | #249 | Tragic 25.0% |
| Salvadorans | 0.8 /100 | #250 | Tragic 25.0% |
| Immigrants | Nonimmigrants | 0.7 /100 | #251 | Tragic 25.0% |
| Immigrants | El Salvador | 0.6 /100 | #252 | Tragic 25.1% |
| Sub-Saharan Africans | 0.6 /100 | #253 | Tragic 25.1% |
| Somalis | 0.6 /100 | #254 | Tragic 25.1% |
| Central Americans | 0.5 /100 | #255 | Tragic 25.1% |
| Immigrants | Somalia | 0.4 /100 | #256 | Tragic 25.2% |
| Guamanians/Chamorros | 0.3 /100 | #257 | Tragic 25.3% |
| Marshallese | 0.3 /100 | #258 | Tragic 25.3% |
| Immigrants | Cambodia | 0.3 /100 | #259 | Tragic 25.3% |
| Malaysians | 0.2 /100 | #260 | Tragic 25.4% |
| Cape Verdeans | 0.2 /100 | #261 | Tragic 25.4% |
| Samoans | 0.2 /100 | #262 | Tragic 25.4% |
| Iroquois | 0.2 /100 | #263 | Tragic 25.4% |
| Hawaiians | 0.2 /100 | #264 | Tragic 25.5% |
| Guatemalans | 0.2 /100 | #265 | Tragic 25.5% |
| Immigrants | Latin America | 0.1 /100 | #266 | Tragic 25.6% |
| Ottawa | 0.1 /100 | #267 | Tragic 25.6% |