Immigrants from Indonesia vs Czechoslovakian Disability Age 65 to 74
COMPARE
Immigrants from Indonesia
Czechoslovakian
Disability Age 65 to 74
Disability Age 65 to 74 Comparison
Immigrants from Indonesia
Czechoslovakians
21.9%
DISABILITY AGE 65 TO 74
98.7/ 100
METRIC RATING
82nd/ 347
METRIC RANK
23.0%
DISABILITY AGE 65 TO 74
72.4/ 100
METRIC RATING
157th/ 347
METRIC RANK
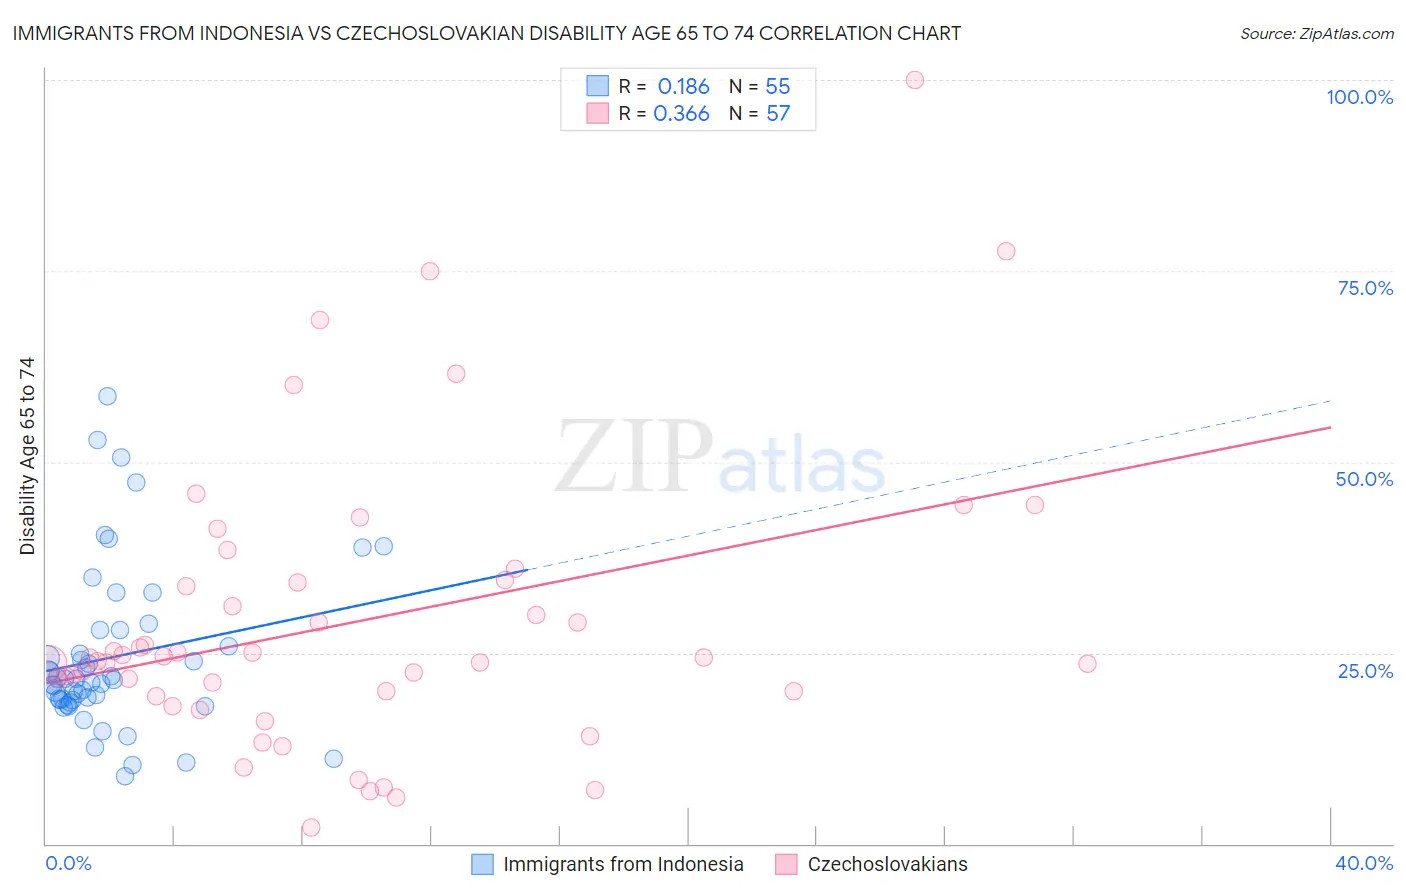
Immigrants from Indonesia vs Czechoslovakian Disability Age 65 to 74 Correlation Chart
The statistical analysis conducted on geographies consisting of 215,523,234 people shows a poor positive correlation between the proportion of Immigrants from Indonesia and percentage of population with a disability between the ages 65 and 75 in the United States with a correlation coefficient (R) of 0.186 and weighted average of 21.9%. Similarly, the statistical analysis conducted on geographies consisting of 368,238,154 people shows a mild positive correlation between the proportion of Czechoslovakians and percentage of population with a disability between the ages 65 and 75 in the United States with a correlation coefficient (R) of 0.366 and weighted average of 23.0%, a difference of 5.2%.
Disability Age 65 to 74 Correlation Summary
| Measurement | Immigrants from Indonesia | Czechoslovakian |
| Minimum | 8.9% | 2.1% |
| Maximum | 58.7% | 100.0% |
| Range | 49.8% | 97.9% |
| Mean | 24.4% | 29.0% |
| Median | 21.4% | 24.3% |
| Interquartile 25% (IQ1) | 18.8% | 19.6% |
| Interquartile 75% (IQ3) | 27.9% | 34.3% |
| Interquartile Range (IQR) | 9.2% | 14.7% |
| Standard Deviation (Sample) | 10.7% | 18.9% |
| Standard Deviation (Population) | 10.6% | 18.7% |
Similar Demographics by Disability Age 65 to 74
Demographics Similar to Immigrants from Indonesia by Disability Age 65 to 74
In terms of disability age 65 to 74, the demographic groups most similar to Immigrants from Indonesia are Immigrants from Brazil (21.9%, a difference of 0.17%), Immigrants from Spain (21.9%, a difference of 0.19%), Croatian (21.8%, a difference of 0.26%), Immigrants from Lebanon (21.9%, a difference of 0.29%), and Immigrants from Norway (21.8%, a difference of 0.33%).
| Demographics | Rating | Rank | Disability Age 65 to 74 |
| Mongolians | 99.0 /100 | #75 | Exceptional 21.8% |
| Greeks | 99.0 /100 | #76 | Exceptional 21.8% |
| Immigrants | Poland | 99.0 /100 | #77 | Exceptional 21.8% |
| Immigrants | Eastern Europe | 99.0 /100 | #78 | Exceptional 21.8% |
| Venezuelans | 99.0 /100 | #79 | Exceptional 21.8% |
| Immigrants | Norway | 98.9 /100 | #80 | Exceptional 21.8% |
| Croatians | 98.9 /100 | #81 | Exceptional 21.8% |
| Immigrants | Indonesia | 98.7 /100 | #82 | Exceptional 21.9% |
| Immigrants | Brazil | 98.5 /100 | #83 | Exceptional 21.9% |
| Immigrants | Spain | 98.5 /100 | #84 | Exceptional 21.9% |
| Immigrants | Lebanon | 98.4 /100 | #85 | Exceptional 21.9% |
| South Africans | 98.4 /100 | #86 | Exceptional 21.9% |
| Australians | 98.0 /100 | #87 | Exceptional 22.0% |
| Immigrants | Netherlands | 97.9 /100 | #88 | Exceptional 22.0% |
| Immigrants | Kuwait | 97.9 /100 | #89 | Exceptional 22.0% |
Demographics Similar to Czechoslovakians by Disability Age 65 to 74
In terms of disability age 65 to 74, the demographic groups most similar to Czechoslovakians are British (23.0%, a difference of 0.11%), Immigrants from Western Asia (23.0%, a difference of 0.11%), Sri Lankan (23.0%, a difference of 0.12%), Slavic (23.0%, a difference of 0.21%), and Immigrants from Vietnam (23.1%, a difference of 0.23%).
| Demographics | Rating | Rank | Disability Age 65 to 74 |
| Canadians | 77.7 /100 | #150 | Good 22.9% |
| Immigrants | Morocco | 77.6 /100 | #151 | Good 22.9% |
| Finns | 76.5 /100 | #152 | Good 22.9% |
| Slavs | 75.2 /100 | #153 | Good 23.0% |
| Sri Lankans | 74.0 /100 | #154 | Good 23.0% |
| British | 73.9 /100 | #155 | Good 23.0% |
| Immigrants | Western Asia | 73.8 /100 | #156 | Good 23.0% |
| Czechoslovakians | 72.4 /100 | #157 | Good 23.0% |
| Immigrants | Vietnam | 69.1 /100 | #158 | Good 23.1% |
| South American Indians | 65.5 /100 | #159 | Good 23.1% |
| Koreans | 64.2 /100 | #160 | Good 23.1% |
| Immigrants | Cameroon | 63.8 /100 | #161 | Good 23.1% |
| Europeans | 61.2 /100 | #162 | Good 23.2% |
| Immigrants | Philippines | 61.1 /100 | #163 | Good 23.2% |
| Sierra Leoneans | 60.9 /100 | #164 | Good 23.2% |