Subsaharan African vs Northern European Disability Age 65 to 74
COMPARE
Subsaharan African
Northern European
Disability Age 65 to 74
Disability Age 65 to 74 Comparison
Sub-Saharan Africans
Northern Europeans
25.1%
DISABILITY AGE 65 TO 74
0.6/ 100
METRIC RATING
253rd/ 347
METRIC RANK
22.6%
DISABILITY AGE 65 TO 74
88.9/ 100
METRIC RATING
133rd/ 347
METRIC RANK
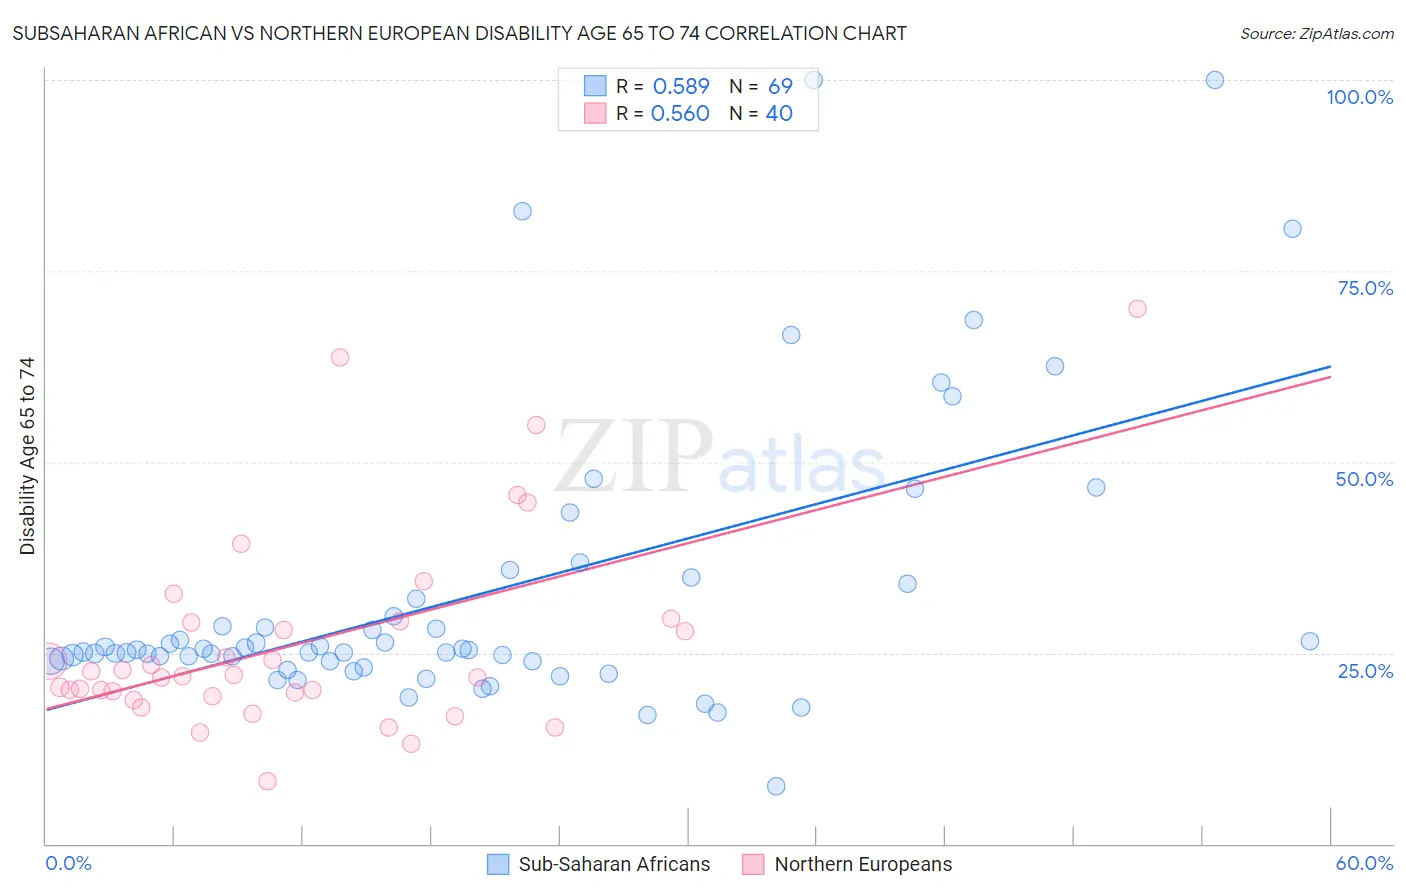
Subsaharan African vs Northern European Disability Age 65 to 74 Correlation Chart
The statistical analysis conducted on geographies consisting of 506,486,159 people shows a substantial positive correlation between the proportion of Sub-Saharan Africans and percentage of population with a disability between the ages 65 and 75 in the United States with a correlation coefficient (R) of 0.589 and weighted average of 25.1%. Similarly, the statistical analysis conducted on geographies consisting of 405,506,893 people shows a substantial positive correlation between the proportion of Northern Europeans and percentage of population with a disability between the ages 65 and 75 in the United States with a correlation coefficient (R) of 0.560 and weighted average of 22.6%, a difference of 10.8%.
Disability Age 65 to 74 Correlation Summary
| Measurement | Subsaharan African | Northern European |
| Minimum | 7.5% | 8.1% |
| Maximum | 100.0% | 70.0% |
| Range | 92.5% | 61.9% |
| Mean | 32.6% | 26.3% |
| Median | 25.4% | 22.0% |
| Interquartile 25% (IQ1) | 23.9% | 19.6% |
| Interquartile 75% (IQ3) | 33.0% | 29.0% |
| Interquartile Range (IQR) | 9.1% | 9.4% |
| Standard Deviation (Sample) | 18.8% | 13.2% |
| Standard Deviation (Population) | 18.7% | 13.0% |
Similar Demographics by Disability Age 65 to 74
Demographics Similar to Sub-Saharan Africans by Disability Age 65 to 74
In terms of disability age 65 to 74, the demographic groups most similar to Sub-Saharan Africans are Immigrants from El Salvador (25.1%, a difference of 0.030%), Somali (25.1%, a difference of 0.080%), Nonimmigrants (25.0%, a difference of 0.23%), Central American (25.1%, a difference of 0.23%), and Salvadoran (25.0%, a difference of 0.43%).
| Demographics | Rating | Rank | Disability Age 65 to 74 |
| Immigrants | Iraq | 1.9 /100 | #246 | Tragic 24.7% |
| Indonesians | 1.1 /100 | #247 | Tragic 24.9% |
| Senegalese | 0.9 /100 | #248 | Tragic 24.9% |
| Immigrants | Fiji | 0.8 /100 | #249 | Tragic 25.0% |
| Salvadorans | 0.8 /100 | #250 | Tragic 25.0% |
| Immigrants | Nonimmigrants | 0.7 /100 | #251 | Tragic 25.0% |
| Immigrants | El Salvador | 0.6 /100 | #252 | Tragic 25.1% |
| Sub-Saharan Africans | 0.6 /100 | #253 | Tragic 25.1% |
| Somalis | 0.6 /100 | #254 | Tragic 25.1% |
| Central Americans | 0.5 /100 | #255 | Tragic 25.1% |
| Immigrants | Somalia | 0.4 /100 | #256 | Tragic 25.2% |
| Guamanians/Chamorros | 0.3 /100 | #257 | Tragic 25.3% |
| Marshallese | 0.3 /100 | #258 | Tragic 25.3% |
| Immigrants | Cambodia | 0.3 /100 | #259 | Tragic 25.3% |
| Malaysians | 0.2 /100 | #260 | Tragic 25.4% |
Demographics Similar to Northern Europeans by Disability Age 65 to 74
In terms of disability age 65 to 74, the demographic groups most similar to Northern Europeans are Costa Rican (22.6%, a difference of 0.050%), Afghan (22.6%, a difference of 0.050%), Immigrants from Nepal (22.6%, a difference of 0.080%), Immigrants from Ukraine (22.6%, a difference of 0.080%), and Ethiopian (22.7%, a difference of 0.15%).
| Demographics | Rating | Rank | Disability Age 65 to 74 |
| Lebanese | 92.2 /100 | #126 | Exceptional 22.5% |
| Slovaks | 91.6 /100 | #127 | Exceptional 22.5% |
| Immigrants | Costa Rica | 90.4 /100 | #128 | Exceptional 22.6% |
| Immigrants | Uruguay | 90.1 /100 | #129 | Exceptional 22.6% |
| Immigrants | Albania | 90.0 /100 | #130 | Excellent 22.6% |
| Immigrants | Nepal | 89.4 /100 | #131 | Excellent 22.6% |
| Costa Ricans | 89.2 /100 | #132 | Excellent 22.6% |
| Northern Europeans | 88.9 /100 | #133 | Excellent 22.6% |
| Afghans | 88.6 /100 | #134 | Excellent 22.6% |
| Immigrants | Ukraine | 88.4 /100 | #135 | Excellent 22.6% |
| Ethiopians | 87.9 /100 | #136 | Excellent 22.7% |
| Taiwanese | 87.6 /100 | #137 | Excellent 22.7% |
| Immigrants | Moldova | 87.3 /100 | #138 | Excellent 22.7% |
| Immigrants | Syria | 85.8 /100 | #139 | Excellent 22.7% |
| Ugandans | 85.4 /100 | #140 | Excellent 22.7% |