Subsaharan African vs Osage Disability Age 65 to 74
COMPARE
Subsaharan African
Osage
Disability Age 65 to 74
Disability Age 65 to 74 Comparison
Sub-Saharan Africans
Osage
25.1%
DISABILITY AGE 65 TO 74
0.6/ 100
METRIC RATING
253rd/ 347
METRIC RANK
27.5%
DISABILITY AGE 65 TO 74
0.0/ 100
METRIC RATING
312th/ 347
METRIC RANK
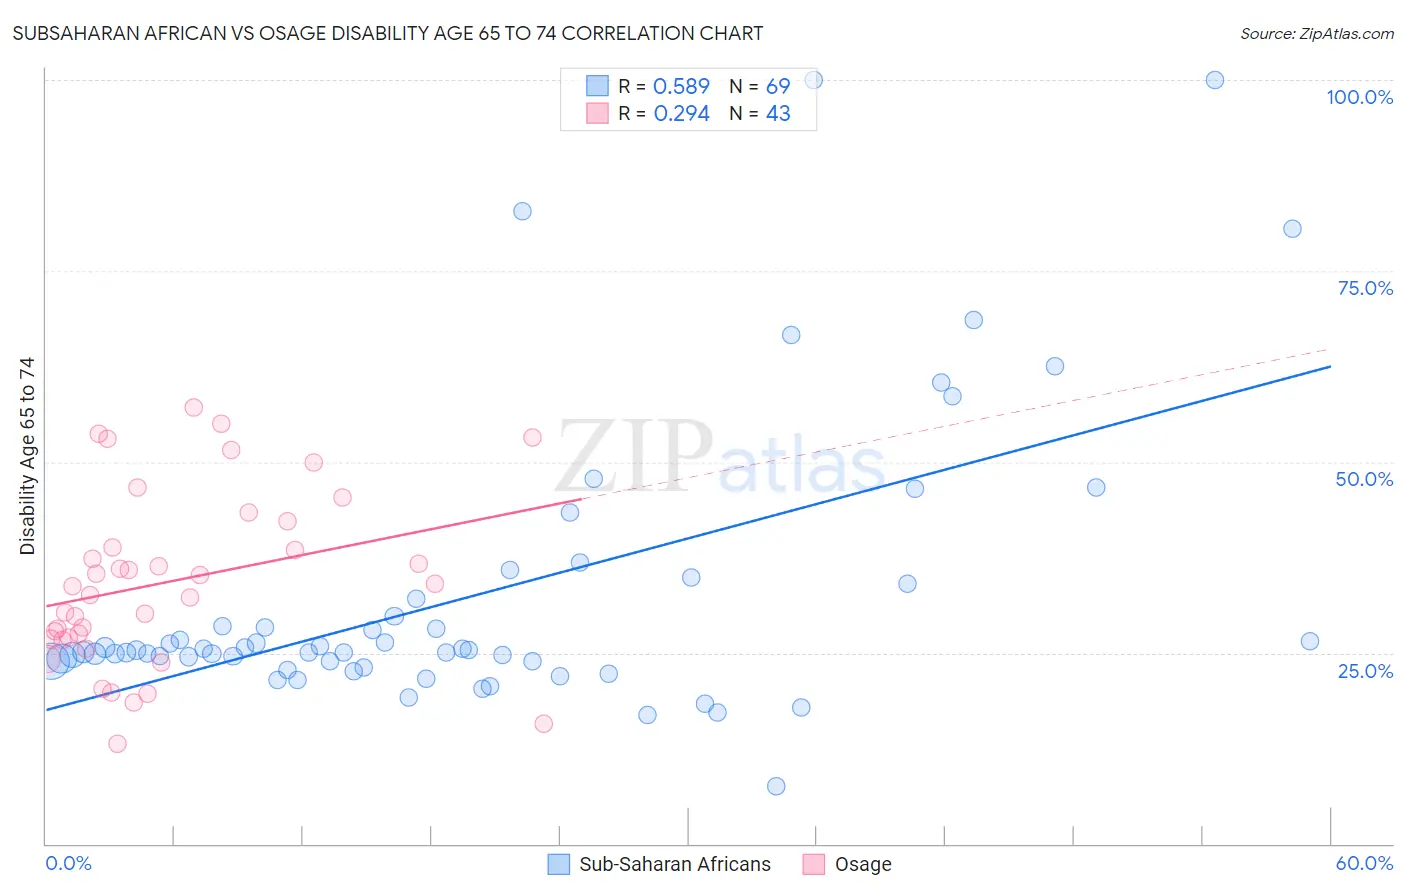
Subsaharan African vs Osage Disability Age 65 to 74 Correlation Chart
The statistical analysis conducted on geographies consisting of 506,486,159 people shows a substantial positive correlation between the proportion of Sub-Saharan Africans and percentage of population with a disability between the ages 65 and 75 in the United States with a correlation coefficient (R) of 0.589 and weighted average of 25.1%. Similarly, the statistical analysis conducted on geographies consisting of 91,763,527 people shows a weak positive correlation between the proportion of Osage and percentage of population with a disability between the ages 65 and 75 in the United States with a correlation coefficient (R) of 0.294 and weighted average of 27.5%, a difference of 9.5%.
Disability Age 65 to 74 Correlation Summary
| Measurement | Subsaharan African | Osage |
| Minimum | 7.5% | 13.0% |
| Maximum | 100.0% | 57.1% |
| Range | 92.5% | 44.1% |
| Mean | 32.6% | 34.3% |
| Median | 25.4% | 33.7% |
| Interquartile 25% (IQ1) | 23.9% | 26.8% |
| Interquartile 75% (IQ3) | 33.0% | 42.2% |
| Interquartile Range (IQR) | 9.1% | 15.4% |
| Standard Deviation (Sample) | 18.8% | 11.3% |
| Standard Deviation (Population) | 18.7% | 11.2% |
Similar Demographics by Disability Age 65 to 74
Demographics Similar to Sub-Saharan Africans by Disability Age 65 to 74
In terms of disability age 65 to 74, the demographic groups most similar to Sub-Saharan Africans are Immigrants from El Salvador (25.1%, a difference of 0.030%), Somali (25.1%, a difference of 0.080%), Nonimmigrants (25.0%, a difference of 0.23%), Central American (25.1%, a difference of 0.23%), and Salvadoran (25.0%, a difference of 0.43%).
| Demographics | Rating | Rank | Disability Age 65 to 74 |
| Immigrants | Iraq | 1.9 /100 | #246 | Tragic 24.7% |
| Indonesians | 1.1 /100 | #247 | Tragic 24.9% |
| Senegalese | 0.9 /100 | #248 | Tragic 24.9% |
| Immigrants | Fiji | 0.8 /100 | #249 | Tragic 25.0% |
| Salvadorans | 0.8 /100 | #250 | Tragic 25.0% |
| Immigrants | Nonimmigrants | 0.7 /100 | #251 | Tragic 25.0% |
| Immigrants | El Salvador | 0.6 /100 | #252 | Tragic 25.1% |
| Sub-Saharan Africans | 0.6 /100 | #253 | Tragic 25.1% |
| Somalis | 0.6 /100 | #254 | Tragic 25.1% |
| Central Americans | 0.5 /100 | #255 | Tragic 25.1% |
| Immigrants | Somalia | 0.4 /100 | #256 | Tragic 25.2% |
| Guamanians/Chamorros | 0.3 /100 | #257 | Tragic 25.3% |
| Marshallese | 0.3 /100 | #258 | Tragic 25.3% |
| Immigrants | Cambodia | 0.3 /100 | #259 | Tragic 25.3% |
| Malaysians | 0.2 /100 | #260 | Tragic 25.4% |
Demographics Similar to Osage by Disability Age 65 to 74
In terms of disability age 65 to 74, the demographic groups most similar to Osage are Menominee (27.4%, a difference of 0.080%), Shoshone (27.4%, a difference of 0.30%), Yaqui (27.4%, a difference of 0.35%), Sioux (27.3%, a difference of 0.41%), and Ute (27.3%, a difference of 0.56%).
| Demographics | Rating | Rank | Disability Age 65 to 74 |
| Mexicans | 0.0 /100 | #305 | Tragic 27.2% |
| Blacks/African Americans | 0.0 /100 | #306 | Tragic 27.3% |
| Ute | 0.0 /100 | #307 | Tragic 27.3% |
| Sioux | 0.0 /100 | #308 | Tragic 27.3% |
| Yaqui | 0.0 /100 | #309 | Tragic 27.4% |
| Shoshone | 0.0 /100 | #310 | Tragic 27.4% |
| Menominee | 0.0 /100 | #311 | Tragic 27.4% |
| Osage | 0.0 /100 | #312 | Tragic 27.5% |
| Paiute | 0.0 /100 | #313 | Tragic 27.8% |
| Chippewa | 0.0 /100 | #314 | Tragic 27.8% |
| Cajuns | 0.0 /100 | #315 | Tragic 27.9% |
| Crow | 0.0 /100 | #316 | Tragic 27.9% |
| Immigrants | Armenia | 0.0 /100 | #317 | Tragic 28.0% |
| Nepalese | 0.0 /100 | #318 | Tragic 28.0% |
| Arapaho | 0.0 /100 | #319 | Tragic 28.1% |