Dutch vs Czechoslovakian Disability Age 65 to 74
COMPARE
Dutch
Czechoslovakian
Disability Age 65 to 74
Disability Age 65 to 74 Comparison
Dutch
Czechoslovakians
23.3%
DISABILITY AGE 65 TO 74
49.4/ 100
METRIC RATING
175th/ 347
METRIC RANK
23.0%
DISABILITY AGE 65 TO 74
72.4/ 100
METRIC RATING
157th/ 347
METRIC RANK
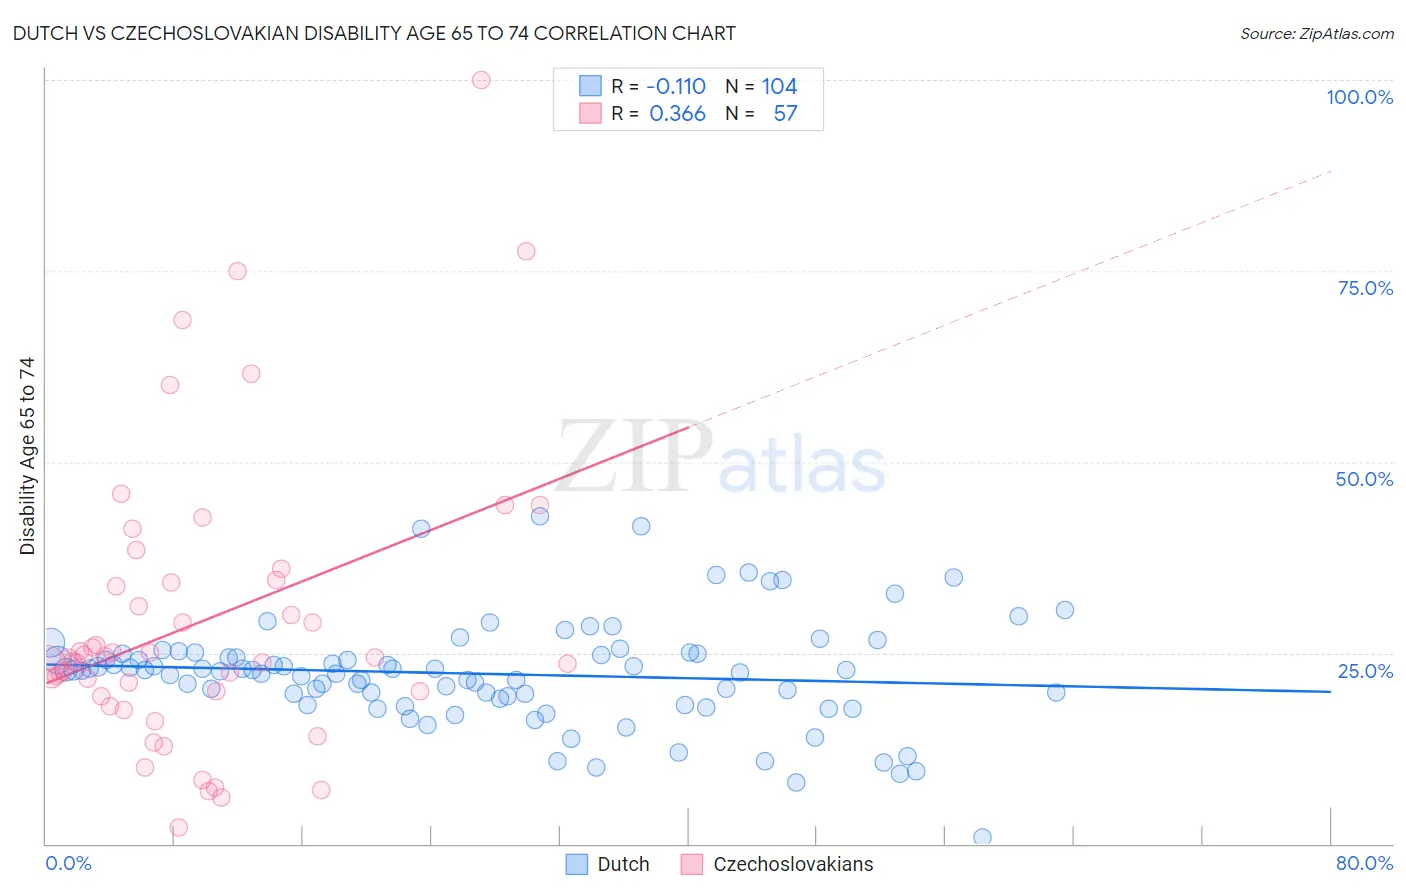
Dutch vs Czechoslovakian Disability Age 65 to 74 Correlation Chart
The statistical analysis conducted on geographies consisting of 552,341,864 people shows a poor negative correlation between the proportion of Dutch and percentage of population with a disability between the ages 65 and 75 in the United States with a correlation coefficient (R) of -0.110 and weighted average of 23.3%. Similarly, the statistical analysis conducted on geographies consisting of 368,238,154 people shows a mild positive correlation between the proportion of Czechoslovakians and percentage of population with a disability between the ages 65 and 75 in the United States with a correlation coefficient (R) of 0.366 and weighted average of 23.0%, a difference of 1.5%.
Disability Age 65 to 74 Correlation Summary
| Measurement | Dutch | Czechoslovakian |
| Minimum | 0.85% | 2.1% |
| Maximum | 42.9% | 100.0% |
| Range | 42.0% | 97.9% |
| Mean | 22.2% | 29.0% |
| Median | 22.7% | 24.3% |
| Interquartile 25% (IQ1) | 19.2% | 19.6% |
| Interquartile 75% (IQ3) | 24.8% | 34.3% |
| Interquartile Range (IQR) | 5.7% | 14.7% |
| Standard Deviation (Sample) | 6.9% | 18.9% |
| Standard Deviation (Population) | 6.9% | 18.7% |
Demographics Similar to Dutch and Czechoslovakians by Disability Age 65 to 74
In terms of disability age 65 to 74, the demographic groups most similar to Dutch are Immigrants from South Eastern Asia (23.3%, a difference of 0.040%), Yugoslavian (23.3%, a difference of 0.050%), German (23.3%, a difference of 0.070%), Immigrants from Eritrea (23.4%, a difference of 0.11%), and Cuban (23.3%, a difference of 0.15%). Similarly, the demographic groups most similar to Czechoslovakians are Immigrants from Western Asia (23.0%, a difference of 0.11%), Immigrants from Vietnam (23.1%, a difference of 0.23%), South American Indian (23.1%, a difference of 0.48%), Korean (23.1%, a difference of 0.56%), and Immigrants from Cameroon (23.1%, a difference of 0.59%).
| Demographics | Rating | Rank | Disability Age 65 to 74 |
| Immigrants | Western Asia | 73.8 /100 | #156 | Good 23.0% |
| Czechoslovakians | 72.4 /100 | #157 | Good 23.0% |
| Immigrants | Vietnam | 69.1 /100 | #158 | Good 23.1% |
| South American Indians | 65.5 /100 | #159 | Good 23.1% |
| Koreans | 64.2 /100 | #160 | Good 23.1% |
| Immigrants | Cameroon | 63.8 /100 | #161 | Good 23.1% |
| Europeans | 61.2 /100 | #162 | Good 23.2% |
| Immigrants | Philippines | 61.1 /100 | #163 | Good 23.2% |
| Sierra Leoneans | 60.9 /100 | #164 | Good 23.2% |
| Vietnamese | 60.8 /100 | #165 | Good 23.2% |
| Immigrants | Afghanistan | 60.5 /100 | #166 | Good 23.2% |
| Immigrants | Bosnia and Herzegovina | 57.6 /100 | #167 | Average 23.2% |
| Pakistanis | 57.0 /100 | #168 | Average 23.2% |
| Icelanders | 54.3 /100 | #169 | Average 23.3% |
| Moroccans | 54.2 /100 | #170 | Average 23.3% |
| Cubans | 51.9 /100 | #171 | Average 23.3% |
| Germans | 50.5 /100 | #172 | Average 23.3% |
| Yugoslavians | 50.2 /100 | #173 | Average 23.3% |
| Immigrants | South Eastern Asia | 50.0 /100 | #174 | Average 23.3% |
| Dutch | 49.4 /100 | #175 | Average 23.3% |
| Immigrants | Eritrea | 47.5 /100 | #176 | Average 23.4% |