Scandinavian vs Ukrainian Disability Age Over 75
COMPARE
Scandinavian
Ukrainian
Disability Age Over 75
Disability Age Over 75 Comparison
Scandinavians
Ukrainians
46.6%
DISABILITY AGE OVER 75
93.6/ 100
METRIC RATING
121st/ 347
METRIC RANK
46.4%
DISABILITY AGE OVER 75
97.1/ 100
METRIC RATING
103rd/ 347
METRIC RANK
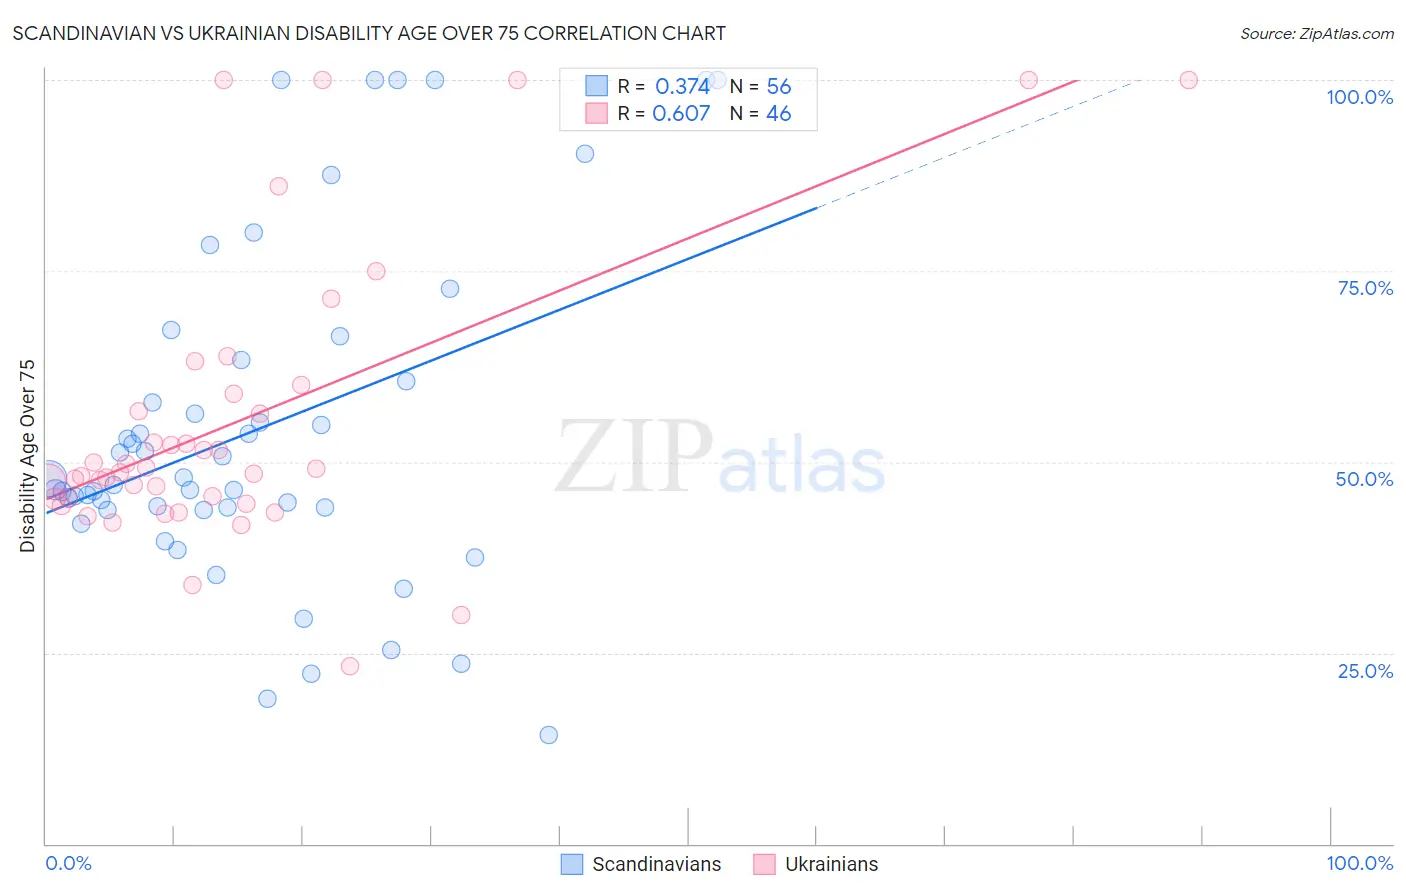
Scandinavian vs Ukrainian Disability Age Over 75 Correlation Chart
The statistical analysis conducted on geographies consisting of 471,447,012 people shows a mild positive correlation between the proportion of Scandinavians and percentage of population with a disability over the age of 75 in the United States with a correlation coefficient (R) of 0.374 and weighted average of 46.6%. Similarly, the statistical analysis conducted on geographies consisting of 447,710,922 people shows a significant positive correlation between the proportion of Ukrainians and percentage of population with a disability over the age of 75 in the United States with a correlation coefficient (R) of 0.607 and weighted average of 46.4%, a difference of 0.47%.
Disability Age Over 75 Correlation Summary
| Measurement | Scandinavian | Ukrainian |
| Minimum | 14.3% | 23.2% |
| Maximum | 100.0% | 100.0% |
| Range | 85.7% | 76.8% |
| Mean | 54.2% | 55.4% |
| Median | 47.4% | 48.9% |
| Interquartile 25% (IQ1) | 43.9% | 45.2% |
| Interquartile 75% (IQ3) | 62.0% | 58.8% |
| Interquartile Range (IQR) | 18.1% | 13.7% |
| Standard Deviation (Sample) | 21.9% | 18.9% |
| Standard Deviation (Population) | 21.7% | 18.7% |
Demographics Similar to Scandinavians and Ukrainians by Disability Age Over 75
In terms of disability age over 75, the demographic groups most similar to Scandinavians are Immigrants from Nepal (46.6%, a difference of 0.050%), Immigrants from Albania (46.6%, a difference of 0.050%), Canadian (46.6%, a difference of 0.080%), Czechoslovakian (46.6%, a difference of 0.10%), and Hungarian (46.5%, a difference of 0.18%). Similarly, the demographic groups most similar to Ukrainians are Immigrants from Malaysia (46.4%, a difference of 0.010%), Israeli (46.4%, a difference of 0.020%), Immigrants from Cameroon (46.4%, a difference of 0.040%), Immigrants from Kuwait (46.4%, a difference of 0.050%), and Immigrants from Uruguay (46.4%, a difference of 0.090%).
| Demographics | Rating | Rank | Disability Age Over 75 |
| Immigrants | Malaysia | 97.1 /100 | #102 | Exceptional 46.4% |
| Ukrainians | 97.1 /100 | #103 | Exceptional 46.4% |
| Israelis | 97.0 /100 | #104 | Exceptional 46.4% |
| Immigrants | Cameroon | 96.9 /100 | #105 | Exceptional 46.4% |
| Immigrants | Kuwait | 96.8 /100 | #106 | Exceptional 46.4% |
| Immigrants | Uruguay | 96.7 /100 | #107 | Exceptional 46.4% |
| Brazilians | 96.6 /100 | #108 | Exceptional 46.5% |
| Chileans | 96.4 /100 | #109 | Exceptional 46.5% |
| Immigrants | Hong Kong | 96.4 /100 | #110 | Exceptional 46.5% |
| Immigrants | Chile | 96.4 /100 | #111 | Exceptional 46.5% |
| Immigrants | Pakistan | 96.1 /100 | #112 | Exceptional 46.5% |
| Irish | 96.0 /100 | #113 | Exceptional 46.5% |
| Dutch | 95.9 /100 | #114 | Exceptional 46.5% |
| British | 95.7 /100 | #115 | Exceptional 46.5% |
| Indians (Asian) | 95.7 /100 | #116 | Exceptional 46.5% |
| Hungarians | 95.3 /100 | #117 | Exceptional 46.5% |
| Czechoslovakians | 94.7 /100 | #118 | Exceptional 46.6% |
| Canadians | 94.4 /100 | #119 | Exceptional 46.6% |
| Immigrants | Nepal | 94.1 /100 | #120 | Exceptional 46.6% |
| Scandinavians | 93.6 /100 | #121 | Exceptional 46.6% |
| Immigrants | Albania | 93.2 /100 | #122 | Exceptional 46.6% |