Scotch-Irish vs Ukrainian Female Unemployment
COMPARE
Scotch-Irish
Ukrainian
Female Unemployment
Female Unemployment Comparison
Scotch-Irish
Ukrainians
4.8%
FEMALE UNEMPLOYMENT
99.6/ 100
METRIC RATING
39th/ 347
METRIC RANK
5.0%
FEMALE UNEMPLOYMENT
97.1/ 100
METRIC RATING
85th/ 347
METRIC RANK
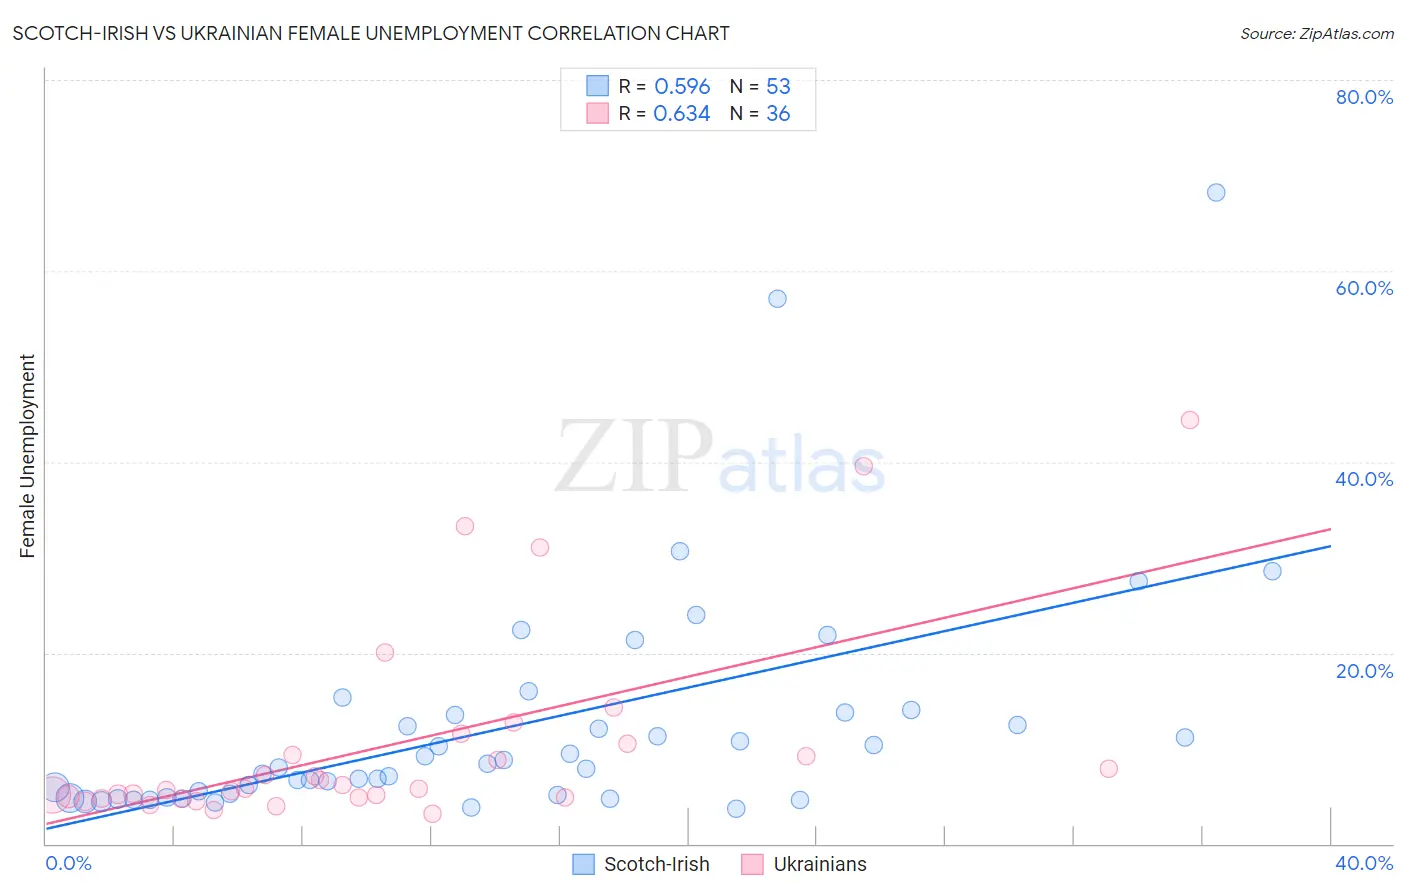
Scotch-Irish vs Ukrainian Female Unemployment Correlation Chart
The statistical analysis conducted on geographies consisting of 537,046,188 people shows a substantial positive correlation between the proportion of Scotch-Irish and unemploymnet rate among females in the United States with a correlation coefficient (R) of 0.596 and weighted average of 4.8%. Similarly, the statistical analysis conducted on geographies consisting of 444,684,772 people shows a significant positive correlation between the proportion of Ukrainians and unemploymnet rate among females in the United States with a correlation coefficient (R) of 0.634 and weighted average of 5.0%, a difference of 3.3%.
Female Unemployment Correlation Summary
| Measurement | Scotch-Irish | Ukrainian |
| Minimum | 3.7% | 3.2% |
| Maximum | 68.2% | 44.4% |
| Range | 64.5% | 41.2% |
| Mean | 12.3% | 10.3% |
| Median | 8.0% | 5.8% |
| Interquartile 25% (IQ1) | 5.0% | 4.8% |
| Interquartile 75% (IQ3) | 13.6% | 9.9% |
| Interquartile Range (IQR) | 8.7% | 5.1% |
| Standard Deviation (Sample) | 12.2% | 10.3% |
| Standard Deviation (Population) | 12.1% | 10.2% |
Similar Demographics by Female Unemployment
Demographics Similar to Scotch-Irish by Female Unemployment
In terms of female unemployment, the demographic groups most similar to Scotch-Irish are Northern European (4.8%, a difference of 0.010%), French (4.8%, a difference of 0.040%), Pennsylvania German (4.8%, a difference of 0.12%), Tongan (4.8%, a difference of 0.30%), and Italian (4.8%, a difference of 0.43%).
| Demographics | Rating | Rank | Female Unemployment |
| Slovaks | 99.8 /100 | #32 | Exceptional 4.8% |
| Czechoslovakians | 99.7 /100 | #33 | Exceptional 4.8% |
| Zimbabweans | 99.7 /100 | #34 | Exceptional 4.8% |
| French Canadians | 99.7 /100 | #35 | Exceptional 4.8% |
| Yugoslavians | 99.7 /100 | #36 | Exceptional 4.8% |
| Pennsylvania Germans | 99.6 /100 | #37 | Exceptional 4.8% |
| Northern Europeans | 99.6 /100 | #38 | Exceptional 4.8% |
| Scotch-Irish | 99.6 /100 | #39 | Exceptional 4.8% |
| French | 99.6 /100 | #40 | Exceptional 4.8% |
| Tongans | 99.5 /100 | #41 | Exceptional 4.8% |
| Italians | 99.5 /100 | #42 | Exceptional 4.8% |
| Eastern Europeans | 99.4 /100 | #43 | Exceptional 4.9% |
| Greeks | 99.4 /100 | #44 | Exceptional 4.9% |
| Austrians | 99.3 /100 | #45 | Exceptional 4.9% |
| Immigrants | Bulgaria | 99.3 /100 | #46 | Exceptional 4.9% |
Demographics Similar to Ukrainians by Female Unemployment
In terms of female unemployment, the demographic groups most similar to Ukrainians are Bolivian (5.0%, a difference of 0.010%), Canadian (5.0%, a difference of 0.040%), Immigrants from Serbia (5.0%, a difference of 0.080%), Immigrants from Australia (5.0%, a difference of 0.090%), and Venezuelan (5.0%, a difference of 0.10%).
| Demographics | Rating | Rank | Female Unemployment |
| Immigrants | Netherlands | 97.8 /100 | #78 | Exceptional 5.0% |
| Turks | 97.6 /100 | #79 | Exceptional 5.0% |
| New Zealanders | 97.4 /100 | #80 | Exceptional 5.0% |
| Filipinos | 97.3 /100 | #81 | Exceptional 5.0% |
| Immigrants | Australia | 97.3 /100 | #82 | Exceptional 5.0% |
| Immigrants | Serbia | 97.2 /100 | #83 | Exceptional 5.0% |
| Canadians | 97.2 /100 | #84 | Exceptional 5.0% |
| Ukrainians | 97.1 /100 | #85 | Exceptional 5.0% |
| Bolivians | 97.1 /100 | #86 | Exceptional 5.0% |
| Venezuelans | 96.9 /100 | #87 | Exceptional 5.0% |
| Immigrants | Sudan | 96.7 /100 | #88 | Exceptional 5.0% |
| Immigrants | Taiwan | 96.6 /100 | #89 | Exceptional 5.0% |
| Immigrants | Sweden | 96.3 /100 | #90 | Exceptional 5.0% |
| Immigrants | Japan | 96.0 /100 | #91 | Exceptional 5.0% |
| Romanians | 95.9 /100 | #92 | Exceptional 5.0% |