Immigrants from Colombia vs Ukrainian Disability Age Over 75
COMPARE
Immigrants from Colombia
Ukrainian
Disability Age Over 75
Disability Age Over 75 Comparison
Immigrants from Colombia
Ukrainians
46.7%
DISABILITY AGE OVER 75
92.6/ 100
METRIC RATING
123rd/ 347
METRIC RANK
46.4%
DISABILITY AGE OVER 75
97.1/ 100
METRIC RATING
103rd/ 347
METRIC RANK
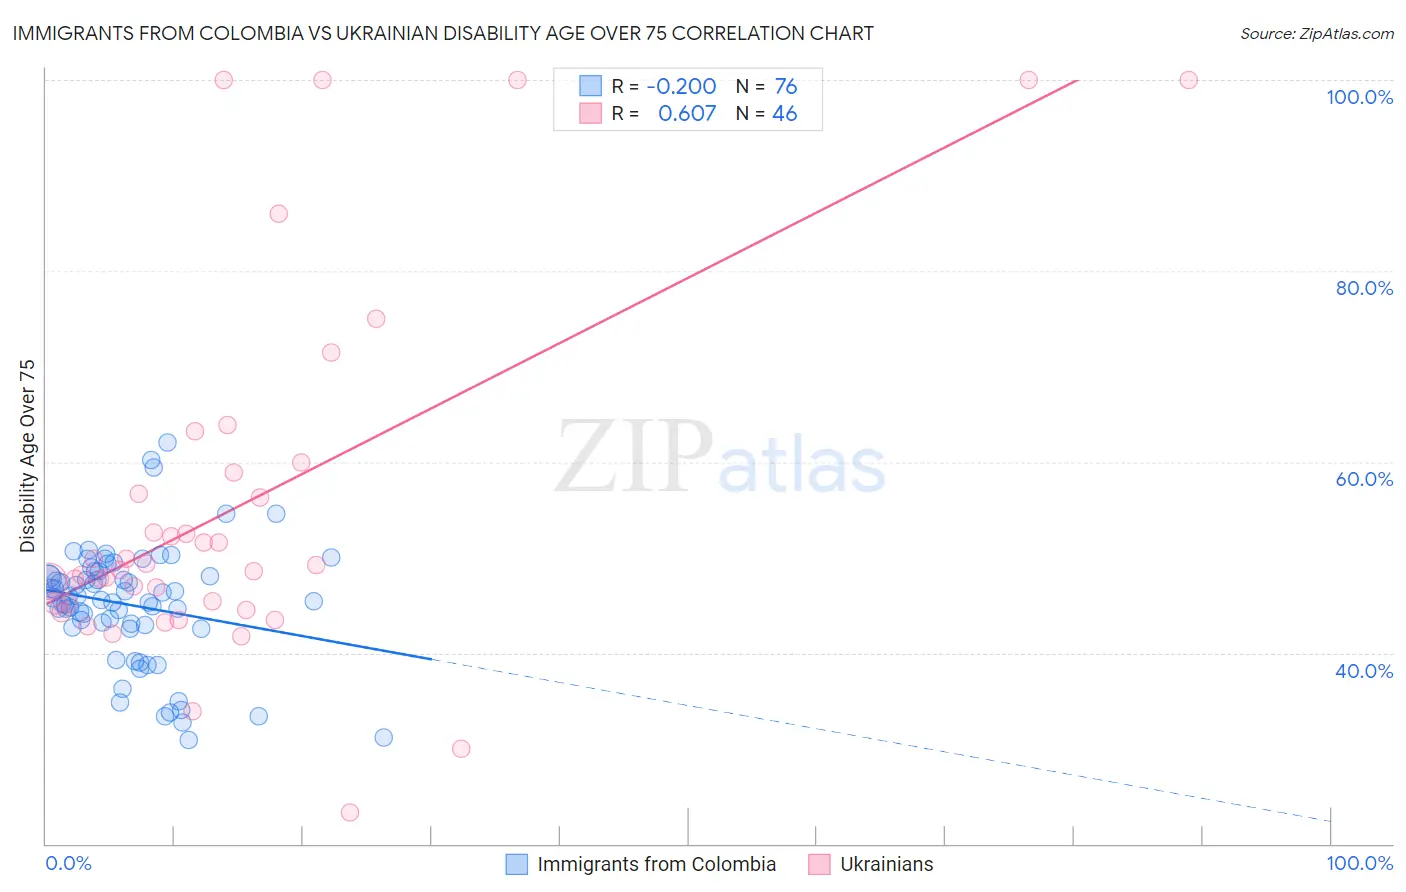
Immigrants from Colombia vs Ukrainian Disability Age Over 75 Correlation Chart
The statistical analysis conducted on geographies consisting of 378,064,071 people shows a poor negative correlation between the proportion of Immigrants from Colombia and percentage of population with a disability over the age of 75 in the United States with a correlation coefficient (R) of -0.200 and weighted average of 46.7%. Similarly, the statistical analysis conducted on geographies consisting of 447,710,922 people shows a significant positive correlation between the proportion of Ukrainians and percentage of population with a disability over the age of 75 in the United States with a correlation coefficient (R) of 0.607 and weighted average of 46.4%, a difference of 0.57%.
Disability Age Over 75 Correlation Summary
| Measurement | Immigrants from Colombia | Ukrainian |
| Minimum | 30.8% | 23.2% |
| Maximum | 62.0% | 100.0% |
| Range | 31.2% | 76.8% |
| Mean | 45.0% | 55.4% |
| Median | 45.6% | 48.9% |
| Interquartile 25% (IQ1) | 42.8% | 45.2% |
| Interquartile 75% (IQ3) | 48.3% | 58.8% |
| Interquartile Range (IQR) | 5.5% | 13.7% |
| Standard Deviation (Sample) | 6.2% | 18.9% |
| Standard Deviation (Population) | 6.2% | 18.7% |
Demographics Similar to Immigrants from Colombia and Ukrainians by Disability Age Over 75
In terms of disability age over 75, the demographic groups most similar to Immigrants from Colombia are Immigrants from Albania (46.6%, a difference of 0.050%), Scandinavian (46.6%, a difference of 0.10%), Immigrants from Nepal (46.6%, a difference of 0.14%), Canadian (46.6%, a difference of 0.18%), and Czechoslovakian (46.6%, a difference of 0.20%). Similarly, the demographic groups most similar to Ukrainians are Israeli (46.4%, a difference of 0.020%), Immigrants from Cameroon (46.4%, a difference of 0.040%), Immigrants from Kuwait (46.4%, a difference of 0.050%), Immigrants from Uruguay (46.4%, a difference of 0.090%), and Brazilian (46.5%, a difference of 0.10%).
| Demographics | Rating | Rank | Disability Age Over 75 |
| Ukrainians | 97.1 /100 | #103 | Exceptional 46.4% |
| Israelis | 97.0 /100 | #104 | Exceptional 46.4% |
| Immigrants | Cameroon | 96.9 /100 | #105 | Exceptional 46.4% |
| Immigrants | Kuwait | 96.8 /100 | #106 | Exceptional 46.4% |
| Immigrants | Uruguay | 96.7 /100 | #107 | Exceptional 46.4% |
| Brazilians | 96.6 /100 | #108 | Exceptional 46.5% |
| Chileans | 96.4 /100 | #109 | Exceptional 46.5% |
| Immigrants | Hong Kong | 96.4 /100 | #110 | Exceptional 46.5% |
| Immigrants | Chile | 96.4 /100 | #111 | Exceptional 46.5% |
| Immigrants | Pakistan | 96.1 /100 | #112 | Exceptional 46.5% |
| Irish | 96.0 /100 | #113 | Exceptional 46.5% |
| Dutch | 95.9 /100 | #114 | Exceptional 46.5% |
| British | 95.7 /100 | #115 | Exceptional 46.5% |
| Indians (Asian) | 95.7 /100 | #116 | Exceptional 46.5% |
| Hungarians | 95.3 /100 | #117 | Exceptional 46.5% |
| Czechoslovakians | 94.7 /100 | #118 | Exceptional 46.6% |
| Canadians | 94.4 /100 | #119 | Exceptional 46.6% |
| Immigrants | Nepal | 94.1 /100 | #120 | Exceptional 46.6% |
| Scandinavians | 93.6 /100 | #121 | Exceptional 46.6% |
| Immigrants | Albania | 93.2 /100 | #122 | Exceptional 46.6% |
| Immigrants | Colombia | 92.6 /100 | #123 | Exceptional 46.7% |