Comanche vs Ukrainian Disability Age Over 75
COMPARE
Comanche
Ukrainian
Disability Age Over 75
Disability Age Over 75 Comparison
Comanche
Ukrainians
51.7%
DISABILITY AGE OVER 75
0.0/ 100
METRIC RATING
322nd/ 347
METRIC RANK
46.4%
DISABILITY AGE OVER 75
97.1/ 100
METRIC RATING
103rd/ 347
METRIC RANK
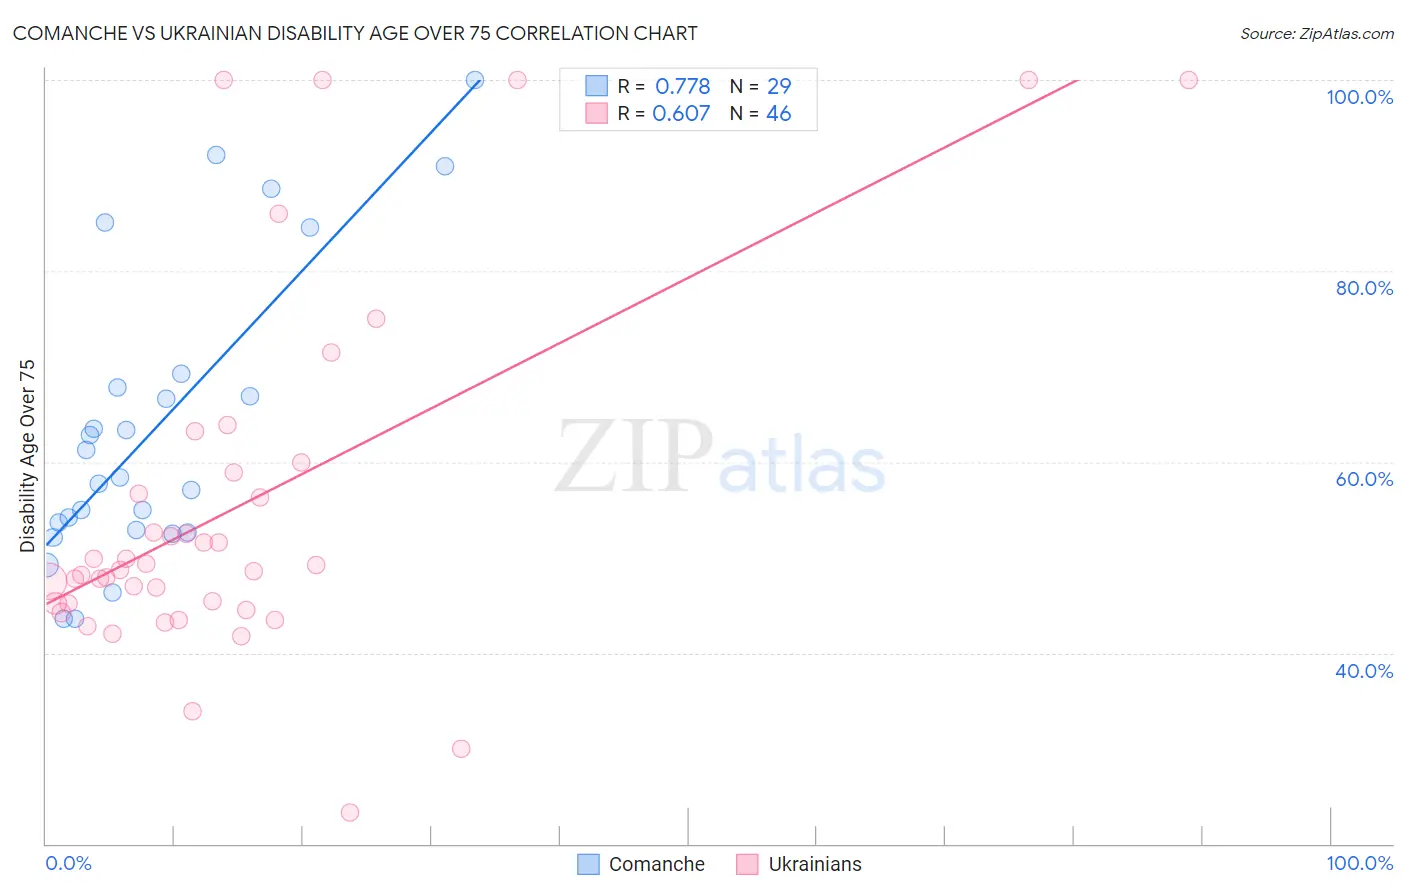
Comanche vs Ukrainian Disability Age Over 75 Correlation Chart
The statistical analysis conducted on geographies consisting of 109,684,350 people shows a strong positive correlation between the proportion of Comanche and percentage of population with a disability over the age of 75 in the United States with a correlation coefficient (R) of 0.778 and weighted average of 51.7%. Similarly, the statistical analysis conducted on geographies consisting of 447,710,922 people shows a significant positive correlation between the proportion of Ukrainians and percentage of population with a disability over the age of 75 in the United States with a correlation coefficient (R) of 0.607 and weighted average of 46.4%, a difference of 11.4%.
Disability Age Over 75 Correlation Summary
| Measurement | Comanche | Ukrainian |
| Minimum | 43.6% | 23.2% |
| Maximum | 100.0% | 100.0% |
| Range | 56.4% | 76.8% |
| Mean | 63.7% | 55.4% |
| Median | 58.4% | 48.9% |
| Interquartile 25% (IQ1) | 52.7% | 45.2% |
| Interquartile 75% (IQ3) | 68.5% | 58.8% |
| Interquartile Range (IQR) | 15.8% | 13.7% |
| Standard Deviation (Sample) | 15.5% | 18.9% |
| Standard Deviation (Population) | 15.2% | 18.7% |
Similar Demographics by Disability Age Over 75
Demographics Similar to Comanche by Disability Age Over 75
In terms of disability age over 75, the demographic groups most similar to Comanche are Paiute (51.5%, a difference of 0.34%), Dutch West Indian (51.5%, a difference of 0.34%), Creek (51.5%, a difference of 0.48%), Seminole (51.5%, a difference of 0.49%), and Immigrants from Yemen (52.0%, a difference of 0.52%).
| Demographics | Rating | Rank | Disability Age Over 75 |
| Mexicans | 0.0 /100 | #315 | Tragic 51.1% |
| Chickasaw | 0.0 /100 | #316 | Tragic 51.2% |
| Yakama | 0.0 /100 | #317 | Tragic 51.3% |
| Seminole | 0.0 /100 | #318 | Tragic 51.5% |
| Creek | 0.0 /100 | #319 | Tragic 51.5% |
| Paiute | 0.0 /100 | #320 | Tragic 51.5% |
| Dutch West Indians | 0.0 /100 | #321 | Tragic 51.5% |
| Comanche | 0.0 /100 | #322 | Tragic 51.7% |
| Immigrants | Yemen | 0.0 /100 | #323 | Tragic 52.0% |
| Menominee | 0.0 /100 | #324 | Tragic 52.3% |
| Immigrants | Cabo Verde | 0.0 /100 | #325 | Tragic 52.4% |
| Ute | 0.0 /100 | #326 | Tragic 52.6% |
| Nepalese | 0.0 /100 | #327 | Tragic 52.6% |
| Choctaw | 0.0 /100 | #328 | Tragic 52.7% |
| Alaska Natives | 0.0 /100 | #329 | Tragic 52.8% |
Demographics Similar to Ukrainians by Disability Age Over 75
In terms of disability age over 75, the demographic groups most similar to Ukrainians are Immigrants from Malaysia (46.4%, a difference of 0.010%), Israeli (46.4%, a difference of 0.020%), Immigrants from Cameroon (46.4%, a difference of 0.040%), Immigrants from Kuwait (46.4%, a difference of 0.050%), and Immigrants from Uruguay (46.4%, a difference of 0.090%).
| Demographics | Rating | Rank | Disability Age Over 75 |
| Immigrants | China | 98.0 /100 | #96 | Exceptional 46.3% |
| Finns | 97.9 /100 | #97 | Exceptional 46.3% |
| Immigrants | Japan | 97.8 /100 | #98 | Exceptional 46.3% |
| Palestinians | 97.7 /100 | #99 | Exceptional 46.3% |
| Immigrants | Eastern Europe | 97.7 /100 | #100 | Exceptional 46.3% |
| Mongolians | 97.7 /100 | #101 | Exceptional 46.3% |
| Immigrants | Malaysia | 97.1 /100 | #102 | Exceptional 46.4% |
| Ukrainians | 97.1 /100 | #103 | Exceptional 46.4% |
| Israelis | 97.0 /100 | #104 | Exceptional 46.4% |
| Immigrants | Cameroon | 96.9 /100 | #105 | Exceptional 46.4% |
| Immigrants | Kuwait | 96.8 /100 | #106 | Exceptional 46.4% |
| Immigrants | Uruguay | 96.7 /100 | #107 | Exceptional 46.4% |
| Brazilians | 96.6 /100 | #108 | Exceptional 46.5% |
| Chileans | 96.4 /100 | #109 | Exceptional 46.5% |
| Immigrants | Hong Kong | 96.4 /100 | #110 | Exceptional 46.5% |