Spaniard vs German Disability Age Over 75
COMPARE
Spaniard
German
Disability Age Over 75
Disability Age Over 75 Comparison
Spaniards
Germans
48.1%
DISABILITY AGE OVER 75
5.7/ 100
METRIC RATING
229th/ 347
METRIC RANK
46.3%
DISABILITY AGE OVER 75
98.2/ 100
METRIC RATING
92nd/ 347
METRIC RANK
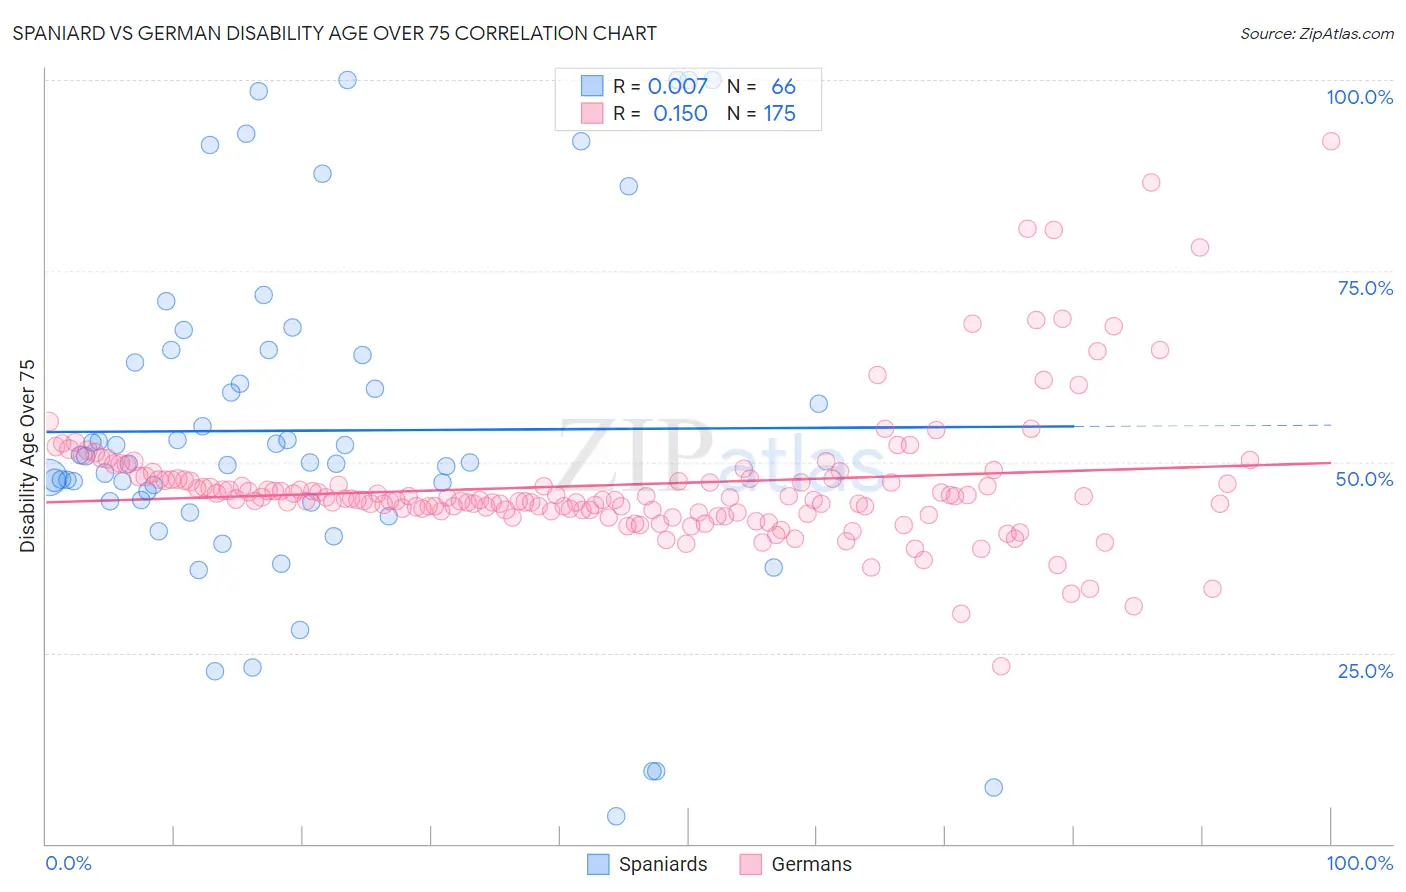
Spaniard vs German Disability Age Over 75 Correlation Chart
The statistical analysis conducted on geographies consisting of 442,367,902 people shows no correlation between the proportion of Spaniards and percentage of population with a disability over the age of 75 in the United States with a correlation coefficient (R) of 0.007 and weighted average of 48.1%. Similarly, the statistical analysis conducted on geographies consisting of 578,361,531 people shows a poor positive correlation between the proportion of Germans and percentage of population with a disability over the age of 75 in the United States with a correlation coefficient (R) of 0.150 and weighted average of 46.3%, a difference of 3.9%.
Disability Age Over 75 Correlation Summary
| Measurement | Spaniard | German |
| Minimum | 3.6% | 23.2% |
| Maximum | 100.0% | 92.0% |
| Range | 96.4% | 68.8% |
| Mean | 54.1% | 47.0% |
| Median | 50.0% | 45.2% |
| Interquartile 25% (IQ1) | 44.8% | 43.6% |
| Interquartile 75% (IQ3) | 64.0% | 47.8% |
| Interquartile Range (IQR) | 19.1% | 4.1% |
| Standard Deviation (Sample) | 22.3% | 8.9% |
| Standard Deviation (Population) | 22.1% | 8.9% |
Similar Demographics by Disability Age Over 75
Demographics Similar to Spaniards by Disability Age Over 75
In terms of disability age over 75, the demographic groups most similar to Spaniards are Immigrants from Liberia (48.1%, a difference of 0.020%), Nonimmigrants (48.0%, a difference of 0.070%), Zimbabwean (48.1%, a difference of 0.070%), Spanish (48.0%, a difference of 0.080%), and Liberian (48.0%, a difference of 0.090%).
| Demographics | Rating | Rank | Disability Age Over 75 |
| Barbadians | 6.8 /100 | #222 | Tragic 48.0% |
| Immigrants | Bangladesh | 6.8 /100 | #223 | Tragic 48.0% |
| Liberians | 6.7 /100 | #224 | Tragic 48.0% |
| Spanish | 6.5 /100 | #225 | Tragic 48.0% |
| Immigrants | Nonimmigrants | 6.5 /100 | #226 | Tragic 48.0% |
| Zimbabweans | 6.4 /100 | #227 | Tragic 48.1% |
| Immigrants | Liberia | 5.9 /100 | #228 | Tragic 48.1% |
| Spaniards | 5.7 /100 | #229 | Tragic 48.1% |
| Taiwanese | 4.4 /100 | #230 | Tragic 48.2% |
| Immigrants | Immigrants | 4.3 /100 | #231 | Tragic 48.2% |
| Indonesians | 4.2 /100 | #232 | Tragic 48.2% |
| Cree | 4.2 /100 | #233 | Tragic 48.2% |
| Sub-Saharan Africans | 3.8 /100 | #234 | Tragic 48.2% |
| Hmong | 3.8 /100 | #235 | Tragic 48.2% |
| Immigrants | Nicaragua | 3.2 /100 | #236 | Tragic 48.2% |
Demographics Similar to Germans by Disability Age Over 75
In terms of disability age over 75, the demographic groups most similar to Germans are Ugandan (46.3%, a difference of 0.0%), Albanian (46.3%, a difference of 0.040%), Northern European (46.3%, a difference of 0.050%), Immigrants from Egypt (46.3%, a difference of 0.050%), and Immigrants from Brazil (46.3%, a difference of 0.060%).
| Demographics | Rating | Rank | Disability Age Over 75 |
| Immigrants | Southern Europe | 98.6 /100 | #85 | Exceptional 46.2% |
| Romanians | 98.6 /100 | #86 | Exceptional 46.2% |
| Danes | 98.6 /100 | #87 | Exceptional 46.2% |
| Uruguayans | 98.4 /100 | #88 | Exceptional 46.2% |
| Immigrants | Saudi Arabia | 98.4 /100 | #89 | Exceptional 46.3% |
| Northern Europeans | 98.3 /100 | #90 | Exceptional 46.3% |
| Immigrants | Egypt | 98.3 /100 | #91 | Exceptional 46.3% |
| Germans | 98.2 /100 | #92 | Exceptional 46.3% |
| Ugandans | 98.2 /100 | #93 | Exceptional 46.3% |
| Albanians | 98.1 /100 | #94 | Exceptional 46.3% |
| Immigrants | Brazil | 98.0 /100 | #95 | Exceptional 46.3% |
| Immigrants | China | 98.0 /100 | #96 | Exceptional 46.3% |
| Finns | 97.9 /100 | #97 | Exceptional 46.3% |
| Immigrants | Japan | 97.8 /100 | #98 | Exceptional 46.3% |
| Palestinians | 97.7 /100 | #99 | Exceptional 46.3% |