Immigrants from Israel vs German Disability Age Over 75
COMPARE
Immigrants from Israel
German
Disability Age Over 75
Disability Age Over 75 Comparison
Immigrants from Israel
Germans
45.9%
DISABILITY AGE OVER 75
99.6/ 100
METRIC RATING
58th/ 347
METRIC RANK
46.3%
DISABILITY AGE OVER 75
98.2/ 100
METRIC RATING
92nd/ 347
METRIC RANK
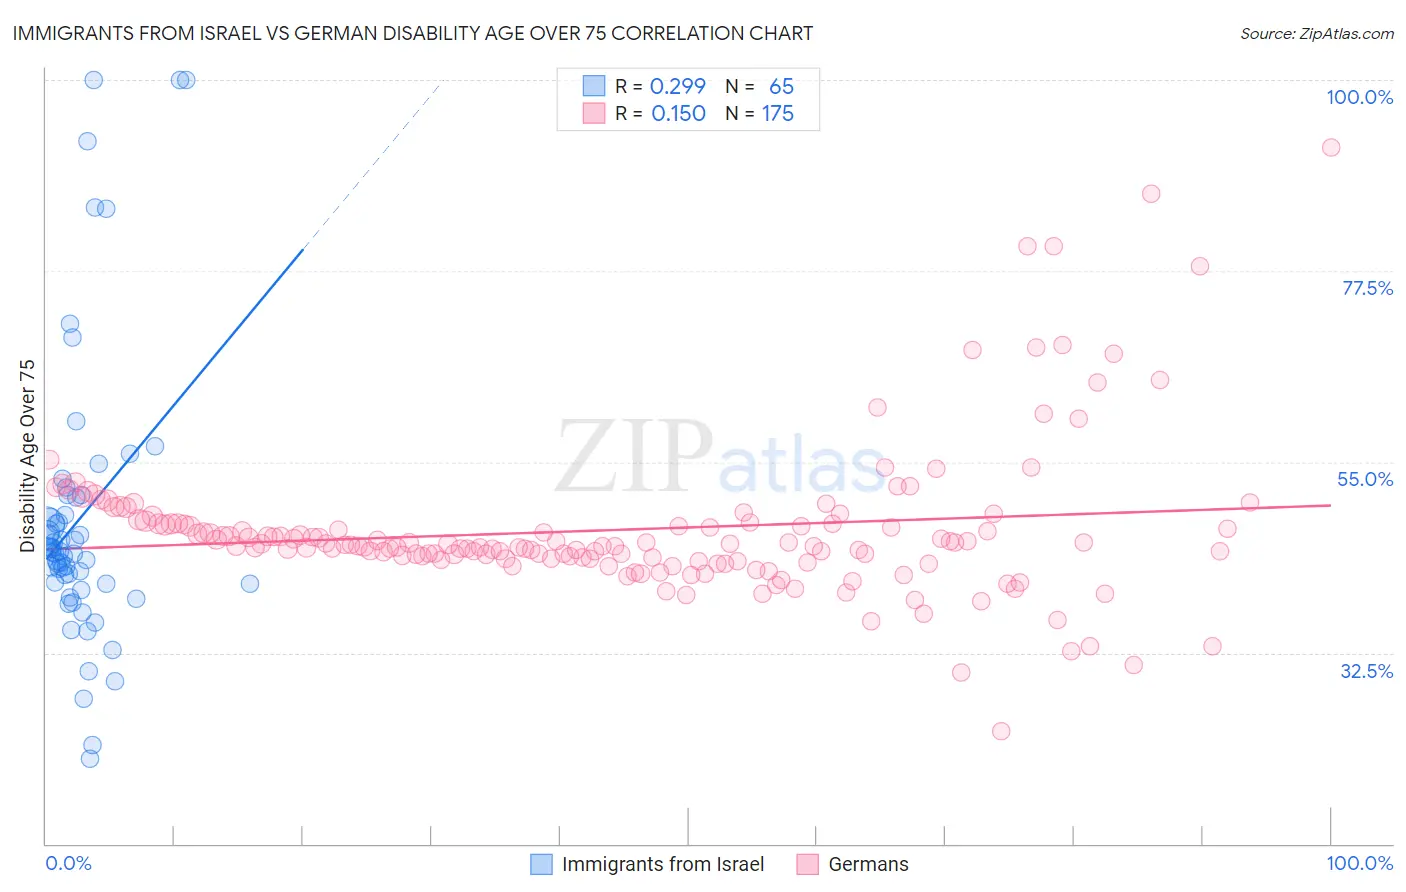
Immigrants from Israel vs German Disability Age Over 75 Correlation Chart
The statistical analysis conducted on geographies consisting of 209,886,024 people shows a weak positive correlation between the proportion of Immigrants from Israel and percentage of population with a disability over the age of 75 in the United States with a correlation coefficient (R) of 0.299 and weighted average of 45.9%. Similarly, the statistical analysis conducted on geographies consisting of 578,361,531 people shows a poor positive correlation between the proportion of Germans and percentage of population with a disability over the age of 75 in the United States with a correlation coefficient (R) of 0.150 and weighted average of 46.3%, a difference of 0.87%.
Disability Age Over 75 Correlation Summary
| Measurement | Immigrants from Israel | German |
| Minimum | 20.0% | 23.2% |
| Maximum | 100.0% | 92.0% |
| Range | 80.0% | 68.8% |
| Mean | 48.5% | 47.0% |
| Median | 44.4% | 45.2% |
| Interquartile 25% (IQ1) | 40.6% | 43.6% |
| Interquartile 75% (IQ3) | 50.9% | 47.8% |
| Interquartile Range (IQR) | 10.3% | 4.1% |
| Standard Deviation (Sample) | 17.1% | 8.9% |
| Standard Deviation (Population) | 16.9% | 8.9% |
Similar Demographics by Disability Age Over 75
Demographics Similar to Immigrants from Israel by Disability Age Over 75
In terms of disability age over 75, the demographic groups most similar to Immigrants from Israel are Immigrants from Turkey (45.9%, a difference of 0.0%), Iranian (45.9%, a difference of 0.010%), Immigrants from Europe (45.9%, a difference of 0.010%), Immigrants from Netherlands (45.9%, a difference of 0.020%), and Immigrants from Argentina (45.9%, a difference of 0.030%).
| Demographics | Rating | Rank | Disability Age Over 75 |
| Immigrants | Korea | 99.7 /100 | #51 | Exceptional 45.8% |
| Immigrants | France | 99.7 /100 | #52 | Exceptional 45.8% |
| Immigrants | Italy | 99.7 /100 | #53 | Exceptional 45.8% |
| Slovaks | 99.6 /100 | #54 | Exceptional 45.8% |
| Maltese | 99.6 /100 | #55 | Exceptional 45.8% |
| Immigrants | Netherlands | 99.6 /100 | #56 | Exceptional 45.9% |
| Immigrants | Turkey | 99.6 /100 | #57 | Exceptional 45.9% |
| Immigrants | Israel | 99.6 /100 | #58 | Exceptional 45.9% |
| Iranians | 99.6 /100 | #59 | Exceptional 45.9% |
| Immigrants | Europe | 99.6 /100 | #60 | Exceptional 45.9% |
| Immigrants | Argentina | 99.6 /100 | #61 | Exceptional 45.9% |
| Burmese | 99.5 /100 | #62 | Exceptional 45.9% |
| Immigrants | Norway | 99.5 /100 | #63 | Exceptional 45.9% |
| Immigrants | North Macedonia | 99.5 /100 | #64 | Exceptional 45.9% |
| Austrians | 99.5 /100 | #65 | Exceptional 46.0% |
Demographics Similar to Germans by Disability Age Over 75
In terms of disability age over 75, the demographic groups most similar to Germans are Ugandan (46.3%, a difference of 0.0%), Albanian (46.3%, a difference of 0.040%), Northern European (46.3%, a difference of 0.050%), Immigrants from Egypt (46.3%, a difference of 0.050%), and Immigrants from Brazil (46.3%, a difference of 0.060%).
| Demographics | Rating | Rank | Disability Age Over 75 |
| Immigrants | Southern Europe | 98.6 /100 | #85 | Exceptional 46.2% |
| Romanians | 98.6 /100 | #86 | Exceptional 46.2% |
| Danes | 98.6 /100 | #87 | Exceptional 46.2% |
| Uruguayans | 98.4 /100 | #88 | Exceptional 46.2% |
| Immigrants | Saudi Arabia | 98.4 /100 | #89 | Exceptional 46.3% |
| Northern Europeans | 98.3 /100 | #90 | Exceptional 46.3% |
| Immigrants | Egypt | 98.3 /100 | #91 | Exceptional 46.3% |
| Germans | 98.2 /100 | #92 | Exceptional 46.3% |
| Ugandans | 98.2 /100 | #93 | Exceptional 46.3% |
| Albanians | 98.1 /100 | #94 | Exceptional 46.3% |
| Immigrants | Brazil | 98.0 /100 | #95 | Exceptional 46.3% |
| Immigrants | China | 98.0 /100 | #96 | Exceptional 46.3% |
| Finns | 97.9 /100 | #97 | Exceptional 46.3% |
| Immigrants | Japan | 97.8 /100 | #98 | Exceptional 46.3% |
| Palestinians | 97.7 /100 | #99 | Exceptional 46.3% |