Scotch-Irish vs German Unemployment Among Ages 45 to 54 years
COMPARE
Scotch-Irish
German
Unemployment Among Ages 45 to 54 years
Unemployment Among Ages 45 to 54 years Comparison
Scotch-Irish
Germans
4.2%
UNEMPLOYMENT AMONG AGES 45 TO 54 YEARS
99.8/ 100
METRIC RATING
38th/ 347
METRIC RANK
4.1%
UNEMPLOYMENT AMONG AGES 45 TO 54 YEARS
100.0/ 100
METRIC RATING
18th/ 347
METRIC RANK
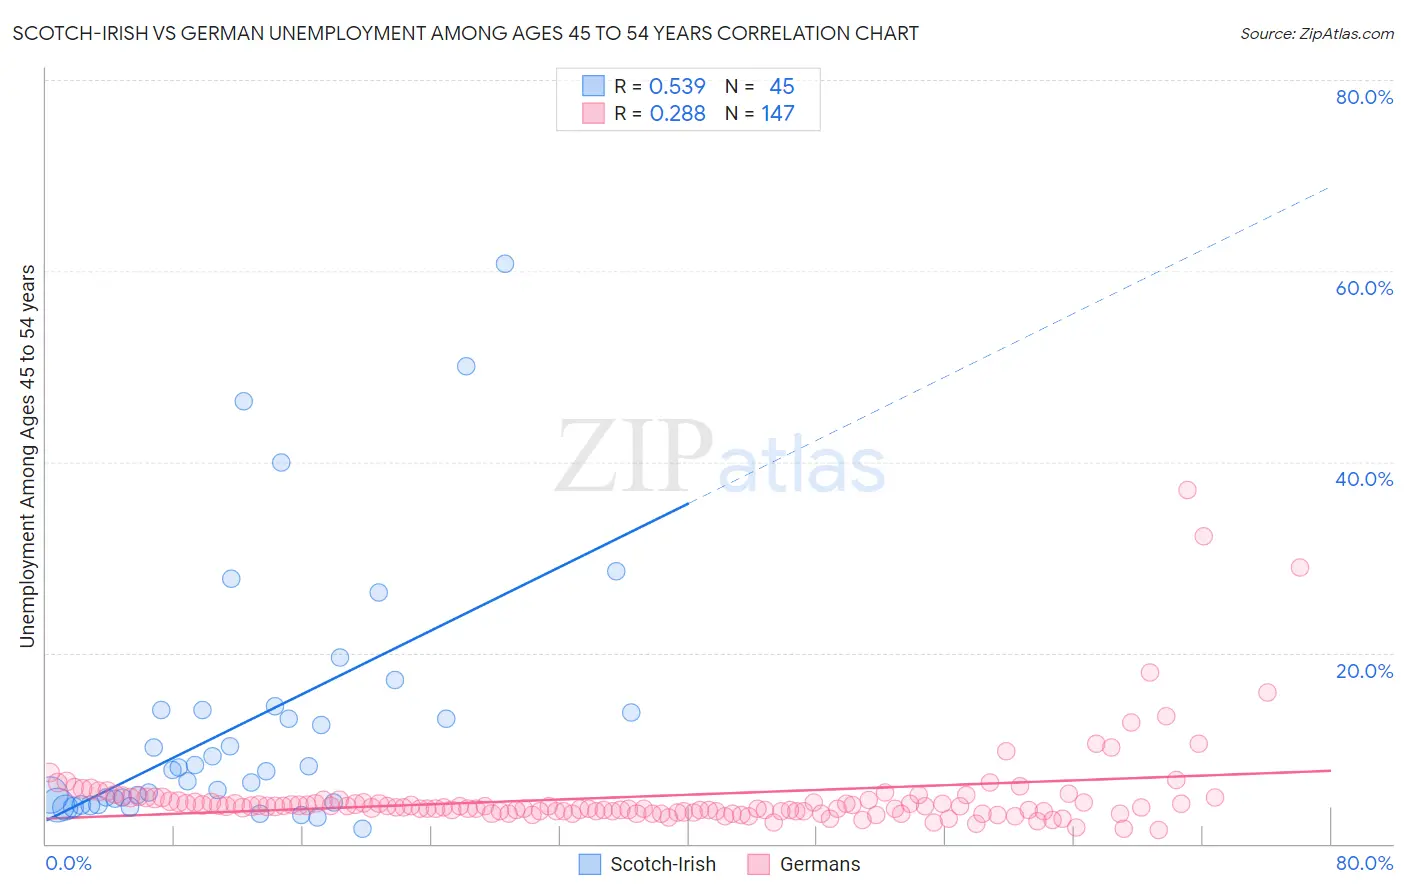
Scotch-Irish vs German Unemployment Among Ages 45 to 54 years Correlation Chart
The statistical analysis conducted on geographies consisting of 510,401,780 people shows a substantial positive correlation between the proportion of Scotch-Irish and unemployment rate among population between the ages 45 and 54 in the United States with a correlation coefficient (R) of 0.539 and weighted average of 4.2%. Similarly, the statistical analysis conducted on geographies consisting of 533,496,511 people shows a weak positive correlation between the proportion of Germans and unemployment rate among population between the ages 45 and 54 in the United States with a correlation coefficient (R) of 0.288 and weighted average of 4.1%, a difference of 3.3%.
Unemployment Among Ages 45 to 54 years Correlation Summary
| Measurement | Scotch-Irish | German |
| Minimum | 1.6% | 1.4% |
| Maximum | 60.7% | 37.0% |
| Range | 59.1% | 35.6% |
| Mean | 12.7% | 4.9% |
| Median | 7.8% | 3.9% |
| Interquartile 25% (IQ1) | 4.2% | 3.4% |
| Interquartile 75% (IQ3) | 14.0% | 4.6% |
| Interquartile Range (IQR) | 9.8% | 1.2% |
| Standard Deviation (Sample) | 13.4% | 4.7% |
| Standard Deviation (Population) | 13.3% | 4.6% |
Demographics Similar to Scotch-Irish and Germans by Unemployment Among Ages 45 to 54 years
In terms of unemployment among ages 45 to 54 years, the demographic groups most similar to Scotch-Irish are Osage (4.2%, a difference of 0.010%), Croatian (4.2%, a difference of 0.030%), Immigrants from Taiwan (4.2%, a difference of 0.040%), Dutch (4.2%, a difference of 0.23%), and Immigrants from South Central Asia (4.2%, a difference of 0.73%). Similarly, the demographic groups most similar to Germans are Swiss (4.1%, a difference of 0.29%), English (4.1%, a difference of 0.45%), European (4.1%, a difference of 0.78%), Yugoslavian (4.1%, a difference of 0.87%), and Bulgarian (4.1%, a difference of 0.88%).
| Demographics | Rating | Rank | Unemployment Among Ages 45 to 54 years |
| Germans | 100.0 /100 | #18 | Exceptional 4.1% |
| Swiss | 100.0 /100 | #19 | Exceptional 4.1% |
| English | 100.0 /100 | #20 | Exceptional 4.1% |
| Europeans | 100.0 /100 | #21 | Exceptional 4.1% |
| Yugoslavians | 100.0 /100 | #22 | Exceptional 4.1% |
| Bulgarians | 100.0 /100 | #23 | Exceptional 4.1% |
| Carpatho Rusyns | 100.0 /100 | #24 | Exceptional 4.1% |
| Bolivians | 99.9 /100 | #25 | Exceptional 4.1% |
| Scottish | 99.9 /100 | #26 | Exceptional 4.1% |
| Immigrants | Moldova | 99.9 /100 | #27 | Exceptional 4.1% |
| Welsh | 99.9 /100 | #28 | Exceptional 4.1% |
| Belgians | 99.9 /100 | #29 | Exceptional 4.1% |
| British | 99.9 /100 | #30 | Exceptional 4.1% |
| Bhutanese | 99.9 /100 | #31 | Exceptional 4.2% |
| Slovenes | 99.9 /100 | #32 | Exceptional 4.2% |
| Immigrants | South Central Asia | 99.9 /100 | #33 | Exceptional 4.2% |
| Dutch | 99.9 /100 | #34 | Exceptional 4.2% |
| Immigrants | Taiwan | 99.8 /100 | #35 | Exceptional 4.2% |
| Croatians | 99.8 /100 | #36 | Exceptional 4.2% |
| Osage | 99.8 /100 | #37 | Exceptional 4.2% |
| Scotch-Irish | 99.8 /100 | #38 | Exceptional 4.2% |