Brazilian vs German Disability Age Over 75
COMPARE
Brazilian
German
Disability Age Over 75
Disability Age Over 75 Comparison
Brazilians
Germans
46.5%
DISABILITY AGE OVER 75
96.6/ 100
METRIC RATING
108th/ 347
METRIC RANK
46.3%
DISABILITY AGE OVER 75
98.2/ 100
METRIC RATING
92nd/ 347
METRIC RANK
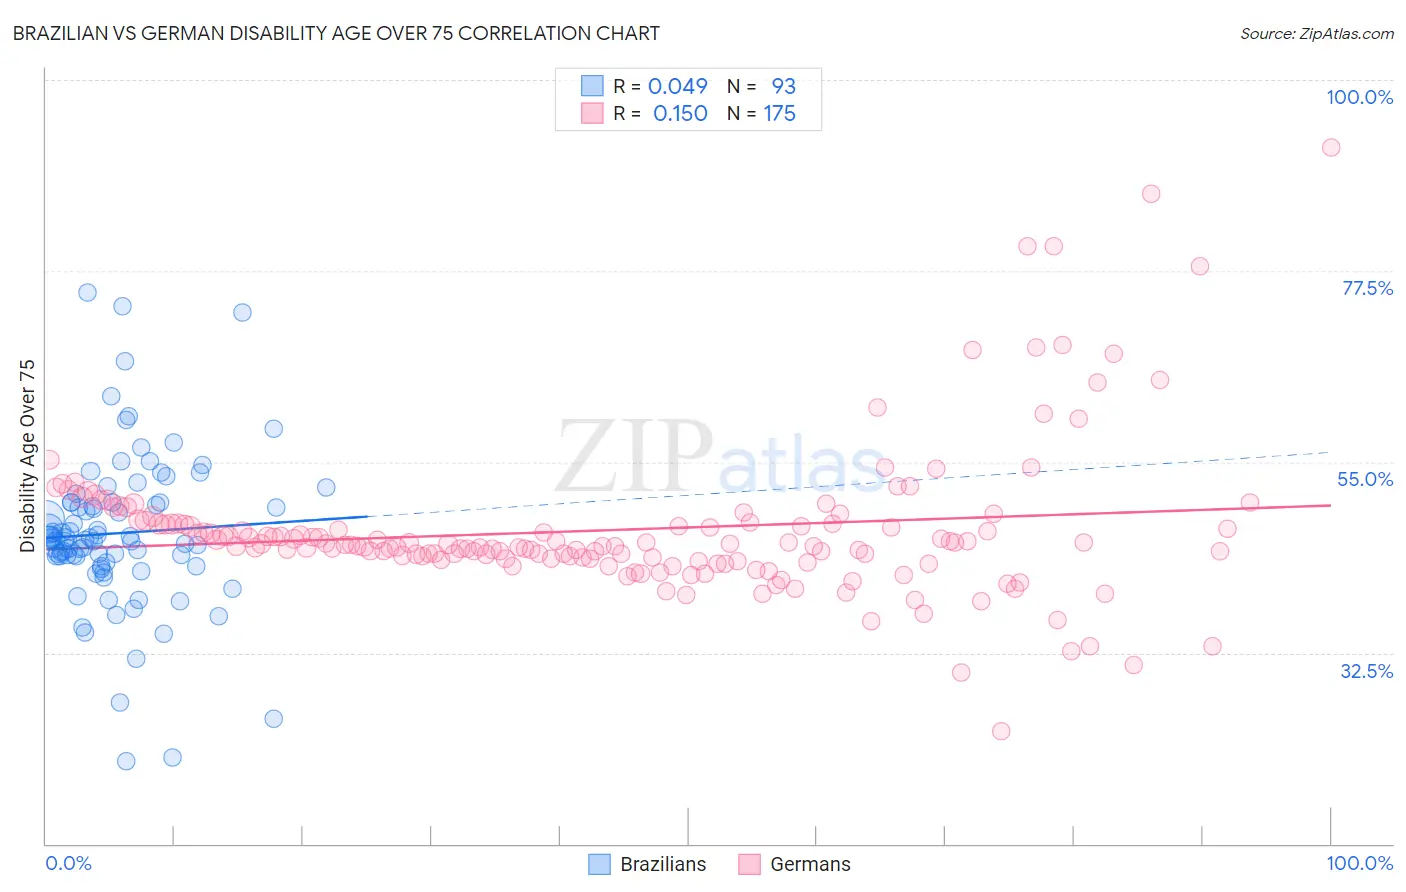
Brazilian vs German Disability Age Over 75 Correlation Chart
The statistical analysis conducted on geographies consisting of 323,321,526 people shows no correlation between the proportion of Brazilians and percentage of population with a disability over the age of 75 in the United States with a correlation coefficient (R) of 0.049 and weighted average of 46.5%. Similarly, the statistical analysis conducted on geographies consisting of 578,361,531 people shows a poor positive correlation between the proportion of Germans and percentage of population with a disability over the age of 75 in the United States with a correlation coefficient (R) of 0.150 and weighted average of 46.3%, a difference of 0.37%.
Disability Age Over 75 Correlation Summary
| Measurement | Brazilian | German |
| Minimum | 19.7% | 23.2% |
| Maximum | 75.0% | 92.0% |
| Range | 55.3% | 68.8% |
| Mean | 46.6% | 47.0% |
| Median | 45.8% | 45.2% |
| Interquartile 25% (IQ1) | 42.9% | 43.6% |
| Interquartile 75% (IQ3) | 50.2% | 47.8% |
| Interquartile Range (IQR) | 7.3% | 4.1% |
| Standard Deviation (Sample) | 9.3% | 8.9% |
| Standard Deviation (Population) | 9.3% | 8.9% |
Demographics Similar to Brazilians and Germans by Disability Age Over 75
In terms of disability age over 75, the demographic groups most similar to Brazilians are Immigrants from Uruguay (46.4%, a difference of 0.010%), Chilean (46.5%, a difference of 0.030%), Immigrants from Kuwait (46.4%, a difference of 0.040%), Immigrants from Hong Kong (46.5%, a difference of 0.040%), and Immigrants from Cameroon (46.4%, a difference of 0.060%). Similarly, the demographic groups most similar to Germans are Ugandan (46.3%, a difference of 0.0%), Albanian (46.3%, a difference of 0.040%), Northern European (46.3%, a difference of 0.050%), Immigrants from Egypt (46.3%, a difference of 0.050%), and Immigrants from Brazil (46.3%, a difference of 0.060%).
| Demographics | Rating | Rank | Disability Age Over 75 |
| Northern Europeans | 98.3 /100 | #90 | Exceptional 46.3% |
| Immigrants | Egypt | 98.3 /100 | #91 | Exceptional 46.3% |
| Germans | 98.2 /100 | #92 | Exceptional 46.3% |
| Ugandans | 98.2 /100 | #93 | Exceptional 46.3% |
| Albanians | 98.1 /100 | #94 | Exceptional 46.3% |
| Immigrants | Brazil | 98.0 /100 | #95 | Exceptional 46.3% |
| Immigrants | China | 98.0 /100 | #96 | Exceptional 46.3% |
| Finns | 97.9 /100 | #97 | Exceptional 46.3% |
| Immigrants | Japan | 97.8 /100 | #98 | Exceptional 46.3% |
| Palestinians | 97.7 /100 | #99 | Exceptional 46.3% |
| Immigrants | Eastern Europe | 97.7 /100 | #100 | Exceptional 46.3% |
| Mongolians | 97.7 /100 | #101 | Exceptional 46.3% |
| Immigrants | Malaysia | 97.1 /100 | #102 | Exceptional 46.4% |
| Ukrainians | 97.1 /100 | #103 | Exceptional 46.4% |
| Israelis | 97.0 /100 | #104 | Exceptional 46.4% |
| Immigrants | Cameroon | 96.9 /100 | #105 | Exceptional 46.4% |
| Immigrants | Kuwait | 96.8 /100 | #106 | Exceptional 46.4% |
| Immigrants | Uruguay | 96.7 /100 | #107 | Exceptional 46.4% |
| Brazilians | 96.6 /100 | #108 | Exceptional 46.5% |
| Chileans | 96.4 /100 | #109 | Exceptional 46.5% |
| Immigrants | Hong Kong | 96.4 /100 | #110 | Exceptional 46.5% |