Ottawa vs Creek Ambulatory Disability
COMPARE
Ottawa
Creek
Ambulatory Disability
Ambulatory Disability Comparison
Ottawa
Creek
7.2%
AMBULATORY DISABILITY
0.0/ 100
METRIC RATING
318th/ 347
METRIC RANK
8.5%
AMBULATORY DISABILITY
0.0/ 100
METRIC RATING
341st/ 347
METRIC RANK
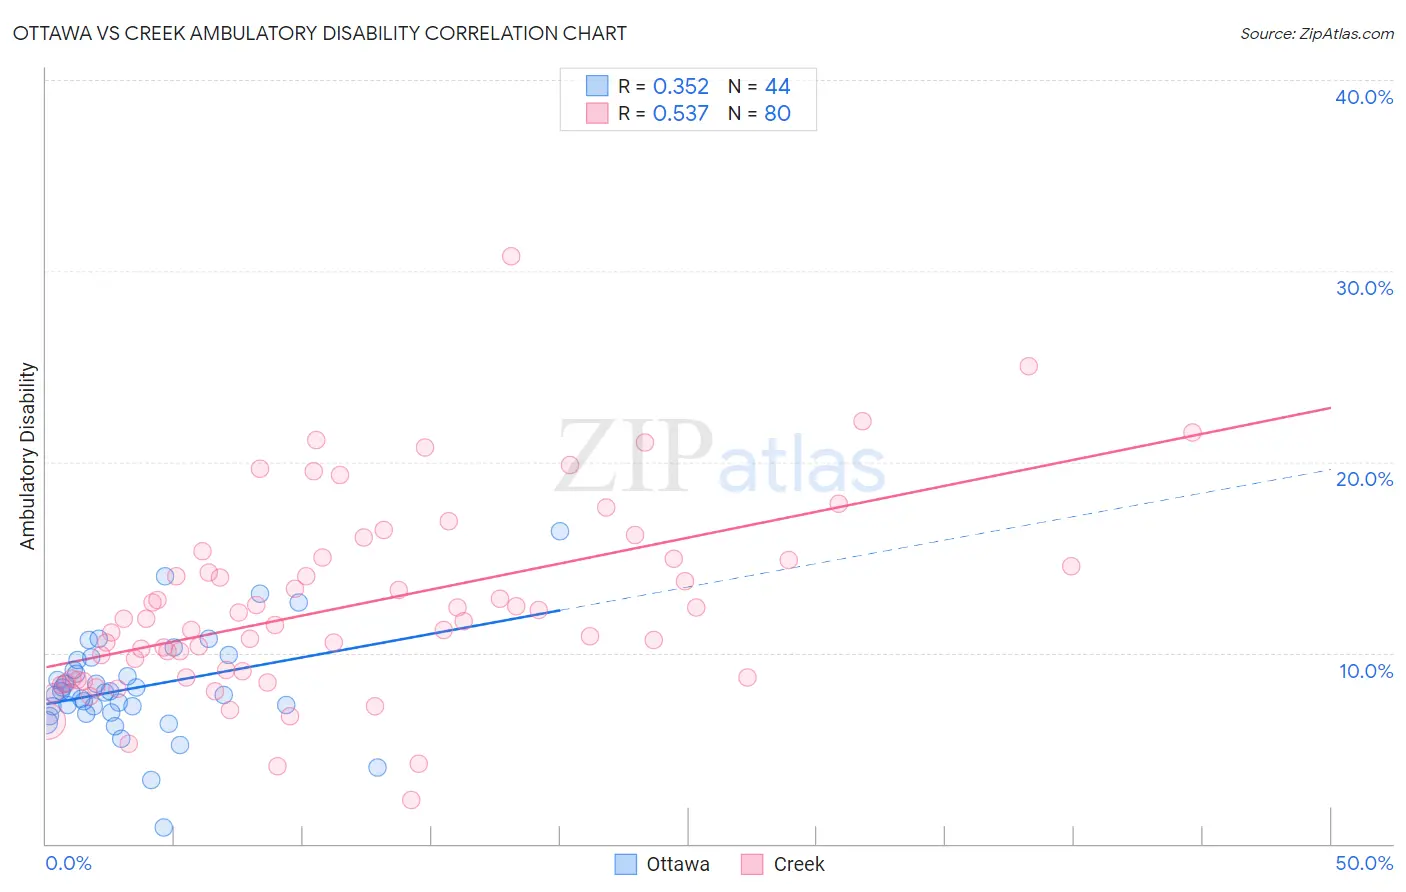
Ottawa vs Creek Ambulatory Disability Correlation Chart
The statistical analysis conducted on geographies consisting of 49,954,761 people shows a mild positive correlation between the proportion of Ottawa and percentage of population with ambulatory disability in the United States with a correlation coefficient (R) of 0.352 and weighted average of 7.2%. Similarly, the statistical analysis conducted on geographies consisting of 178,444,493 people shows a substantial positive correlation between the proportion of Creek and percentage of population with ambulatory disability in the United States with a correlation coefficient (R) of 0.537 and weighted average of 8.5%, a difference of 18.0%.
Ambulatory Disability Correlation Summary
| Measurement | Ottawa | Creek |
| Minimum | 0.87% | 2.3% |
| Maximum | 16.4% | 30.8% |
| Range | 15.5% | 28.5% |
| Mean | 8.2% | 12.5% |
| Median | 7.9% | 11.7% |
| Interquartile 25% (IQ1) | 7.0% | 8.7% |
| Interquartile 75% (IQ3) | 9.4% | 14.9% |
| Interquartile Range (IQR) | 2.3% | 6.2% |
| Standard Deviation (Sample) | 2.7% | 5.0% |
| Standard Deviation (Population) | 2.7% | 5.0% |
Similar Demographics by Ambulatory Disability
Demographics Similar to Ottawa by Ambulatory Disability
In terms of ambulatory disability, the demographic groups most similar to Ottawa are Central American Indian (7.2%, a difference of 0.090%), Immigrants from Dominican Republic (7.1%, a difference of 0.17%), Dominican (7.2%, a difference of 0.33%), Shoshone (7.1%, a difference of 0.41%), and Blackfeet (7.1%, a difference of 0.43%).
| Demographics | Rating | Rank | Ambulatory Disability |
| Cree | 0.0 /100 | #311 | Tragic 7.1% |
| Delaware | 0.0 /100 | #312 | Tragic 7.1% |
| Immigrants | Yemen | 0.0 /100 | #313 | Tragic 7.1% |
| Blackfeet | 0.0 /100 | #314 | Tragic 7.1% |
| Shoshone | 0.0 /100 | #315 | Tragic 7.1% |
| Immigrants | Dominican Republic | 0.0 /100 | #316 | Tragic 7.1% |
| Central American Indians | 0.0 /100 | #317 | Tragic 7.2% |
| Ottawa | 0.0 /100 | #318 | Tragic 7.2% |
| Dominicans | 0.0 /100 | #319 | Tragic 7.2% |
| Potawatomi | 0.0 /100 | #320 | Tragic 7.3% |
| Apache | 0.0 /100 | #321 | Tragic 7.4% |
| Osage | 0.0 /100 | #322 | Tragic 7.4% |
| Americans | 0.0 /100 | #323 | Tragic 7.4% |
| Navajo | 0.0 /100 | #324 | Tragic 7.5% |
| Comanche | 0.0 /100 | #325 | Tragic 7.5% |
Demographics Similar to Creek by Ambulatory Disability
In terms of ambulatory disability, the demographic groups most similar to Creek are Choctaw (8.3%, a difference of 1.6%), Kiowa (8.6%, a difference of 1.9%), Pima (8.2%, a difference of 2.5%), Colville (8.2%, a difference of 2.8%), and Tohono O'odham (8.7%, a difference of 3.4%).
| Demographics | Rating | Rank | Ambulatory Disability |
| Cherokee | 0.0 /100 | #333 | Tragic 7.9% |
| Yuman | 0.0 /100 | #334 | Tragic 7.9% |
| Chickasaw | 0.0 /100 | #335 | Tragic 8.0% |
| Seminole | 0.0 /100 | #336 | Tragic 8.0% |
| Dutch West Indians | 0.0 /100 | #337 | Tragic 8.2% |
| Colville | 0.0 /100 | #338 | Tragic 8.2% |
| Pima | 0.0 /100 | #339 | Tragic 8.2% |
| Choctaw | 0.0 /100 | #340 | Tragic 8.3% |
| Creek | 0.0 /100 | #341 | Tragic 8.5% |
| Kiowa | 0.0 /100 | #342 | Tragic 8.6% |
| Tohono O'odham | 0.0 /100 | #343 | Tragic 8.7% |
| Tsimshian | 0.0 /100 | #344 | Tragic 8.8% |
| Puerto Ricans | 0.0 /100 | #345 | Tragic 8.9% |
| Houma | 0.0 /100 | #346 | Tragic 9.3% |
| Lumbee | 0.0 /100 | #347 | Tragic 9.5% |