Ottawa vs New Zealander Ambulatory Disability
COMPARE
Ottawa
New Zealander
Ambulatory Disability
Ambulatory Disability Comparison
Ottawa
New Zealanders
7.2%
AMBULATORY DISABILITY
0.0/ 100
METRIC RATING
318th/ 347
METRIC RANK
5.8%
AMBULATORY DISABILITY
97.6/ 100
METRIC RATING
104th/ 347
METRIC RANK
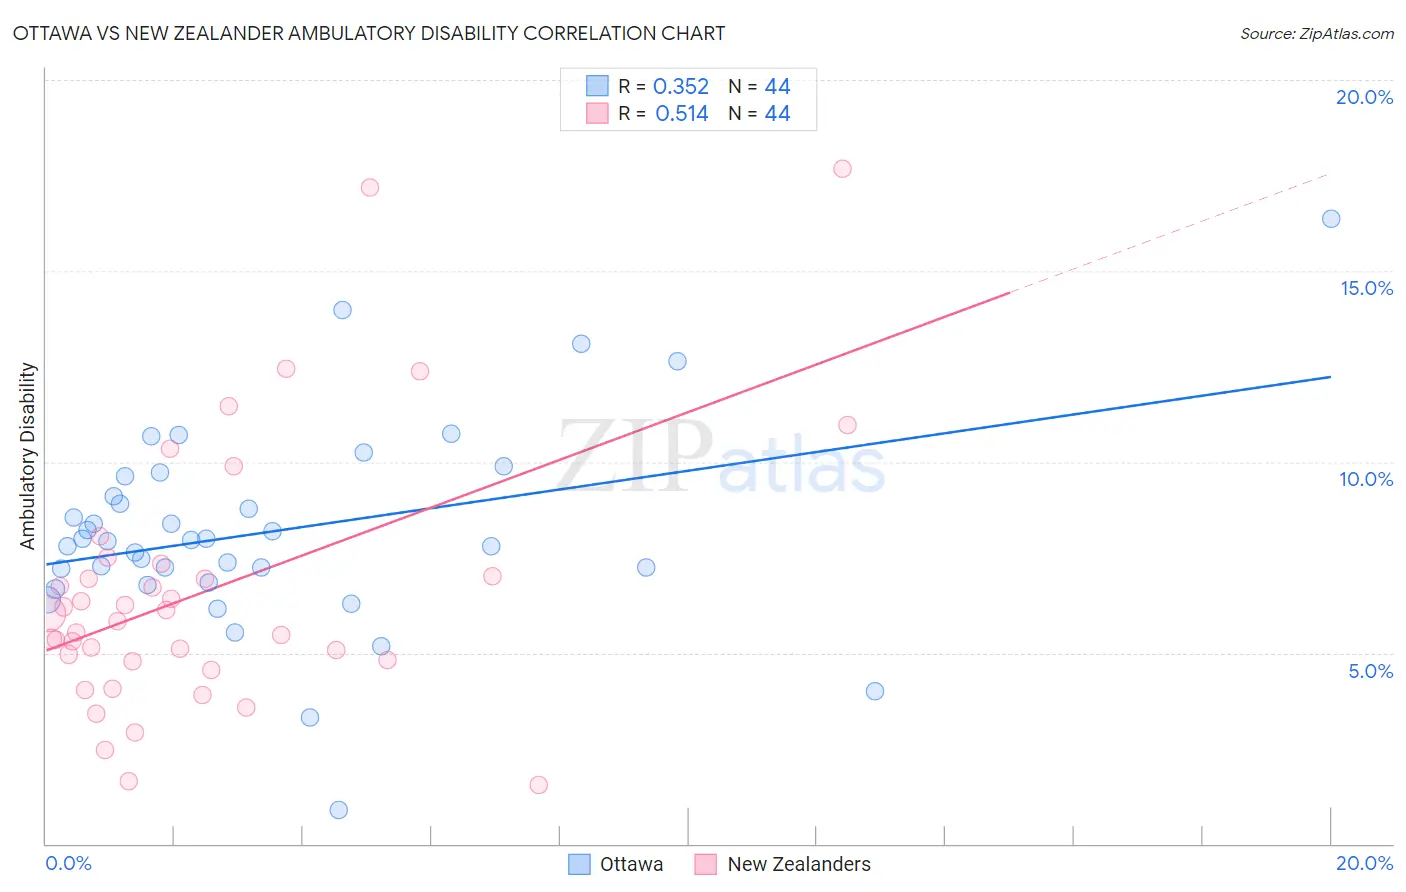
Ottawa vs New Zealander Ambulatory Disability Correlation Chart
The statistical analysis conducted on geographies consisting of 49,954,761 people shows a mild positive correlation between the proportion of Ottawa and percentage of population with ambulatory disability in the United States with a correlation coefficient (R) of 0.352 and weighted average of 7.2%. Similarly, the statistical analysis conducted on geographies consisting of 106,904,660 people shows a substantial positive correlation between the proportion of New Zealanders and percentage of population with ambulatory disability in the United States with a correlation coefficient (R) of 0.514 and weighted average of 5.8%, a difference of 23.1%.
Ambulatory Disability Correlation Summary
| Measurement | Ottawa | New Zealander |
| Minimum | 0.87% | 1.5% |
| Maximum | 16.4% | 17.7% |
| Range | 15.5% | 16.2% |
| Mean | 8.2% | 6.6% |
| Median | 7.9% | 5.9% |
| Interquartile 25% (IQ1) | 7.0% | 4.8% |
| Interquartile 75% (IQ3) | 9.4% | 7.2% |
| Interquartile Range (IQR) | 2.3% | 2.4% |
| Standard Deviation (Sample) | 2.7% | 3.5% |
| Standard Deviation (Population) | 2.7% | 3.4% |
Similar Demographics by Ambulatory Disability
Demographics Similar to Ottawa by Ambulatory Disability
In terms of ambulatory disability, the demographic groups most similar to Ottawa are Central American Indian (7.2%, a difference of 0.090%), Immigrants from Dominican Republic (7.1%, a difference of 0.17%), Dominican (7.2%, a difference of 0.33%), Shoshone (7.1%, a difference of 0.41%), and Blackfeet (7.1%, a difference of 0.43%).
| Demographics | Rating | Rank | Ambulatory Disability |
| Cree | 0.0 /100 | #311 | Tragic 7.1% |
| Delaware | 0.0 /100 | #312 | Tragic 7.1% |
| Immigrants | Yemen | 0.0 /100 | #313 | Tragic 7.1% |
| Blackfeet | 0.0 /100 | #314 | Tragic 7.1% |
| Shoshone | 0.0 /100 | #315 | Tragic 7.1% |
| Immigrants | Dominican Republic | 0.0 /100 | #316 | Tragic 7.1% |
| Central American Indians | 0.0 /100 | #317 | Tragic 7.2% |
| Ottawa | 0.0 /100 | #318 | Tragic 7.2% |
| Dominicans | 0.0 /100 | #319 | Tragic 7.2% |
| Potawatomi | 0.0 /100 | #320 | Tragic 7.3% |
| Apache | 0.0 /100 | #321 | Tragic 7.4% |
| Osage | 0.0 /100 | #322 | Tragic 7.4% |
| Americans | 0.0 /100 | #323 | Tragic 7.4% |
| Navajo | 0.0 /100 | #324 | Tragic 7.5% |
| Comanche | 0.0 /100 | #325 | Tragic 7.5% |
Demographics Similar to New Zealanders by Ambulatory Disability
In terms of ambulatory disability, the demographic groups most similar to New Zealanders are Immigrants from Romania (5.8%, a difference of 0.060%), Immigrants from Czechoslovakia (5.8%, a difference of 0.11%), Immigrants from Kenya (5.8%, a difference of 0.13%), Immigrants from Morocco (5.8%, a difference of 0.18%), and Immigrants from Serbia (5.8%, a difference of 0.21%).
| Demographics | Rating | Rank | Ambulatory Disability |
| Immigrants | Somalia | 98.3 /100 | #97 | Exceptional 5.8% |
| Immigrants | Lebanon | 98.3 /100 | #98 | Exceptional 5.8% |
| Immigrants | Northern Europe | 98.2 /100 | #99 | Exceptional 5.8% |
| Immigrants | Serbia | 97.9 /100 | #100 | Exceptional 5.8% |
| Immigrants | South America | 97.9 /100 | #101 | Exceptional 5.8% |
| Immigrants | Kenya | 97.8 /100 | #102 | Exceptional 5.8% |
| Immigrants | Romania | 97.7 /100 | #103 | Exceptional 5.8% |
| New Zealanders | 97.6 /100 | #104 | Exceptional 5.8% |
| Immigrants | Czechoslovakia | 97.4 /100 | #105 | Exceptional 5.8% |
| Immigrants | Morocco | 97.3 /100 | #106 | Exceptional 5.8% |
| Uruguayans | 97.2 /100 | #107 | Exceptional 5.8% |
| Colombians | 97.2 /100 | #108 | Exceptional 5.8% |
| Immigrants | Netherlands | 97.1 /100 | #109 | Exceptional 5.8% |
| Immigrants | Colombia | 96.7 /100 | #110 | Exceptional 5.8% |
| Danes | 96.6 /100 | #111 | Exceptional 5.8% |