Ottawa vs Creek Single Father Households
COMPARE
Ottawa
Creek
Single Father Households
Single Father Households Comparison
Ottawa
Creek
2.7%
SINGLE FATHER HOUSEHOLDS
0.1/ 100
METRIC RATING
285th/ 347
METRIC RANK
2.6%
SINGLE FATHER HOUSEHOLDS
0.2/ 100
METRIC RATING
271st/ 347
METRIC RANK
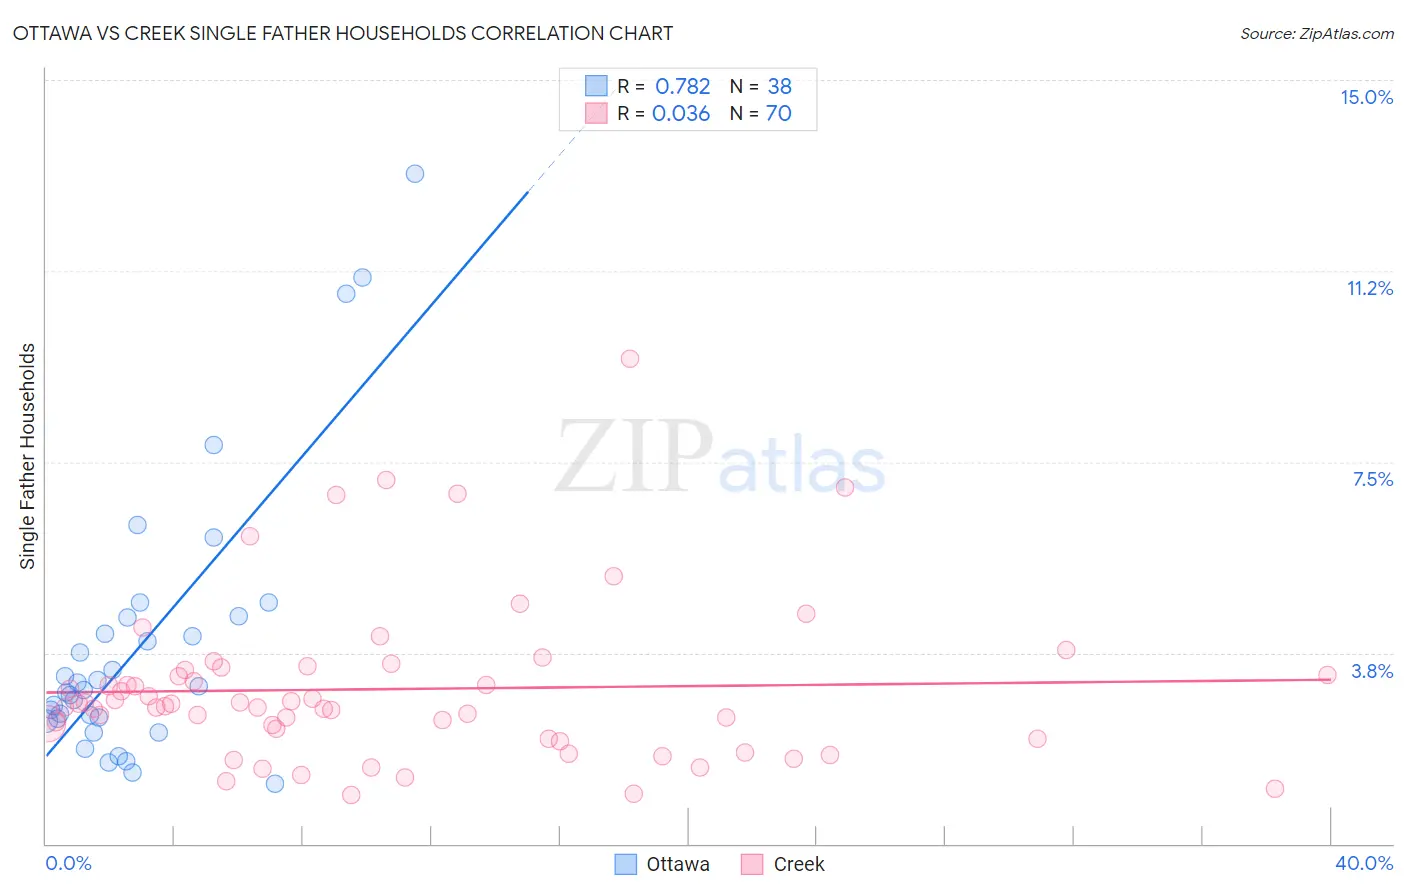
Ottawa vs Creek Single Father Households Correlation Chart
The statistical analysis conducted on geographies consisting of 49,872,808 people shows a strong positive correlation between the proportion of Ottawa and percentage of single father households in the United States with a correlation coefficient (R) of 0.782 and weighted average of 2.7%. Similarly, the statistical analysis conducted on geographies consisting of 177,693,364 people shows no correlation between the proportion of Creek and percentage of single father households in the United States with a correlation coefficient (R) of 0.036 and weighted average of 2.6%, a difference of 2.3%.
Single Father Households Correlation Summary
| Measurement | Ottawa | Creek |
| Minimum | 1.2% | 0.96% |
| Maximum | 13.2% | 9.5% |
| Range | 12.0% | 8.6% |
| Mean | 3.9% | 3.0% |
| Median | 3.1% | 2.7% |
| Interquartile 25% (IQ1) | 2.4% | 2.1% |
| Interquartile 75% (IQ3) | 4.4% | 3.4% |
| Interquartile Range (IQR) | 2.0% | 1.3% |
| Standard Deviation (Sample) | 2.7% | 1.6% |
| Standard Deviation (Population) | 2.7% | 1.6% |
Demographics Similar to Ottawa and Creek by Single Father Households
In terms of single father households, the demographic groups most similar to Ottawa are Immigrants from Cuba (2.7%, a difference of 0.010%), Hawaiian (2.7%, a difference of 0.090%), Immigrants from Nicaragua (2.7%, a difference of 0.14%), Central American Indian (2.7%, a difference of 0.16%), and Immigrants from Cambodia (2.7%, a difference of 0.41%). Similarly, the demographic groups most similar to Creek are Belizean (2.6%, a difference of 0.0%), Iroquois (2.6%, a difference of 0.050%), Puerto Rican (2.6%, a difference of 0.070%), Seminole (2.6%, a difference of 0.36%), and Cuban (2.6%, a difference of 0.50%).
| Demographics | Rating | Rank | Single Father Households |
| Haitians | 0.4 /100 | #268 | Tragic 2.6% |
| Cubans | 0.3 /100 | #269 | Tragic 2.6% |
| Seminole | 0.3 /100 | #270 | Tragic 2.6% |
| Creek | 0.2 /100 | #271 | Tragic 2.6% |
| Belizeans | 0.2 /100 | #272 | Tragic 2.6% |
| Iroquois | 0.2 /100 | #273 | Tragic 2.6% |
| Puerto Ricans | 0.2 /100 | #274 | Tragic 2.6% |
| Immigrants | Dominican Republic | 0.2 /100 | #275 | Tragic 2.6% |
| Immigrants | Haiti | 0.1 /100 | #276 | Tragic 2.6% |
| Shoshone | 0.1 /100 | #277 | Tragic 2.6% |
| Cherokee | 0.1 /100 | #278 | Tragic 2.6% |
| Samoans | 0.1 /100 | #279 | Tragic 2.6% |
| Immigrants | Portugal | 0.1 /100 | #280 | Tragic 2.6% |
| Nicaraguans | 0.1 /100 | #281 | Tragic 2.6% |
| Dutch West Indians | 0.1 /100 | #282 | Tragic 2.6% |
| Immigrants | Nicaragua | 0.1 /100 | #283 | Tragic 2.7% |
| Hawaiians | 0.1 /100 | #284 | Tragic 2.7% |
| Ottawa | 0.1 /100 | #285 | Tragic 2.7% |
| Immigrants | Cuba | 0.1 /100 | #286 | Tragic 2.7% |
| Central American Indians | 0.0 /100 | #287 | Tragic 2.7% |
| Immigrants | Cambodia | 0.0 /100 | #288 | Tragic 2.7% |