Immigrants from Bulgaria vs Creek Ambulatory Disability
COMPARE
Immigrants from Bulgaria
Creek
Ambulatory Disability
Ambulatory Disability Comparison
Immigrants from Bulgaria
Creek
5.6%
AMBULATORY DISABILITY
99.8/ 100
METRIC RATING
55th/ 347
METRIC RANK
8.5%
AMBULATORY DISABILITY
0.0/ 100
METRIC RATING
341st/ 347
METRIC RANK
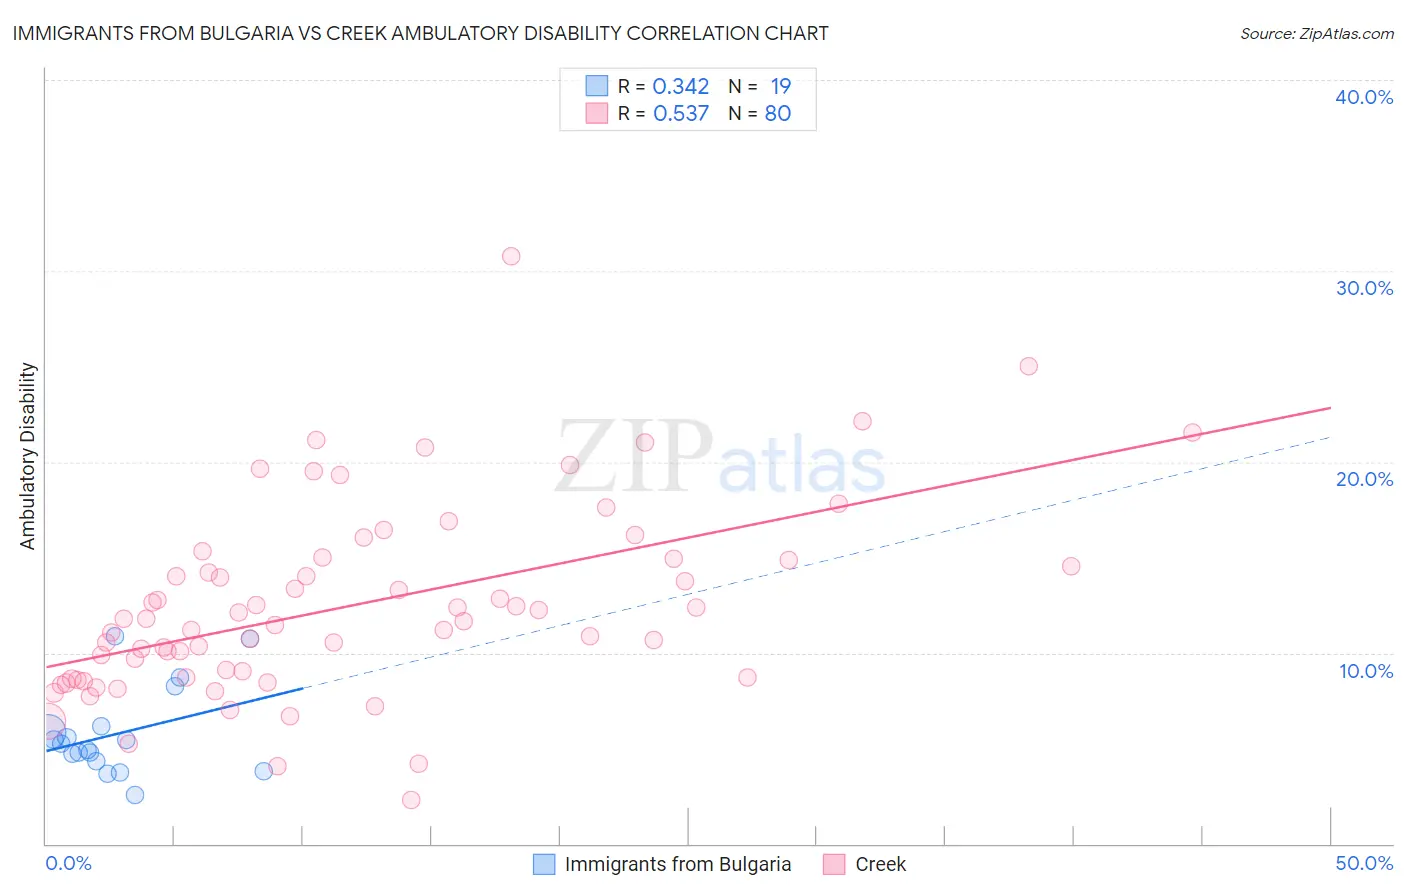
Immigrants from Bulgaria vs Creek Ambulatory Disability Correlation Chart
The statistical analysis conducted on geographies consisting of 172,546,961 people shows a mild positive correlation between the proportion of Immigrants from Bulgaria and percentage of population with ambulatory disability in the United States with a correlation coefficient (R) of 0.342 and weighted average of 5.6%. Similarly, the statistical analysis conducted on geographies consisting of 178,444,493 people shows a substantial positive correlation between the proportion of Creek and percentage of population with ambulatory disability in the United States with a correlation coefficient (R) of 0.537 and weighted average of 8.5%, a difference of 50.8%.
Ambulatory Disability Correlation Summary
| Measurement | Immigrants from Bulgaria | Creek |
| Minimum | 2.6% | 2.3% |
| Maximum | 10.9% | 30.8% |
| Range | 8.3% | 28.5% |
| Mean | 5.8% | 12.5% |
| Median | 5.2% | 11.7% |
| Interquartile 25% (IQ1) | 4.3% | 8.7% |
| Interquartile 75% (IQ3) | 6.1% | 14.9% |
| Interquartile Range (IQR) | 1.8% | 6.2% |
| Standard Deviation (Sample) | 2.3% | 5.0% |
| Standard Deviation (Population) | 2.2% | 5.0% |
Similar Demographics by Ambulatory Disability
Demographics Similar to Immigrants from Bulgaria by Ambulatory Disability
In terms of ambulatory disability, the demographic groups most similar to Immigrants from Bulgaria are Immigrants from Eastern Africa (5.6%, a difference of 0.070%), Inupiat (5.6%, a difference of 0.090%), Immigrants from Egypt (5.6%, a difference of 0.11%), Jordanian (5.6%, a difference of 0.12%), and Taiwanese (5.6%, a difference of 0.21%).
| Demographics | Rating | Rank | Ambulatory Disability |
| Immigrants | Argentina | 99.9 /100 | #48 | Exceptional 5.6% |
| Bulgarians | 99.9 /100 | #49 | Exceptional 5.6% |
| Luxembourgers | 99.9 /100 | #50 | Exceptional 5.6% |
| Taiwanese | 99.8 /100 | #51 | Exceptional 5.6% |
| Jordanians | 99.8 /100 | #52 | Exceptional 5.6% |
| Immigrants | Egypt | 99.8 /100 | #53 | Exceptional 5.6% |
| Immigrants | Eastern Africa | 99.8 /100 | #54 | Exceptional 5.6% |
| Immigrants | Bulgaria | 99.8 /100 | #55 | Exceptional 5.6% |
| Inupiat | 99.8 /100 | #56 | Exceptional 5.6% |
| Immigrants | Brazil | 99.8 /100 | #57 | Exceptional 5.6% |
| Immigrants | Zimbabwe | 99.8 /100 | #58 | Exceptional 5.6% |
| Immigrants | Afghanistan | 99.8 /100 | #59 | Exceptional 5.6% |
| Immigrants | Lithuania | 99.8 /100 | #60 | Exceptional 5.6% |
| Immigrants | Belgium | 99.7 /100 | #61 | Exceptional 5.6% |
| Immigrants | Spain | 99.7 /100 | #62 | Exceptional 5.6% |
Demographics Similar to Creek by Ambulatory Disability
In terms of ambulatory disability, the demographic groups most similar to Creek are Choctaw (8.3%, a difference of 1.6%), Kiowa (8.6%, a difference of 1.9%), Pima (8.2%, a difference of 2.5%), Colville (8.2%, a difference of 2.8%), and Tohono O'odham (8.7%, a difference of 3.4%).
| Demographics | Rating | Rank | Ambulatory Disability |
| Cherokee | 0.0 /100 | #333 | Tragic 7.9% |
| Yuman | 0.0 /100 | #334 | Tragic 7.9% |
| Chickasaw | 0.0 /100 | #335 | Tragic 8.0% |
| Seminole | 0.0 /100 | #336 | Tragic 8.0% |
| Dutch West Indians | 0.0 /100 | #337 | Tragic 8.2% |
| Colville | 0.0 /100 | #338 | Tragic 8.2% |
| Pima | 0.0 /100 | #339 | Tragic 8.2% |
| Choctaw | 0.0 /100 | #340 | Tragic 8.3% |
| Creek | 0.0 /100 | #341 | Tragic 8.5% |
| Kiowa | 0.0 /100 | #342 | Tragic 8.6% |
| Tohono O'odham | 0.0 /100 | #343 | Tragic 8.7% |
| Tsimshian | 0.0 /100 | #344 | Tragic 8.8% |
| Puerto Ricans | 0.0 /100 | #345 | Tragic 8.9% |
| Houma | 0.0 /100 | #346 | Tragic 9.3% |
| Lumbee | 0.0 /100 | #347 | Tragic 9.5% |