Immigrants from Belarus vs Creek Ambulatory Disability
COMPARE
Immigrants from Belarus
Creek
Ambulatory Disability
Ambulatory Disability Comparison
Immigrants from Belarus
Creek
6.1%
AMBULATORY DISABILITY
69.2/ 100
METRIC RATING
161st/ 347
METRIC RANK
8.5%
AMBULATORY DISABILITY
0.0/ 100
METRIC RATING
341st/ 347
METRIC RANK
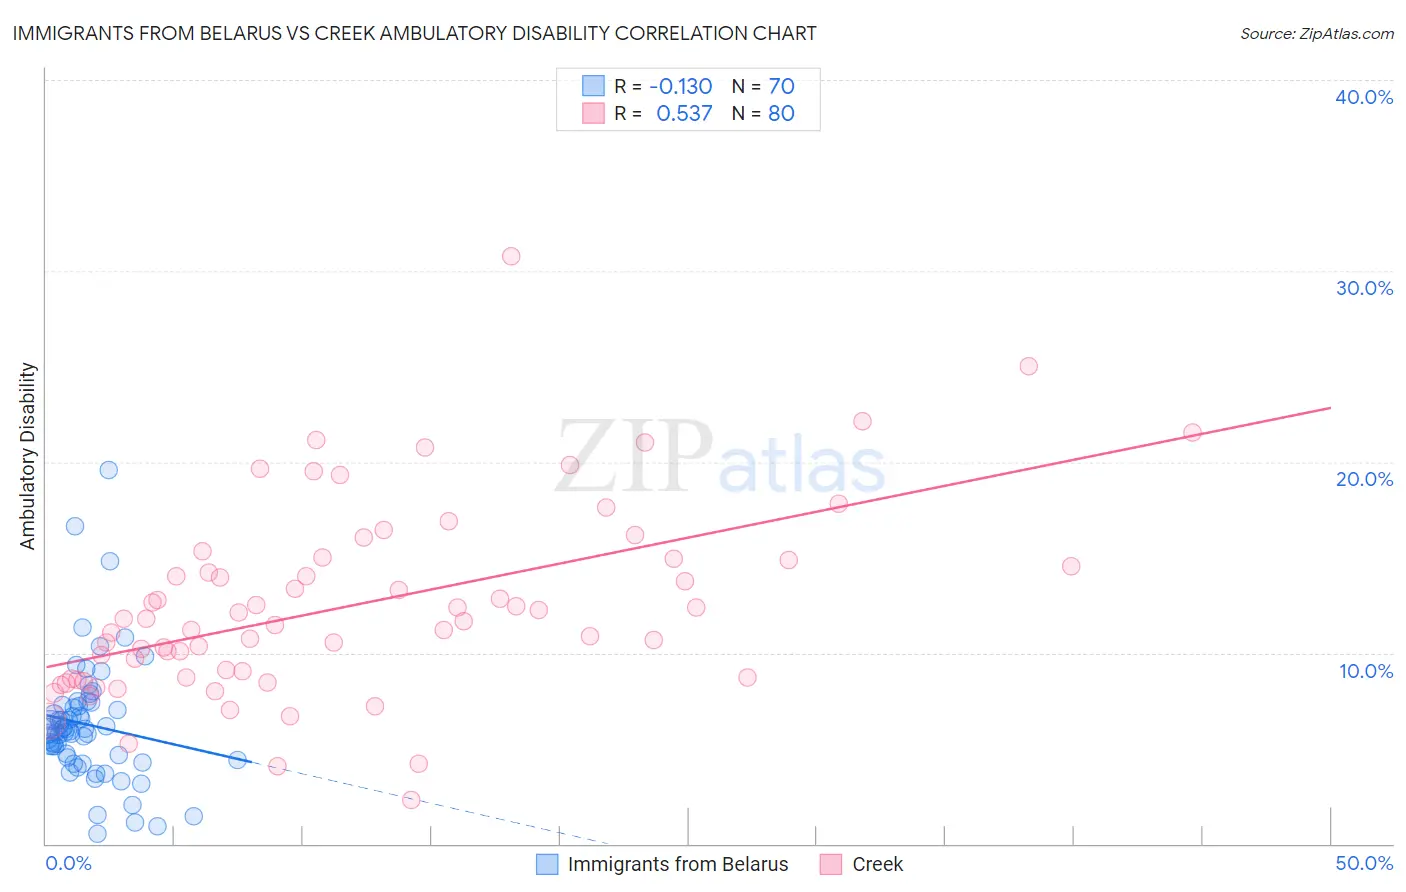
Immigrants from Belarus vs Creek Ambulatory Disability Correlation Chart
The statistical analysis conducted on geographies consisting of 150,188,321 people shows a poor negative correlation between the proportion of Immigrants from Belarus and percentage of population with ambulatory disability in the United States with a correlation coefficient (R) of -0.130 and weighted average of 6.1%. Similarly, the statistical analysis conducted on geographies consisting of 178,444,493 people shows a substantial positive correlation between the proportion of Creek and percentage of population with ambulatory disability in the United States with a correlation coefficient (R) of 0.537 and weighted average of 8.5%, a difference of 39.6%.
Ambulatory Disability Correlation Summary
| Measurement | Immigrants from Belarus | Creek |
| Minimum | 0.54% | 2.3% |
| Maximum | 19.6% | 30.8% |
| Range | 19.0% | 28.5% |
| Mean | 6.2% | 12.5% |
| Median | 5.9% | 11.7% |
| Interquartile 25% (IQ1) | 4.5% | 8.7% |
| Interquartile 75% (IQ3) | 7.2% | 14.9% |
| Interquartile Range (IQR) | 2.7% | 6.2% |
| Standard Deviation (Sample) | 3.2% | 5.0% |
| Standard Deviation (Population) | 3.2% | 5.0% |
Similar Demographics by Ambulatory Disability
Demographics Similar to Immigrants from Belarus by Ambulatory Disability
In terms of ambulatory disability, the demographic groups most similar to Immigrants from Belarus are Central American (6.0%, a difference of 0.040%), Immigrants from Latvia (6.0%, a difference of 0.12%), Immigrants from Fiji (6.0%, a difference of 0.13%), Nigerian (6.1%, a difference of 0.13%), and Ghanaian (6.0%, a difference of 0.14%).
| Demographics | Rating | Rank | Ambulatory Disability |
| Immigrants | Croatia | 75.1 /100 | #154 | Good 6.0% |
| Immigrants | Scotland | 72.1 /100 | #155 | Good 6.0% |
| Northern Europeans | 71.8 /100 | #156 | Good 6.0% |
| Ghanaians | 71.3 /100 | #157 | Good 6.0% |
| Immigrants | Fiji | 71.2 /100 | #158 | Good 6.0% |
| Immigrants | Latvia | 71.1 /100 | #159 | Good 6.0% |
| Central Americans | 69.8 /100 | #160 | Good 6.0% |
| Immigrants | Belarus | 69.2 /100 | #161 | Good 6.1% |
| Nigerians | 67.1 /100 | #162 | Good 6.1% |
| Lebanese | 66.2 /100 | #163 | Good 6.1% |
| Basques | 63.7 /100 | #164 | Good 6.1% |
| Nicaraguans | 63.2 /100 | #165 | Good 6.1% |
| Iraqis | 62.8 /100 | #166 | Good 6.1% |
| Immigrants | Oceania | 60.7 /100 | #167 | Good 6.1% |
| Ecuadorians | 60.5 /100 | #168 | Good 6.1% |
Demographics Similar to Creek by Ambulatory Disability
In terms of ambulatory disability, the demographic groups most similar to Creek are Choctaw (8.3%, a difference of 1.6%), Kiowa (8.6%, a difference of 1.9%), Pima (8.2%, a difference of 2.5%), Colville (8.2%, a difference of 2.8%), and Tohono O'odham (8.7%, a difference of 3.4%).
| Demographics | Rating | Rank | Ambulatory Disability |
| Cherokee | 0.0 /100 | #333 | Tragic 7.9% |
| Yuman | 0.0 /100 | #334 | Tragic 7.9% |
| Chickasaw | 0.0 /100 | #335 | Tragic 8.0% |
| Seminole | 0.0 /100 | #336 | Tragic 8.0% |
| Dutch West Indians | 0.0 /100 | #337 | Tragic 8.2% |
| Colville | 0.0 /100 | #338 | Tragic 8.2% |
| Pima | 0.0 /100 | #339 | Tragic 8.2% |
| Choctaw | 0.0 /100 | #340 | Tragic 8.3% |
| Creek | 0.0 /100 | #341 | Tragic 8.5% |
| Kiowa | 0.0 /100 | #342 | Tragic 8.6% |
| Tohono O'odham | 0.0 /100 | #343 | Tragic 8.7% |
| Tsimshian | 0.0 /100 | #344 | Tragic 8.8% |
| Puerto Ricans | 0.0 /100 | #345 | Tragic 8.9% |
| Houma | 0.0 /100 | #346 | Tragic 9.3% |
| Lumbee | 0.0 /100 | #347 | Tragic 9.5% |