Ottawa vs Scottish Ambulatory Disability
COMPARE
Ottawa
Scottish
Ambulatory Disability
Ambulatory Disability Comparison
Ottawa
Scottish
7.2%
AMBULATORY DISABILITY
0.0/ 100
METRIC RATING
318th/ 347
METRIC RANK
6.5%
AMBULATORY DISABILITY
0.7/ 100
METRIC RATING
253rd/ 347
METRIC RANK
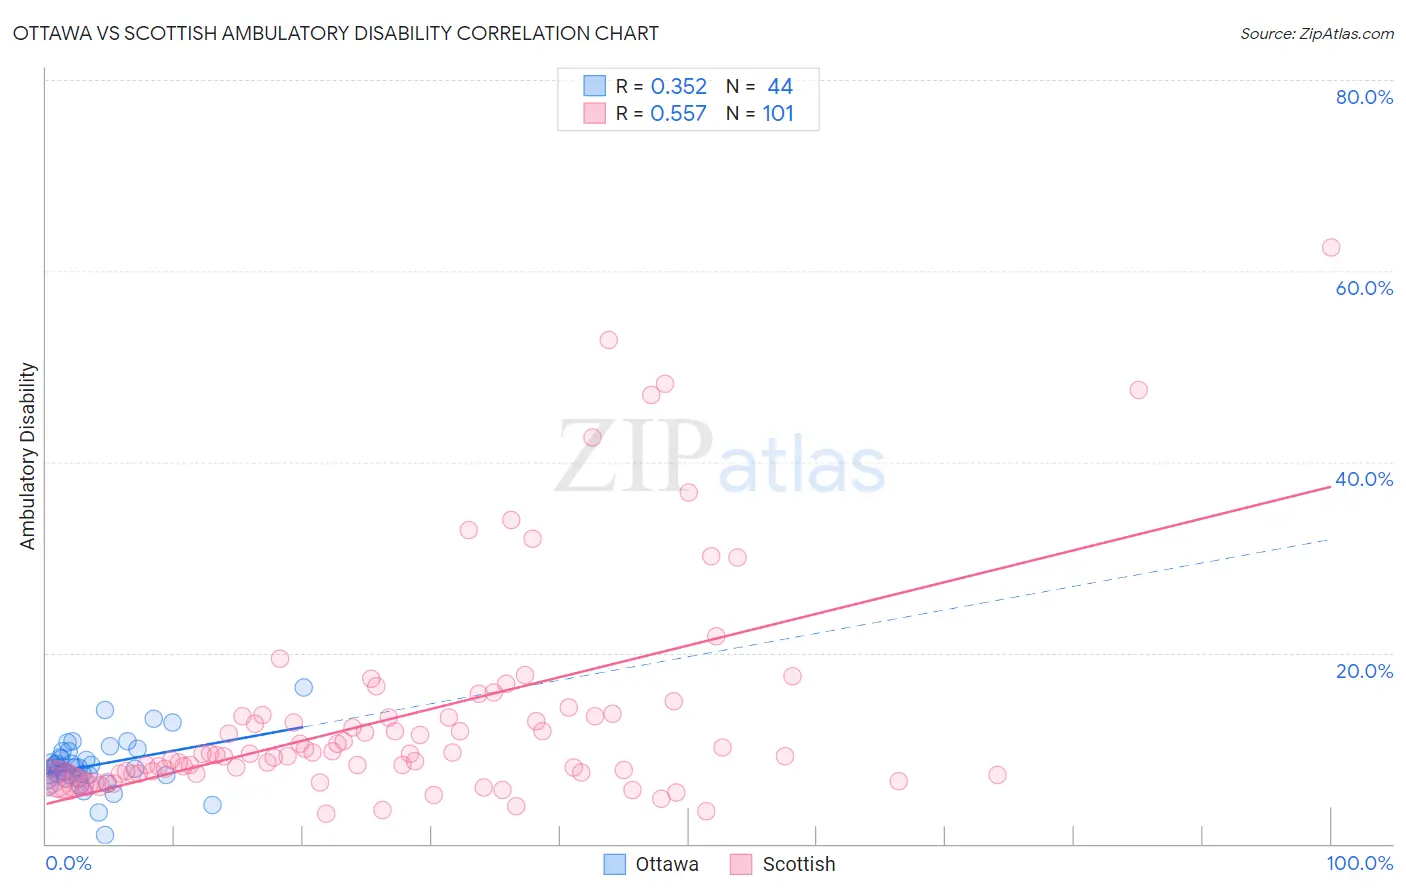
Ottawa vs Scottish Ambulatory Disability Correlation Chart
The statistical analysis conducted on geographies consisting of 49,954,761 people shows a mild positive correlation between the proportion of Ottawa and percentage of population with ambulatory disability in the United States with a correlation coefficient (R) of 0.352 and weighted average of 7.2%. Similarly, the statistical analysis conducted on geographies consisting of 566,616,487 people shows a substantial positive correlation between the proportion of Scottish and percentage of population with ambulatory disability in the United States with a correlation coefficient (R) of 0.557 and weighted average of 6.5%, a difference of 9.9%.
Ambulatory Disability Correlation Summary
| Measurement | Ottawa | Scottish |
| Minimum | 0.87% | 3.1% |
| Maximum | 16.4% | 62.5% |
| Range | 15.5% | 59.4% |
| Mean | 8.2% | 13.4% |
| Median | 7.9% | 9.4% |
| Interquartile 25% (IQ1) | 7.0% | 7.3% |
| Interquartile 75% (IQ3) | 9.4% | 13.4% |
| Interquartile Range (IQR) | 2.3% | 6.1% |
| Standard Deviation (Sample) | 2.7% | 11.4% |
| Standard Deviation (Population) | 2.7% | 11.4% |
Similar Demographics by Ambulatory Disability
Demographics Similar to Ottawa by Ambulatory Disability
In terms of ambulatory disability, the demographic groups most similar to Ottawa are Central American Indian (7.2%, a difference of 0.090%), Immigrants from Dominican Republic (7.1%, a difference of 0.17%), Dominican (7.2%, a difference of 0.33%), Shoshone (7.1%, a difference of 0.41%), and Blackfeet (7.1%, a difference of 0.43%).
| Demographics | Rating | Rank | Ambulatory Disability |
| Cree | 0.0 /100 | #311 | Tragic 7.1% |
| Delaware | 0.0 /100 | #312 | Tragic 7.1% |
| Immigrants | Yemen | 0.0 /100 | #313 | Tragic 7.1% |
| Blackfeet | 0.0 /100 | #314 | Tragic 7.1% |
| Shoshone | 0.0 /100 | #315 | Tragic 7.1% |
| Immigrants | Dominican Republic | 0.0 /100 | #316 | Tragic 7.1% |
| Central American Indians | 0.0 /100 | #317 | Tragic 7.2% |
| Ottawa | 0.0 /100 | #318 | Tragic 7.2% |
| Dominicans | 0.0 /100 | #319 | Tragic 7.2% |
| Potawatomi | 0.0 /100 | #320 | Tragic 7.3% |
| Apache | 0.0 /100 | #321 | Tragic 7.4% |
| Osage | 0.0 /100 | #322 | Tragic 7.4% |
| Americans | 0.0 /100 | #323 | Tragic 7.4% |
| Navajo | 0.0 /100 | #324 | Tragic 7.5% |
| Comanche | 0.0 /100 | #325 | Tragic 7.5% |
Demographics Similar to Scottish by Ambulatory Disability
In terms of ambulatory disability, the demographic groups most similar to Scottish are Immigrants from Bahamas (6.5%, a difference of 0.050%), Belizean (6.5%, a difference of 0.16%), Welsh (6.5%, a difference of 0.23%), Hawaiian (6.5%, a difference of 0.25%), and Immigrants from Uzbekistan (6.5%, a difference of 0.30%).
| Demographics | Rating | Rank | Ambulatory Disability |
| Armenians | 1.5 /100 | #246 | Tragic 6.5% |
| Immigrants | Cuba | 1.4 /100 | #247 | Tragic 6.5% |
| Immigrants | Portugal | 1.4 /100 | #248 | Tragic 6.5% |
| Native Hawaiians | 1.1 /100 | #249 | Tragic 6.5% |
| Chinese | 1.0 /100 | #250 | Tragic 6.5% |
| Hawaiians | 0.9 /100 | #251 | Tragic 6.5% |
| Immigrants | Bahamas | 0.8 /100 | #252 | Tragic 6.5% |
| Scottish | 0.7 /100 | #253 | Tragic 6.5% |
| Belizeans | 0.7 /100 | #254 | Tragic 6.5% |
| Welsh | 0.6 /100 | #255 | Tragic 6.5% |
| Immigrants | Uzbekistan | 0.6 /100 | #256 | Tragic 6.5% |
| Bermudans | 0.5 /100 | #257 | Tragic 6.5% |
| Spanish American Indians | 0.5 /100 | #258 | Tragic 6.5% |
| Aleuts | 0.4 /100 | #259 | Tragic 6.6% |
| Immigrants | Belize | 0.4 /100 | #260 | Tragic 6.6% |