Ottawa vs Immigrants from Philippines Ambulatory Disability
COMPARE
Ottawa
Immigrants from Philippines
Ambulatory Disability
Ambulatory Disability Comparison
Ottawa
Immigrants from Philippines
7.2%
AMBULATORY DISABILITY
0.0/ 100
METRIC RATING
318th/ 347
METRIC RANK
6.0%
AMBULATORY DISABILITY
83.0/ 100
METRIC RATING
142nd/ 347
METRIC RANK
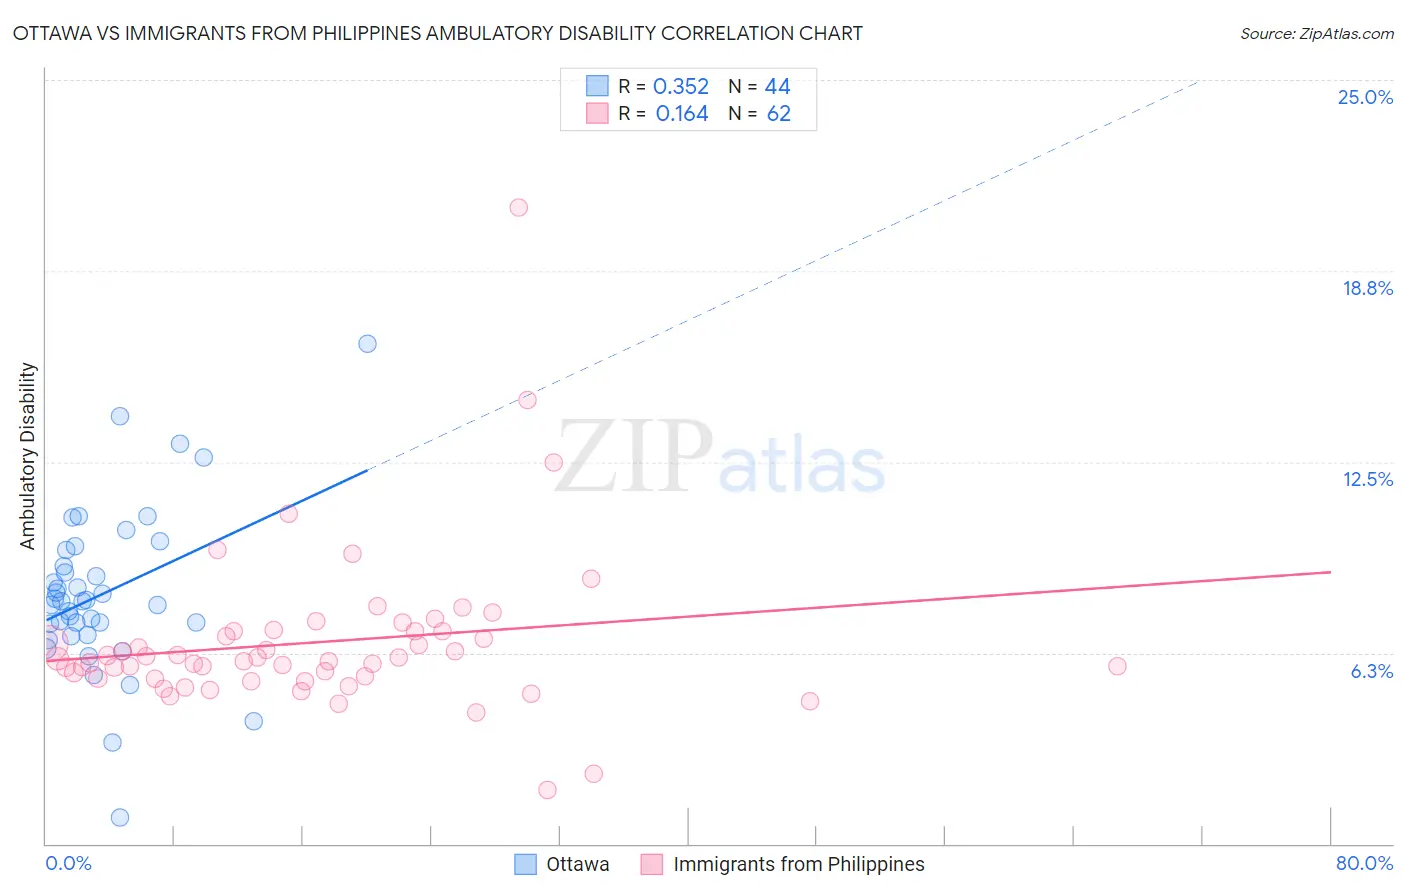
Ottawa vs Immigrants from Philippines Ambulatory Disability Correlation Chart
The statistical analysis conducted on geographies consisting of 49,954,761 people shows a mild positive correlation between the proportion of Ottawa and percentage of population with ambulatory disability in the United States with a correlation coefficient (R) of 0.352 and weighted average of 7.2%. Similarly, the statistical analysis conducted on geographies consisting of 471,065,462 people shows a poor positive correlation between the proportion of Immigrants from Philippines and percentage of population with ambulatory disability in the United States with a correlation coefficient (R) of 0.164 and weighted average of 6.0%, a difference of 19.6%.
Ambulatory Disability Correlation Summary
| Measurement | Ottawa | Immigrants from Philippines |
| Minimum | 0.87% | 1.8% |
| Maximum | 16.4% | 20.8% |
| Range | 15.5% | 19.1% |
| Mean | 8.2% | 6.6% |
| Median | 7.9% | 6.0% |
| Interquartile 25% (IQ1) | 7.0% | 5.4% |
| Interquartile 75% (IQ3) | 9.4% | 7.0% |
| Interquartile Range (IQR) | 2.3% | 1.5% |
| Standard Deviation (Sample) | 2.7% | 2.7% |
| Standard Deviation (Population) | 2.7% | 2.7% |
Similar Demographics by Ambulatory Disability
Demographics Similar to Ottawa by Ambulatory Disability
In terms of ambulatory disability, the demographic groups most similar to Ottawa are Central American Indian (7.2%, a difference of 0.090%), Immigrants from Dominican Republic (7.1%, a difference of 0.17%), Dominican (7.2%, a difference of 0.33%), Shoshone (7.1%, a difference of 0.41%), and Blackfeet (7.1%, a difference of 0.43%).
| Demographics | Rating | Rank | Ambulatory Disability |
| Cree | 0.0 /100 | #311 | Tragic 7.1% |
| Delaware | 0.0 /100 | #312 | Tragic 7.1% |
| Immigrants | Yemen | 0.0 /100 | #313 | Tragic 7.1% |
| Blackfeet | 0.0 /100 | #314 | Tragic 7.1% |
| Shoshone | 0.0 /100 | #315 | Tragic 7.1% |
| Immigrants | Dominican Republic | 0.0 /100 | #316 | Tragic 7.1% |
| Central American Indians | 0.0 /100 | #317 | Tragic 7.2% |
| Ottawa | 0.0 /100 | #318 | Tragic 7.2% |
| Dominicans | 0.0 /100 | #319 | Tragic 7.2% |
| Potawatomi | 0.0 /100 | #320 | Tragic 7.3% |
| Apache | 0.0 /100 | #321 | Tragic 7.4% |
| Osage | 0.0 /100 | #322 | Tragic 7.4% |
| Americans | 0.0 /100 | #323 | Tragic 7.4% |
| Navajo | 0.0 /100 | #324 | Tragic 7.5% |
| Comanche | 0.0 /100 | #325 | Tragic 7.5% |
Demographics Similar to Immigrants from Philippines by Ambulatory Disability
In terms of ambulatory disability, the demographic groups most similar to Immigrants from Philippines are Swedish (6.0%, a difference of 0.010%), Romanian (6.0%, a difference of 0.010%), Macedonian (6.0%, a difference of 0.020%), Czech (6.0%, a difference of 0.030%), and Pakistani (6.0%, a difference of 0.050%).
| Demographics | Rating | Rank | Ambulatory Disability |
| Immigrants | Italy | 85.0 /100 | #135 | Excellent 6.0% |
| Immigrants | North Macedonia | 84.1 /100 | #136 | Excellent 6.0% |
| Immigrants | Syria | 84.1 /100 | #137 | Excellent 6.0% |
| Immigrants | Hungary | 83.9 /100 | #138 | Excellent 6.0% |
| Immigrants | Zaire | 83.6 /100 | #139 | Excellent 6.0% |
| Czechs | 83.3 /100 | #140 | Excellent 6.0% |
| Swedes | 83.1 /100 | #141 | Excellent 6.0% |
| Immigrants | Philippines | 83.0 /100 | #142 | Excellent 6.0% |
| Romanians | 82.9 /100 | #143 | Excellent 6.0% |
| Macedonians | 82.8 /100 | #144 | Excellent 6.0% |
| Pakistanis | 82.5 /100 | #145 | Excellent 6.0% |
| Immigrants | Greece | 82.5 /100 | #146 | Excellent 6.0% |
| Immigrants | Moldova | 82.4 /100 | #147 | Excellent 6.0% |
| Immigrants | Eastern Europe | 82.0 /100 | #148 | Excellent 6.0% |
| Lithuanians | 81.9 /100 | #149 | Excellent 6.0% |