Ottawa vs Immigrants from Scotland Ambulatory Disability

COMPARE

Ottawa
Race
Ancestry
AfghanAfricanAlaska NativeAlaskan AthabascanAlbanianAleutAlsatianAmericanApacheArabArapahoArgentineanArmenianAssyrian/Chaldean/SyriacAustralianAustrianBahamianBangladeshiBarbadianBasqueBelgianBelizeanBermudanBhutaneseBlackfeetBolivianBrazilianBritishBritish West IndianBulgarianBurmeseCajunCambodianCanadianCape VerdeanCarpatho RusynCelticCentral AmericanCentral American IndianCherokeeCheyenneChickasawChileanChineseChippewaChoctawColombianColvilleComancheCosta RicanCreeCreekCroatianCrowCubanCypriotCzechCzechoslovakianDanishDelawareDominicanDutchDutch West IndianEastern EuropeanEcuadorianEgyptianEnglishEstonianEthiopianEuropeanFijianFilipinoFinnishFrenchFrench American IndianFrench CanadianGermanGerman RussianGhanaianGreekGuamanian/ChamorroGuatemalanGuyaneseHaitianHmongHonduranHopiHoumaHungarianIcelanderIndian (Asian)IndonesianInupiatIranianIraqiIrishIroquoisIsraeliItalianJamaicanJapaneseJordanianKenyanKiowaKoreanLaotianLatvianLebaneseLiberianLithuanianLumbeeLuxembourgerMacedonianMalaysianMalteseMarshalleseMenomineeMexicanMexican American IndianMongolianMoroccanNative HawaiianNavajoNepaleseNew ZealanderNicaraguanNigerianNorthern EuropeanNorwegianOkinawanOsageOttawaPaiutePakistaniPalestinianPanamanianParaguayanPennsylvania GermanPeruvianPimaPolishPortuguesePotawatomiPuebloPuerto RicanPuget Sound SalishRomanianRussianSalvadoranSamoanScandinavianScotch-IrishScottishSeminoleSenegaleseSerbianShoshoneSierra LeoneanSiouxSlavicSlovakSloveneSomaliSouth AfricanSouth AmericanSouth American IndianSoviet UnionSpaniardSpanishSpanish AmericanSpanish American IndianSri LankanSubsaharan AfricanSudaneseSwedishSwissSyrianTaiwaneseThaiTlingit-HaidaTohono O'OdhamTonganTrinidadian and TobagonianTsimshianTurkishU.S. Virgin IslanderUgandanUkrainianUruguayanUteVenezuelanVietnameseWelshWest IndianYakamaYaquiYugoslavianYumanYup'ikZimbabwean
Immigration
NonimmigrantsImmigrantsAfghanistanAfricaAlbaniaArgentinaArmeniaAsiaAustraliaAustriaBahamasBangladeshBarbadosBelarusBelgiumBelizeBoliviaBosnia and HerzegovinaBrazilBulgariaBurma/MyanmarCabo VerdeCambodiaCameroonCanadaCaribbeanCentral AmericaChileChinaColombiaCongoCosta RicaCroatiaCubaCzechoslovakiaDenmarkDominicaDominican RepublicEastern AfricaEastern AsiaEastern EuropeEcuadorEgyptEl SalvadorEnglandEritreaEthiopiaEuropeFijiFranceGermanyGhanaGreeceGrenadaGuatemalaGuyanaHaitiHondurasHong KongHungaryIndiaIndonesiaIranIraqIrelandIsraelItalyJamaicaJapanJordanKazakhstanKenyaKoreaKuwaitLaosLatin AmericaLatviaLebanonLiberiaLithuaniaMalaysiaMexicoMicronesiaMiddle AfricaMoldovaMoroccoNepalNetherlandsNicaraguaNigeriaNorth AmericaNorth MacedoniaNorthern AfricaNorthern EuropeNorwayOceaniaPakistanPanamaPeruPhilippinesPolandPortugalRomaniaRussiaSaudi ArabiaSenegalSerbiaSierra LeoneSingaporeSomaliaSouth AfricaSouth AmericaSouth Central AsiaSouth Eastern AsiaSouthern EuropeSpainSri LankaSt. Vincent and the GrenadinesSudanSwedenSwitzerlandSyriaTaiwanThailandTrinidad and TobagoTurkeyUgandaUkraineUruguayUzbekistanVenezuelaVietnamWest IndiesWestern AfricaWestern AsiaWestern EuropeYemenZaireZimbabweAzores
Immigrants from Scotland
Race
Ancestry
AfghanAfricanAlaska NativeAlaskan AthabascanAlbanianAleutAlsatianAmericanApacheArabArapahoArgentineanArmenianAssyrian/Chaldean/SyriacAustralianAustrianBahamianBangladeshiBarbadianBasqueBelgianBelizeanBermudanBhutaneseBlackfeetBolivianBrazilianBritishBritish West IndianBulgarianBurmeseCajunCambodianCanadianCape VerdeanCarpatho RusynCelticCentral AmericanCentral American IndianCherokeeCheyenneChickasawChileanChineseChippewaChoctawColombianColvilleComancheCosta RicanCreeCreekCroatianCrowCubanCypriotCzechCzechoslovakianDanishDelawareDominicanDutchDutch West IndianEastern EuropeanEcuadorianEgyptianEnglishEstonianEthiopianEuropeanFijianFilipinoFinnishFrenchFrench American IndianFrench CanadianGermanGerman RussianGhanaianGreekGuamanian/ChamorroGuatemalanGuyaneseHaitianHmongHonduranHopiHoumaHungarianIcelanderIndian (Asian)IndonesianInupiatIranianIraqiIrishIroquoisIsraeliItalianJamaicanJapaneseJordanianKenyanKiowaKoreanLaotianLatvianLebaneseLiberianLithuanianLumbeeLuxembourgerMacedonianMalaysianMalteseMarshalleseMenomineeMexicanMexican American IndianMongolianMoroccanNative HawaiianNavajoNepaleseNew ZealanderNicaraguanNigerianNorthern EuropeanNorwegianOkinawanOsagePaiutePakistaniPalestinianPanamanianParaguayanPennsylvania GermanPeruvianPimaPolishPortuguesePotawatomiPuebloPuerto RicanPuget Sound SalishRomanianRussianSalvadoranSamoanScandinavianScotch-IrishScottishSeminoleSenegaleseSerbianShoshoneSierra LeoneanSiouxSlavicSlovakSloveneSomaliSouth AfricanSouth AmericanSouth American IndianSoviet UnionSpaniardSpanishSpanish AmericanSpanish American IndianSri LankanSubsaharan AfricanSudaneseSwedishSwissSyrianTaiwaneseThaiTlingit-HaidaTohono O'OdhamTonganTrinidadian and TobagonianTsimshianTurkishU.S. Virgin IslanderUgandanUkrainianUruguayanUteVenezuelanVietnameseWelshWest IndianYakamaYaquiYugoslavianYumanYup'ikZimbabwean
Immigration
NonimmigrantsImmigrantsAfghanistanAfricaAlbaniaArgentinaArmeniaAsiaAustraliaAustriaBahamasBangladeshBarbadosBelarusBelgiumBelizeBoliviaBosnia and HerzegovinaBrazilBulgariaBurma/MyanmarCabo VerdeCambodiaCameroonCanadaCaribbeanCentral AmericaChileChinaColombiaCongoCosta RicaCroatiaCubaCzechoslovakiaDenmarkDominicaDominican RepublicEastern AfricaEastern AsiaEastern EuropeEcuadorEgyptEl SalvadorEnglandEritreaEthiopiaEuropeFijiFranceGermanyGhanaGreeceGrenadaGuatemalaGuyanaHaitiHondurasHong KongHungaryIndiaIndonesiaIranIraqIrelandIsraelItalyJamaicaJapanJordanKazakhstanKenyaKoreaKuwaitLaosLatin AmericaLatviaLebanonLiberiaLithuaniaMalaysiaMexicoMicronesiaMiddle AfricaMoldovaMoroccoNepalNetherlandsNicaraguaNigeriaNorth AmericaNorth MacedoniaNorthern AfricaNorthern EuropeNorwayOceaniaPakistanPanamaPeruPhilippinesPolandPortugalRomaniaRussiaSaudi ArabiaScotlandSenegalSerbiaSierra LeoneSingaporeSomaliaSouth AfricaSouth AmericaSouth Central AsiaSouth Eastern AsiaSouthern EuropeSpainSri LankaSt. Vincent and the GrenadinesSudanSwedenSwitzerlandSyriaTaiwanThailandTrinidad and TobagoTurkeyUgandaUkraineUruguayUzbekistanVenezuelaVietnamWest IndiesWestern AfricaWestern AsiaWestern EuropeYemenZaireZimbabweAzores
Ambulatory Disability
Income
Poverty
Unemployment
Labor Participation
Family Structure
Vehicle Availability
Education Level
Disability

Ambulatory Disability Comparison

Ottawa

Immigrants from Scotland

Tragic
Good
7.2%
AMBULATORY DISABILITY
0.0/ 100
METRIC RATING
318th/ 347
METRIC RANK
6.0%
AMBULATORY DISABILITY
72.1/ 100
METRIC RATING
155th/ 347
METRIC RANK

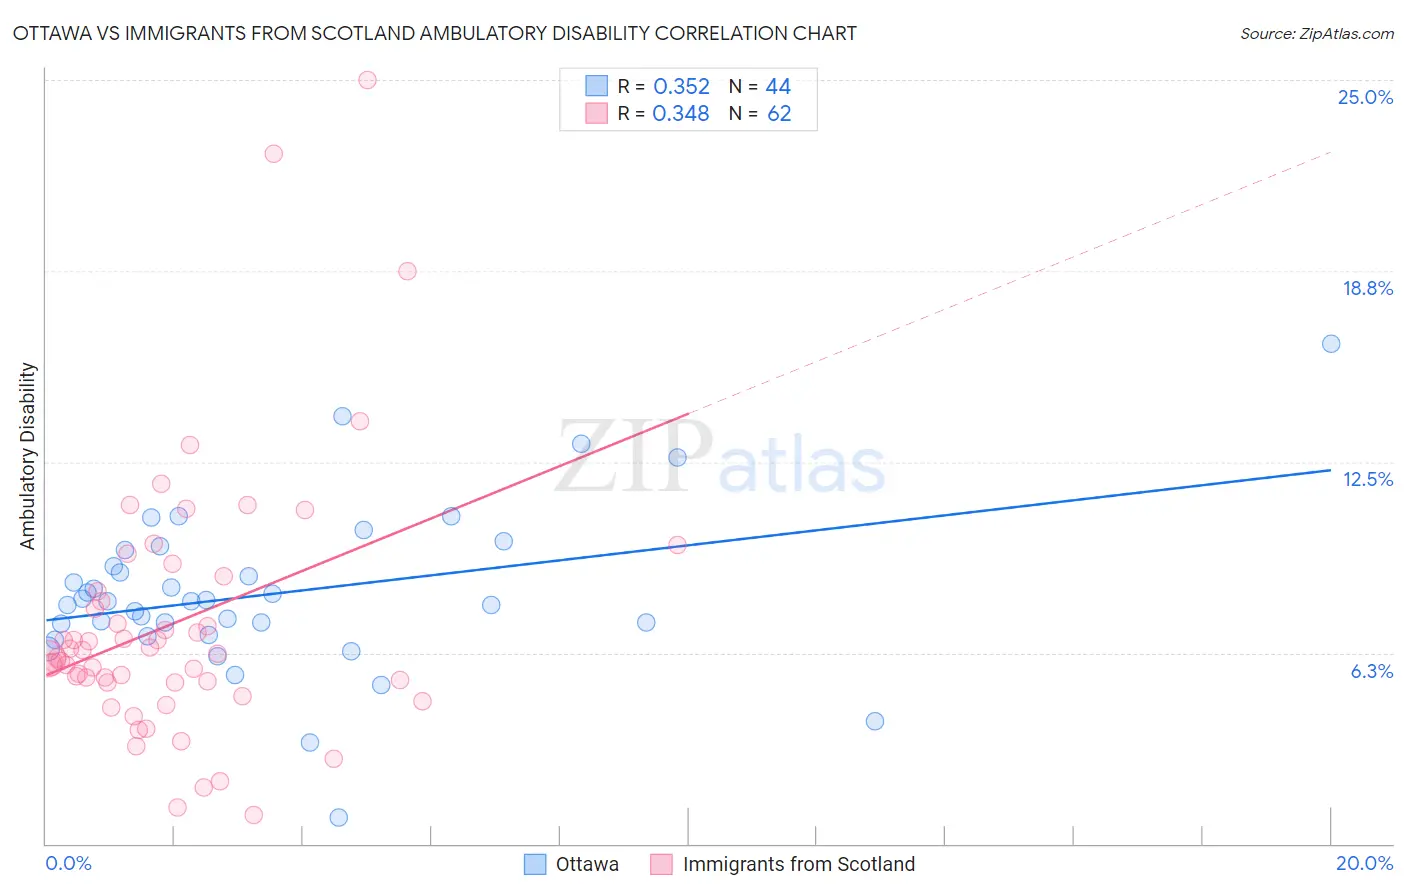
Ottawa vs Immigrants from Scotland Ambulatory Disability Correlation Chart

The statistical analysis conducted on geographies consisting of 49,954,761 people shows a mild positive correlation between the proportion of Ottawa and percentage of population with ambulatory disability in the United States with a correlation coefficient (R) of 0.352 and weighted average of 7.2%. Similarly, the statistical analysis conducted on geographies consisting of 196,384,965 people shows a mild positive correlation between the proportion of Immigrants from Scotland and percentage of population with ambulatory disability in the United States with a correlation coefficient (R) of 0.348 and weighted average of 6.0%, a difference of 18.5%.
Ottawa vs Immigrants from Scotland Ambulatory Disability

Ambulatory Disability Correlation Summary

MeasurementOttawaImmigrants from Scotland
Minimum0.87%0.96%
Maximum16.4%25.0%
Range15.5%24.0%
Mean8.2%7.2%
Median7.9%6.2%
Interquartile 25% (IQ1)7.0%5.3%
Interquartile 75% (IQ3)9.4%8.2%
Interquartile Range (IQR)2.3%3.0%
Standard Deviation (Sample)2.7%4.4%
Standard Deviation (Population)2.7%4.3%

Similar Demographics by Ambulatory Disability

Demographics Similar to Ottawa by Ambulatory Disability

In terms of ambulatory disability, the demographic groups most similar to Ottawa are Central American Indian (7.2%, a difference of 0.090%), Immigrants from Dominican Republic (7.1%, a difference of 0.17%), Dominican (7.2%, a difference of 0.33%), Shoshone (7.1%, a difference of 0.41%), and Blackfeet (7.1%, a difference of 0.43%).
DemographicsRating | RankAmbulatory Disability
Cree
0.0
/100
|
#311
Tragic
7.1%
Delaware
0.0
/100
|
#312
Tragic
7.1%
Immigrants | Yemen
0.0
/100
|
#313
Tragic
7.1%
Blackfeet
0.0
/100
|
#314
Tragic
7.1%
Shoshone
0.0
/100
|
#315
Tragic
7.1%
Immigrants | Dominican Republic
0.0
/100
|
#316
Tragic
7.1%
Central American Indians
0.0
/100
|
#317
Tragic
7.2%
Ottawa
0.0
/100
|
#318
Tragic
7.2%
Dominicans
0.0
/100
|
#319
Tragic
7.2%
Potawatomi
0.0
/100
|
#320
Tragic
7.3%
Apache
0.0
/100
|
#321
Tragic
7.4%
Osage
0.0
/100
|
#322
Tragic
7.4%
Americans
0.0
/100
|
#323
Tragic
7.4%
Navajo
0.0
/100
|
#324
Tragic
7.5%
Comanche
0.0
/100
|
#325
Tragic
7.5%

Demographics Similar to Immigrants from Scotland by Ambulatory Disability

In terms of ambulatory disability, the demographic groups most similar to Immigrants from Scotland are Northern European (6.0%, a difference of 0.020%), Ghanaian (6.0%, a difference of 0.050%), Immigrants from Fiji (6.0%, a difference of 0.070%), Immigrants from Latvia (6.0%, a difference of 0.070%), and Central American (6.0%, a difference of 0.15%).
DemographicsRating | RankAmbulatory Disability
Immigrants | Eastern Europe
82.0
/100
|
#148
Excellent
6.0%
Lithuanians
81.9
/100
|
#149
Excellent
6.0%
Maltese
81.6
/100
|
#150
Excellent
6.0%
Greeks
79.6
/100
|
#151
Good
6.0%
Immigrants | Austria
78.8
/100
|
#152
Good
6.0%
Syrians
75.5
/100
|
#153
Good
6.0%
Immigrants | Croatia
75.1
/100
|
#154
Good
6.0%
Immigrants | Scotland
72.1
/100
|
#155
Good
6.0%
Northern Europeans
71.8
/100
|
#156
Good
6.0%
Ghanaians
71.3
/100
|
#157
Good
6.0%
Immigrants | Fiji
71.2
/100
|
#158
Good
6.0%
Immigrants | Latvia
71.1
/100
|
#159
Good
6.0%
Central Americans
69.8
/100
|
#160
Good
6.0%
Immigrants | Belarus
69.2
/100
|
#161
Good
6.1%
Nigerians
67.1
/100
|
#162
Good
6.1%