Immigrants from Europe vs Creek Ambulatory Disability
COMPARE
Immigrants from Europe
Creek
Ambulatory Disability
Ambulatory Disability Comparison
Immigrants from Europe
Creek
6.0%
AMBULATORY DISABILITY
87.8/ 100
METRIC RATING
132nd/ 347
METRIC RANK
8.5%
AMBULATORY DISABILITY
0.0/ 100
METRIC RATING
341st/ 347
METRIC RANK
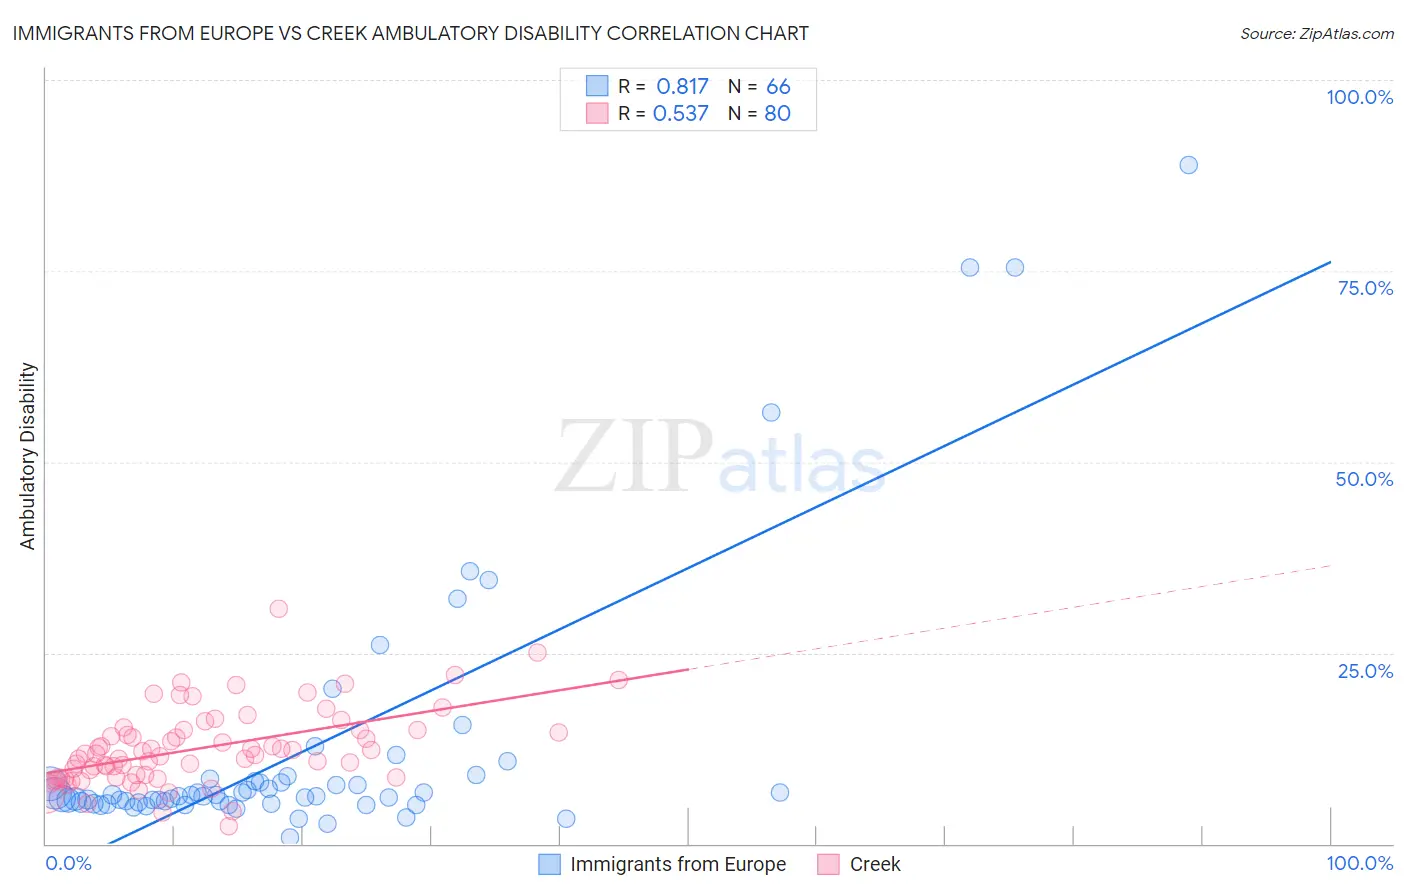
Immigrants from Europe vs Creek Ambulatory Disability Correlation Chart
The statistical analysis conducted on geographies consisting of 547,017,856 people shows a very strong positive correlation between the proportion of Immigrants from Europe and percentage of population with ambulatory disability in the United States with a correlation coefficient (R) of 0.817 and weighted average of 6.0%. Similarly, the statistical analysis conducted on geographies consisting of 178,444,493 people shows a substantial positive correlation between the proportion of Creek and percentage of population with ambulatory disability in the United States with a correlation coefficient (R) of 0.537 and weighted average of 8.5%, a difference of 41.8%.
Ambulatory Disability Correlation Summary
| Measurement | Immigrants from Europe | Creek |
| Minimum | 0.74% | 2.3% |
| Maximum | 88.9% | 30.8% |
| Range | 88.1% | 28.5% |
| Mean | 12.3% | 12.5% |
| Median | 6.2% | 11.7% |
| Interquartile 25% (IQ1) | 5.4% | 8.7% |
| Interquartile 75% (IQ3) | 8.2% | 14.9% |
| Interquartile Range (IQR) | 2.8% | 6.2% |
| Standard Deviation (Sample) | 17.4% | 5.0% |
| Standard Deviation (Population) | 17.3% | 5.0% |
Similar Demographics by Ambulatory Disability
Demographics Similar to Immigrants from Europe by Ambulatory Disability
In terms of ambulatory disability, the demographic groups most similar to Immigrants from Europe are Immigrants (6.0%, a difference of 0.11%), Ute (6.0%, a difference of 0.15%), Immigrants from Costa Rica (5.9%, a difference of 0.24%), Immigrants from Kazakhstan (5.9%, a difference of 0.27%), and Immigrants from Italy (6.0%, a difference of 0.32%).
| Demographics | Rating | Rank | Ambulatory Disability |
| Koreans | 91.6 /100 | #125 | Exceptional 5.9% |
| Arabs | 91.5 /100 | #126 | Exceptional 5.9% |
| Immigrants | Nigeria | 90.9 /100 | #127 | Exceptional 5.9% |
| Immigrants | Western Asia | 90.7 /100 | #128 | Exceptional 5.9% |
| Immigrants | Norway | 90.5 /100 | #129 | Exceptional 5.9% |
| Immigrants | Kazakhstan | 89.7 /100 | #130 | Excellent 5.9% |
| Immigrants | Costa Rica | 89.5 /100 | #131 | Excellent 5.9% |
| Immigrants | Europe | 87.8 /100 | #132 | Excellent 6.0% |
| Immigrants | Immigrants | 86.9 /100 | #133 | Excellent 6.0% |
| Ute | 86.6 /100 | #134 | Excellent 6.0% |
| Immigrants | Italy | 85.0 /100 | #135 | Excellent 6.0% |
| Immigrants | North Macedonia | 84.1 /100 | #136 | Excellent 6.0% |
| Immigrants | Syria | 84.1 /100 | #137 | Excellent 6.0% |
| Immigrants | Hungary | 83.9 /100 | #138 | Excellent 6.0% |
| Immigrants | Zaire | 83.6 /100 | #139 | Excellent 6.0% |
Demographics Similar to Creek by Ambulatory Disability
In terms of ambulatory disability, the demographic groups most similar to Creek are Choctaw (8.3%, a difference of 1.6%), Kiowa (8.6%, a difference of 1.9%), Pima (8.2%, a difference of 2.5%), Colville (8.2%, a difference of 2.8%), and Tohono O'odham (8.7%, a difference of 3.4%).
| Demographics | Rating | Rank | Ambulatory Disability |
| Cherokee | 0.0 /100 | #333 | Tragic 7.9% |
| Yuman | 0.0 /100 | #334 | Tragic 7.9% |
| Chickasaw | 0.0 /100 | #335 | Tragic 8.0% |
| Seminole | 0.0 /100 | #336 | Tragic 8.0% |
| Dutch West Indians | 0.0 /100 | #337 | Tragic 8.2% |
| Colville | 0.0 /100 | #338 | Tragic 8.2% |
| Pima | 0.0 /100 | #339 | Tragic 8.2% |
| Choctaw | 0.0 /100 | #340 | Tragic 8.3% |
| Creek | 0.0 /100 | #341 | Tragic 8.5% |
| Kiowa | 0.0 /100 | #342 | Tragic 8.6% |
| Tohono O'odham | 0.0 /100 | #343 | Tragic 8.7% |
| Tsimshian | 0.0 /100 | #344 | Tragic 8.8% |
| Puerto Ricans | 0.0 /100 | #345 | Tragic 8.9% |
| Houma | 0.0 /100 | #346 | Tragic 9.3% |
| Lumbee | 0.0 /100 | #347 | Tragic 9.5% |