Ottawa vs Creek Family Households
COMPARE
Ottawa
Creek
Family Households
Family Households Comparison
Ottawa
Creek
63.0%
FAMILY HOUSEHOLDS
0.3/ 100
METRIC RATING
277th/ 347
METRIC RANK
64.2%
FAMILY HOUSEHOLDS
34.1/ 100
METRIC RATING
183rd/ 347
METRIC RANK
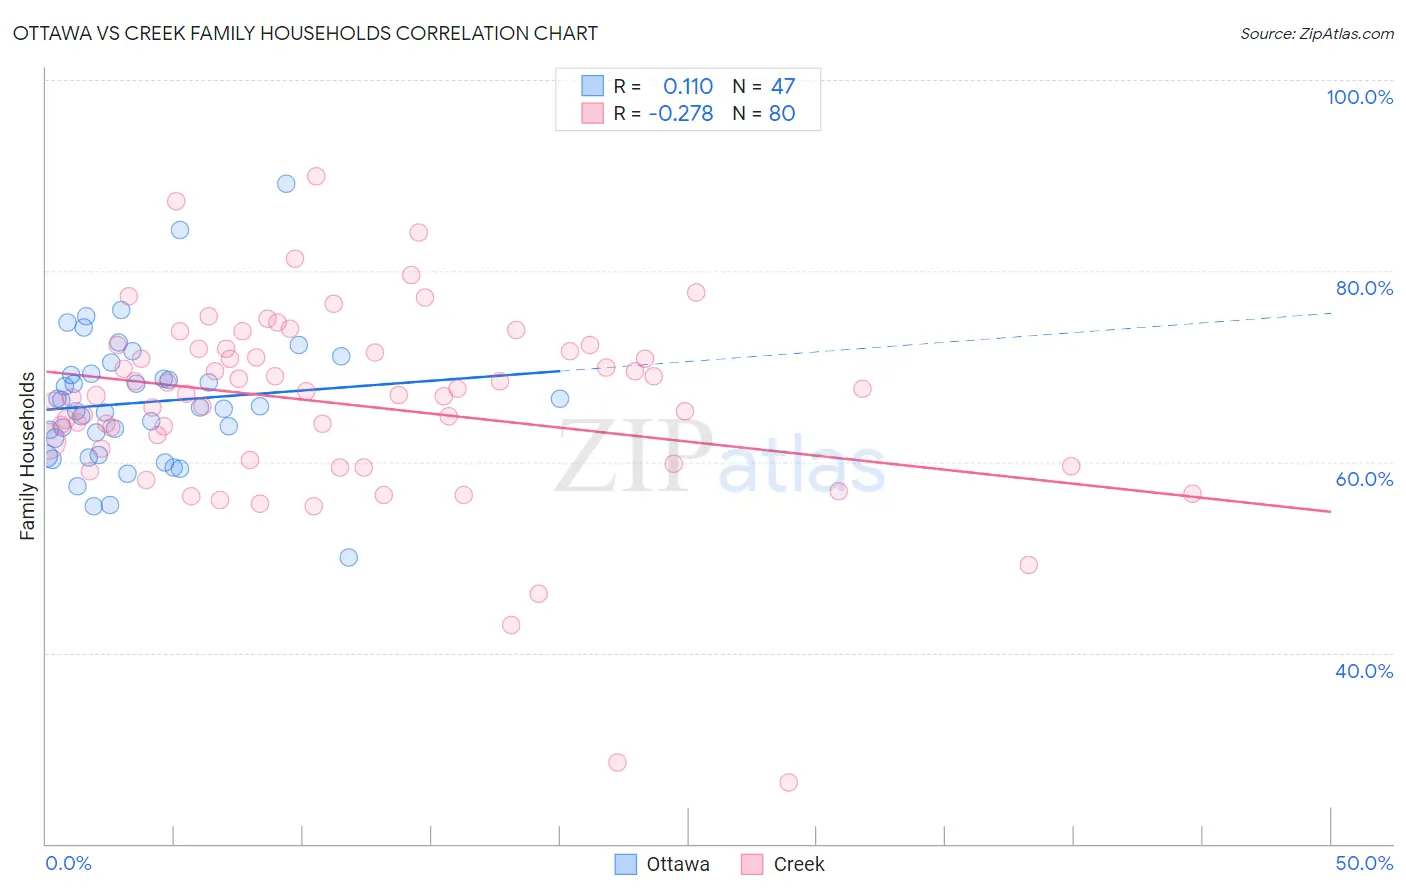
Ottawa vs Creek Family Households Correlation Chart
The statistical analysis conducted on geographies consisting of 49,944,420 people shows a poor positive correlation between the proportion of Ottawa and percentage of family households in the United States with a correlation coefficient (R) of 0.110 and weighted average of 63.0%. Similarly, the statistical analysis conducted on geographies consisting of 178,433,480 people shows a weak negative correlation between the proportion of Creek and percentage of family households in the United States with a correlation coefficient (R) of -0.278 and weighted average of 64.2%, a difference of 1.8%.
Family Households Correlation Summary
| Measurement | Ottawa | Creek |
| Minimum | 50.0% | 26.4% |
| Maximum | 89.2% | 89.9% |
| Range | 39.2% | 63.5% |
| Mean | 66.2% | 66.0% |
| Median | 65.7% | 67.1% |
| Interquartile 25% (IQ1) | 60.7% | 60.8% |
| Interquartile 75% (IQ3) | 69.2% | 71.7% |
| Interquartile Range (IQR) | 8.6% | 10.9% |
| Standard Deviation (Sample) | 7.1% | 10.4% |
| Standard Deviation (Population) | 7.0% | 10.3% |
Similar Demographics by Family Households
Demographics Similar to Ottawa by Family Households
In terms of family households, the demographic groups most similar to Ottawa are Immigrants from Belgium (63.0%, a difference of 0.040%), Serbian (63.0%, a difference of 0.050%), Lumbee (63.1%, a difference of 0.070%), West Indian (63.1%, a difference of 0.070%), and Immigrants from Kazakhstan (63.1%, a difference of 0.080%).
| Demographics | Rating | Rank | Family Households |
| Immigrants | Austria | 0.3 /100 | #270 | Tragic 63.1% |
| Immigrants | Croatia | 0.3 /100 | #271 | Tragic 63.1% |
| Immigrants | Turkey | 0.3 /100 | #272 | Tragic 63.1% |
| Immigrants | Kazakhstan | 0.3 /100 | #273 | Tragic 63.1% |
| Lumbee | 0.3 /100 | #274 | Tragic 63.1% |
| West Indians | 0.3 /100 | #275 | Tragic 63.1% |
| Serbians | 0.3 /100 | #276 | Tragic 63.0% |
| Ottawa | 0.3 /100 | #277 | Tragic 63.0% |
| Immigrants | Belgium | 0.2 /100 | #278 | Tragic 63.0% |
| Immigrants | Yemen | 0.2 /100 | #279 | Tragic 63.0% |
| Immigrants | Bulgaria | 0.2 /100 | #280 | Tragic 63.0% |
| Estonians | 0.2 /100 | #281 | Tragic 62.9% |
| New Zealanders | 0.1 /100 | #282 | Tragic 62.9% |
| Immigrants | Denmark | 0.1 /100 | #283 | Tragic 62.9% |
| Australians | 0.1 /100 | #284 | Tragic 62.8% |
Demographics Similar to Creek by Family Households
In terms of family households, the demographic groups most similar to Creek are Immigrants from Honduras (64.2%, a difference of 0.010%), Immigrants from Trinidad and Tobago (64.2%, a difference of 0.010%), Ukrainian (64.2%, a difference of 0.010%), Puerto Rican (64.2%, a difference of 0.010%), and Immigrants from Ukraine (64.2%, a difference of 0.060%).
| Demographics | Rating | Rank | Family Households |
| Vietnamese | 43.6 /100 | #176 | Average 64.2% |
| Immigrants | Micronesia | 42.3 /100 | #177 | Average 64.2% |
| Jamaicans | 40.6 /100 | #178 | Average 64.2% |
| Immigrants | Ukraine | 38.2 /100 | #179 | Fair 64.2% |
| Immigrants | Honduras | 35.0 /100 | #180 | Fair 64.2% |
| Immigrants | Trinidad and Tobago | 34.9 /100 | #181 | Fair 64.2% |
| Ukrainians | 34.6 /100 | #182 | Fair 64.2% |
| Creek | 34.1 /100 | #183 | Fair 64.2% |
| Puerto Ricans | 33.4 /100 | #184 | Fair 64.2% |
| Immigrants | Iran | 30.4 /100 | #185 | Fair 64.1% |
| Spanish Americans | 30.1 /100 | #186 | Fair 64.1% |
| Northern Europeans | 28.2 /100 | #187 | Fair 64.1% |
| Paraguayans | 26.7 /100 | #188 | Fair 64.1% |
| Immigrants | Western Asia | 25.3 /100 | #189 | Fair 64.1% |
| Zimbabweans | 24.7 /100 | #190 | Fair 64.1% |