German vs Immigrants from Canada Male Disability
COMPARE
German
Immigrants from Canada
Male Disability
Male Disability Comparison
Germans
Immigrants from Canada
12.7%
MALE DISABILITY
0.0/ 100
METRIC RATING
283rd/ 347
METRIC RANK
11.9%
MALE DISABILITY
1.6/ 100
METRIC RATING
234th/ 347
METRIC RANK
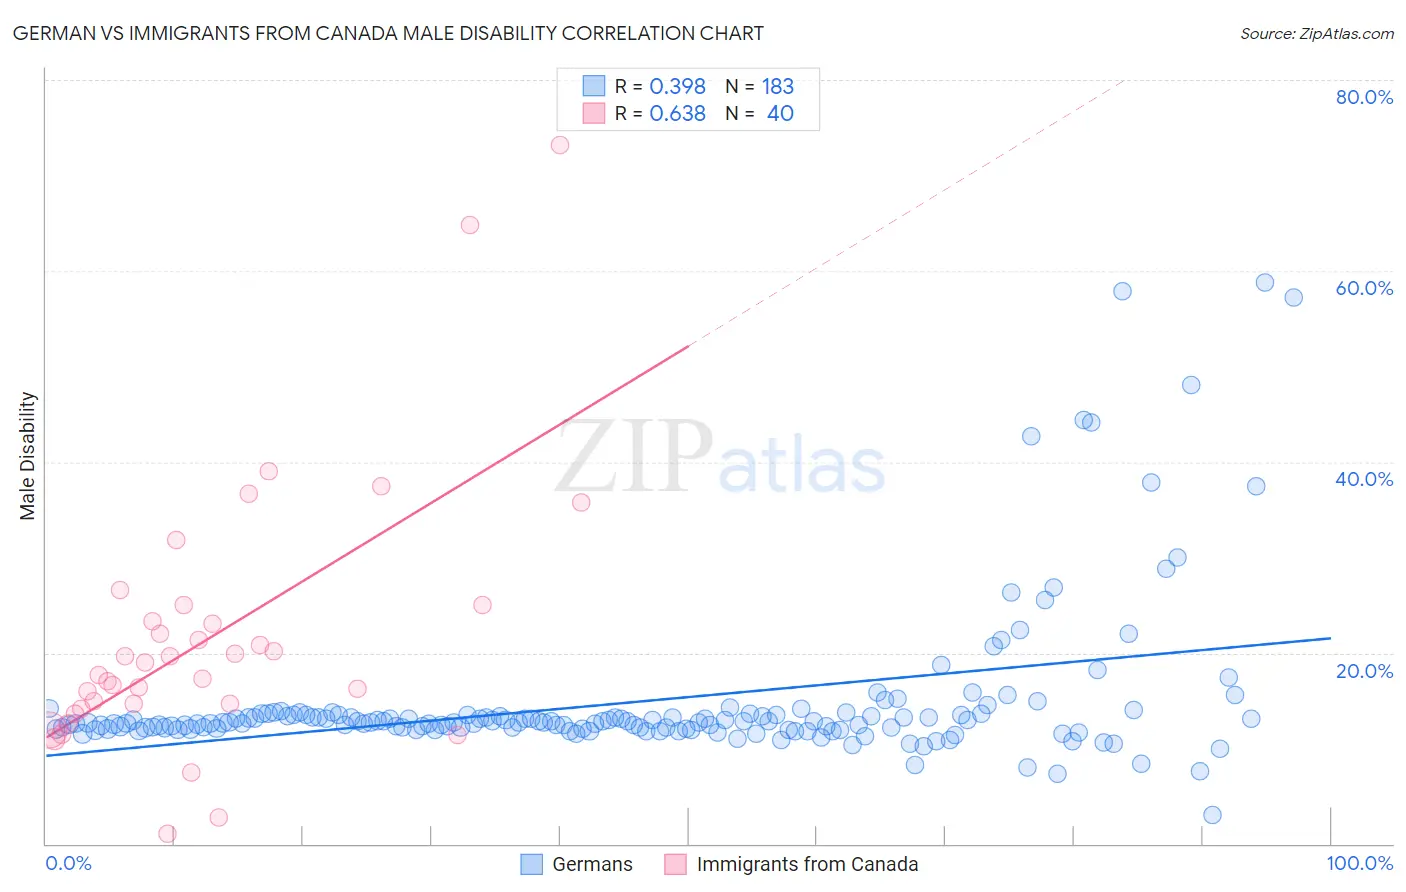
German vs Immigrants from Canada Male Disability Correlation Chart
The statistical analysis conducted on geographies consisting of 580,769,413 people shows a mild positive correlation between the proportion of Germans and percentage of males with a disability in the United States with a correlation coefficient (R) of 0.398 and weighted average of 12.7%. Similarly, the statistical analysis conducted on geographies consisting of 459,334,704 people shows a significant positive correlation between the proportion of Immigrants from Canada and percentage of males with a disability in the United States with a correlation coefficient (R) of 0.638 and weighted average of 11.9%, a difference of 7.2%.
Male Disability Correlation Summary
| Measurement | German | Immigrants from Canada |
| Minimum | 3.0% | 1.0% |
| Maximum | 58.8% | 73.2% |
| Range | 55.8% | 72.2% |
| Mean | 14.9% | 21.6% |
| Median | 12.7% | 18.4% |
| Interquartile 25% (IQ1) | 12.1% | 14.4% |
| Interquartile 75% (IQ3) | 13.5% | 24.1% |
| Interquartile Range (IQR) | 1.4% | 9.8% |
| Standard Deviation (Sample) | 8.3% | 14.0% |
| Standard Deviation (Population) | 8.3% | 13.8% |
Similar Demographics by Male Disability
Demographics Similar to Germans by Male Disability
In terms of male disability, the demographic groups most similar to Germans are Irish (12.7%, a difference of 0.010%), Sioux (12.7%, a difference of 0.070%), Dutch (12.7%, a difference of 0.12%), Slovak (12.7%, a difference of 0.17%), and Spanish (12.7%, a difference of 0.27%).
| Demographics | Rating | Rank | Male Disability |
| Africans | 0.0 /100 | #276 | Tragic 12.6% |
| Finns | 0.0 /100 | #277 | Tragic 12.6% |
| Central American Indians | 0.0 /100 | #278 | Tragic 12.7% |
| Slovaks | 0.0 /100 | #279 | Tragic 12.7% |
| Dutch | 0.0 /100 | #280 | Tragic 12.7% |
| Sioux | 0.0 /100 | #281 | Tragic 12.7% |
| Irish | 0.0 /100 | #282 | Tragic 12.7% |
| Germans | 0.0 /100 | #283 | Tragic 12.7% |
| Spanish | 0.0 /100 | #284 | Tragic 12.7% |
| Welsh | 0.0 /100 | #285 | Tragic 12.7% |
| Scottish | 0.0 /100 | #286 | Tragic 12.8% |
| Cape Verdeans | 0.0 /100 | #287 | Tragic 12.8% |
| Yup'ik | 0.0 /100 | #288 | Tragic 12.8% |
| Immigrants | Cabo Verde | 0.0 /100 | #289 | Tragic 12.8% |
| Pima | 0.0 /100 | #290 | Tragic 12.8% |
Demographics Similar to Immigrants from Canada by Male Disability
In terms of male disability, the demographic groups most similar to Immigrants from Canada are Mexican (11.8%, a difference of 0.070%), Malaysian (11.8%, a difference of 0.11%), Immigrants from North America (11.9%, a difference of 0.13%), Dominican (11.8%, a difference of 0.18%), and U.S. Virgin Islander (11.9%, a difference of 0.26%).
| Demographics | Rating | Rank | Male Disability |
| Austrians | 2.5 /100 | #227 | Tragic 11.8% |
| Hispanics or Latinos | 2.3 /100 | #228 | Tragic 11.8% |
| Bermudans | 2.3 /100 | #229 | Tragic 11.8% |
| Croatians | 2.1 /100 | #230 | Tragic 11.8% |
| Dominicans | 1.8 /100 | #231 | Tragic 11.8% |
| Malaysians | 1.8 /100 | #232 | Tragic 11.8% |
| Mexicans | 1.7 /100 | #233 | Tragic 11.8% |
| Immigrants | Canada | 1.6 /100 | #234 | Tragic 11.9% |
| Immigrants | North America | 1.5 /100 | #235 | Tragic 11.9% |
| U.S. Virgin Islanders | 1.3 /100 | #236 | Tragic 11.9% |
| Carpatho Rusyns | 1.3 /100 | #237 | Tragic 11.9% |
| Yugoslavians | 1.2 /100 | #238 | Tragic 11.9% |
| Italians | 1.2 /100 | #239 | Tragic 11.9% |
| Czechs | 1.1 /100 | #240 | Tragic 11.9% |
| Bahamians | 1.1 /100 | #241 | Tragic 11.9% |