German vs Ukrainian Male Disability
COMPARE
German
Ukrainian
Male Disability
Male Disability Comparison
Germans
Ukrainians
12.7%
MALE DISABILITY
0.0/ 100
METRIC RATING
283rd/ 347
METRIC RANK
11.5%
MALE DISABILITY
10.6/ 100
METRIC RATING
206th/ 347
METRIC RANK
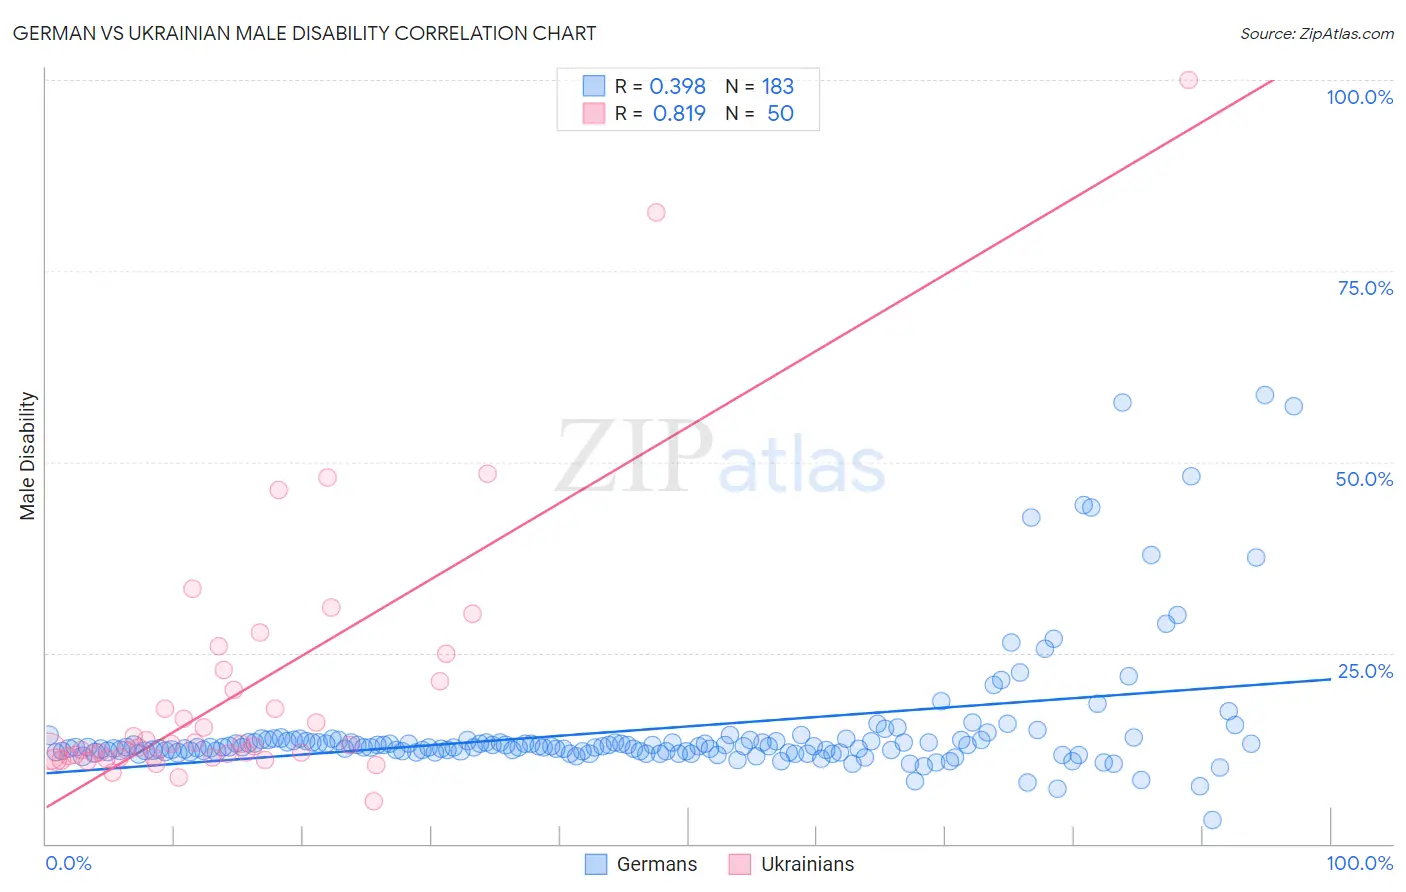
German vs Ukrainian Male Disability Correlation Chart
The statistical analysis conducted on geographies consisting of 580,769,413 people shows a mild positive correlation between the proportion of Germans and percentage of males with a disability in the United States with a correlation coefficient (R) of 0.398 and weighted average of 12.7%. Similarly, the statistical analysis conducted on geographies consisting of 448,602,749 people shows a very strong positive correlation between the proportion of Ukrainians and percentage of males with a disability in the United States with a correlation coefficient (R) of 0.819 and weighted average of 11.5%, a difference of 10.1%.
Male Disability Correlation Summary
| Measurement | German | Ukrainian |
| Minimum | 3.0% | 5.6% |
| Maximum | 58.8% | 100.0% |
| Range | 55.8% | 94.4% |
| Mean | 14.9% | 20.0% |
| Median | 12.7% | 12.8% |
| Interquartile 25% (IQ1) | 12.1% | 11.3% |
| Interquartile 75% (IQ3) | 13.5% | 21.2% |
| Interquartile Range (IQR) | 1.4% | 9.9% |
| Standard Deviation (Sample) | 8.3% | 17.8% |
| Standard Deviation (Population) | 8.3% | 17.6% |
Similar Demographics by Male Disability
Demographics Similar to Germans by Male Disability
In terms of male disability, the demographic groups most similar to Germans are Irish (12.7%, a difference of 0.010%), Sioux (12.7%, a difference of 0.070%), Dutch (12.7%, a difference of 0.12%), Slovak (12.7%, a difference of 0.17%), and Spanish (12.7%, a difference of 0.27%).
| Demographics | Rating | Rank | Male Disability |
| Africans | 0.0 /100 | #276 | Tragic 12.6% |
| Finns | 0.0 /100 | #277 | Tragic 12.6% |
| Central American Indians | 0.0 /100 | #278 | Tragic 12.7% |
| Slovaks | 0.0 /100 | #279 | Tragic 12.7% |
| Dutch | 0.0 /100 | #280 | Tragic 12.7% |
| Sioux | 0.0 /100 | #281 | Tragic 12.7% |
| Irish | 0.0 /100 | #282 | Tragic 12.7% |
| Germans | 0.0 /100 | #283 | Tragic 12.7% |
| Spanish | 0.0 /100 | #284 | Tragic 12.7% |
| Welsh | 0.0 /100 | #285 | Tragic 12.7% |
| Scottish | 0.0 /100 | #286 | Tragic 12.8% |
| Cape Verdeans | 0.0 /100 | #287 | Tragic 12.8% |
| Yup'ik | 0.0 /100 | #288 | Tragic 12.8% |
| Immigrants | Cabo Verde | 0.0 /100 | #289 | Tragic 12.8% |
| Pima | 0.0 /100 | #290 | Tragic 12.8% |
Demographics Similar to Ukrainians by Male Disability
In terms of male disability, the demographic groups most similar to Ukrainians are Immigrants from Cambodia (11.5%, a difference of 0.010%), Serbian (11.5%, a difference of 0.010%), Jamaican (11.5%, a difference of 0.030%), Immigrants from Somalia (11.5%, a difference of 0.030%), and Icelander (11.6%, a difference of 0.070%).
| Demographics | Rating | Rank | Male Disability |
| Lebanese | 15.4 /100 | #199 | Poor 11.5% |
| Immigrants | Iraq | 13.0 /100 | #200 | Poor 11.5% |
| Immigrants | Panama | 13.0 /100 | #201 | Poor 11.5% |
| Immigrants | Mexico | 12.6 /100 | #202 | Poor 11.5% |
| Jamaicans | 10.9 /100 | #203 | Poor 11.5% |
| Immigrants | Cambodia | 10.8 /100 | #204 | Poor 11.5% |
| Serbians | 10.7 /100 | #205 | Poor 11.5% |
| Ukrainians | 10.6 /100 | #206 | Poor 11.5% |
| Immigrants | Somalia | 10.4 /100 | #207 | Poor 11.5% |
| Icelanders | 10.1 /100 | #208 | Poor 11.6% |
| Spanish American Indians | 10.1 /100 | #209 | Poor 11.6% |
| Ute | 9.4 /100 | #210 | Tragic 11.6% |
| Immigrants | Thailand | 8.4 /100 | #211 | Tragic 11.6% |
| Immigrants | Scotland | 8.2 /100 | #212 | Tragic 11.6% |
| Mexican American Indians | 7.8 /100 | #213 | Tragic 11.6% |