German vs Nepalese Male Disability
COMPARE
German
Nepalese
Male Disability
Male Disability Comparison
Germans
Nepalese
12.7%
MALE DISABILITY
0.0/ 100
METRIC RATING
283rd/ 347
METRIC RANK
12.2%
MALE DISABILITY
0.2/ 100
METRIC RATING
264th/ 347
METRIC RANK
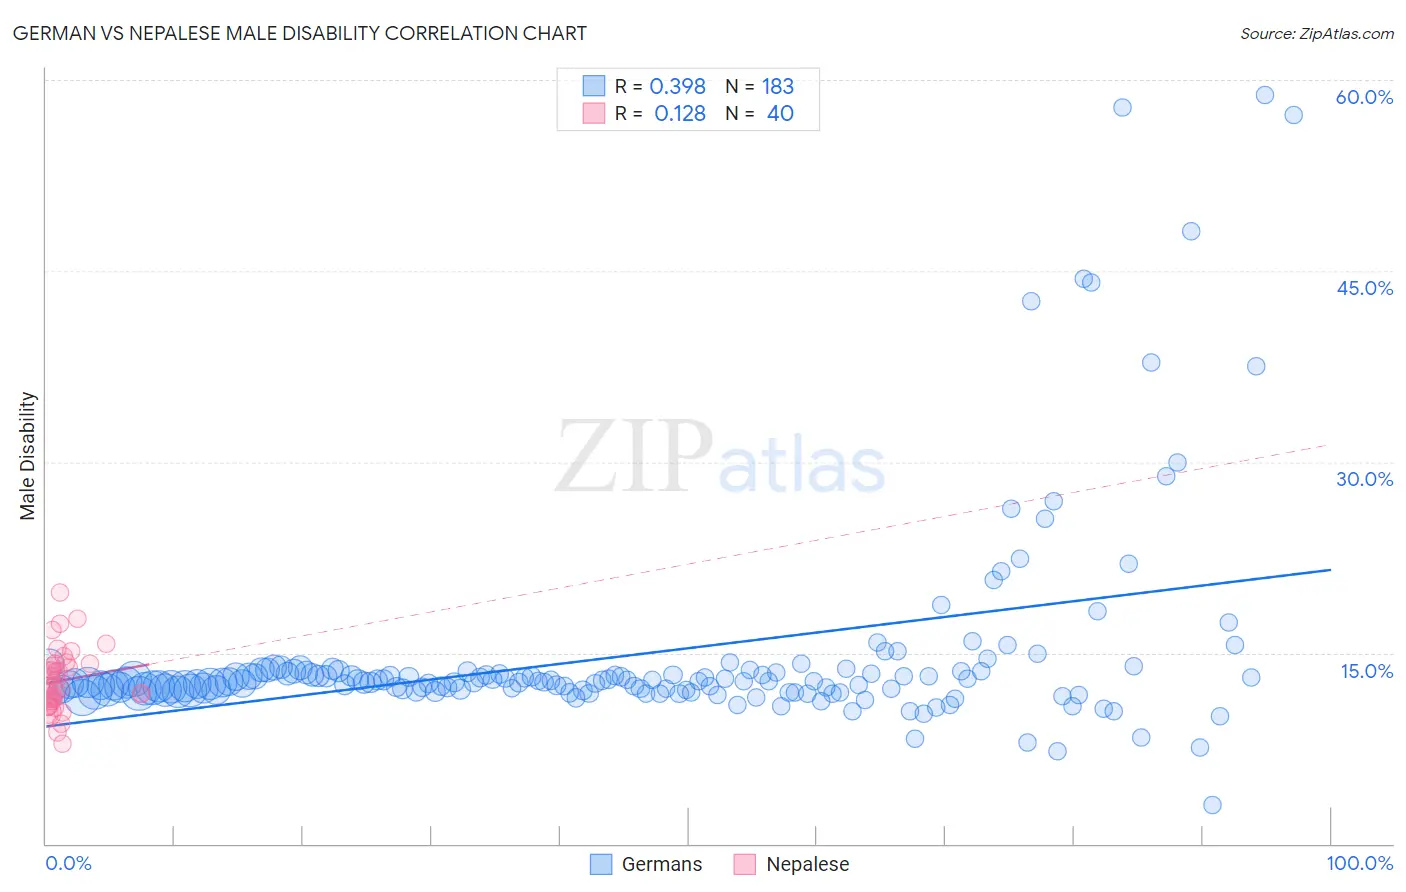
German vs Nepalese Male Disability Correlation Chart
The statistical analysis conducted on geographies consisting of 580,769,413 people shows a mild positive correlation between the proportion of Germans and percentage of males with a disability in the United States with a correlation coefficient (R) of 0.398 and weighted average of 12.7%. Similarly, the statistical analysis conducted on geographies consisting of 24,521,755 people shows a poor positive correlation between the proportion of Nepalese and percentage of males with a disability in the United States with a correlation coefficient (R) of 0.128 and weighted average of 12.2%, a difference of 4.2%.
Male Disability Correlation Summary
| Measurement | German | Nepalese |
| Minimum | 3.0% | 7.8% |
| Maximum | 58.8% | 19.7% |
| Range | 55.8% | 11.9% |
| Mean | 14.9% | 12.8% |
| Median | 12.7% | 12.4% |
| Interquartile 25% (IQ1) | 12.1% | 11.1% |
| Interquartile 75% (IQ3) | 13.5% | 14.2% |
| Interquartile Range (IQR) | 1.4% | 3.1% |
| Standard Deviation (Sample) | 8.3% | 2.5% |
| Standard Deviation (Population) | 8.3% | 2.5% |
Demographics Similar to Germans and Nepalese by Male Disability
In terms of male disability, the demographic groups most similar to Germans are Irish (12.7%, a difference of 0.010%), Sioux (12.7%, a difference of 0.070%), Dutch (12.7%, a difference of 0.12%), Slovak (12.7%, a difference of 0.17%), and Central American Indian (12.7%, a difference of 0.32%). Similarly, the demographic groups most similar to Nepalese are Canadian (12.2%, a difference of 0.030%), Immigrants from Portugal (12.3%, a difference of 0.46%), Hawaiian (12.3%, a difference of 0.47%), Immigrants from Germany (12.3%, a difference of 0.52%), and Portuguese (12.3%, a difference of 0.65%).
| Demographics | Rating | Rank | Male Disability |
| Canadians | 0.2 /100 | #263 | Tragic 12.2% |
| Nepalese | 0.2 /100 | #264 | Tragic 12.2% |
| Immigrants | Portugal | 0.1 /100 | #265 | Tragic 12.3% |
| Hawaiians | 0.1 /100 | #266 | Tragic 12.3% |
| Immigrants | Germany | 0.1 /100 | #267 | Tragic 12.3% |
| Portuguese | 0.1 /100 | #268 | Tragic 12.3% |
| Czechoslovakians | 0.1 /100 | #269 | Tragic 12.3% |
| Spaniards | 0.1 /100 | #270 | Tragic 12.3% |
| Scandinavians | 0.1 /100 | #271 | Tragic 12.3% |
| Hmong | 0.0 /100 | #272 | Tragic 12.5% |
| Native Hawaiians | 0.0 /100 | #273 | Tragic 12.5% |
| Hopi | 0.0 /100 | #274 | Tragic 12.5% |
| Fijians | 0.0 /100 | #275 | Tragic 12.6% |
| Africans | 0.0 /100 | #276 | Tragic 12.6% |
| Finns | 0.0 /100 | #277 | Tragic 12.6% |
| Central American Indians | 0.0 /100 | #278 | Tragic 12.7% |
| Slovaks | 0.0 /100 | #279 | Tragic 12.7% |
| Dutch | 0.0 /100 | #280 | Tragic 12.7% |
| Sioux | 0.0 /100 | #281 | Tragic 12.7% |
| Irish | 0.0 /100 | #282 | Tragic 12.7% |
| Germans | 0.0 /100 | #283 | Tragic 12.7% |