Immigrants from Canada vs Chickasaw Male Disability
COMPARE
Immigrants from Canada
Chickasaw
Male Disability
Male Disability Comparison
Immigrants from Canada
Chickasaw
11.9%
MALE DISABILITY
1.6/ 100
METRIC RATING
234th/ 347
METRIC RANK
15.1%
MALE DISABILITY
0.0/ 100
METRIC RATING
339th/ 347
METRIC RANK
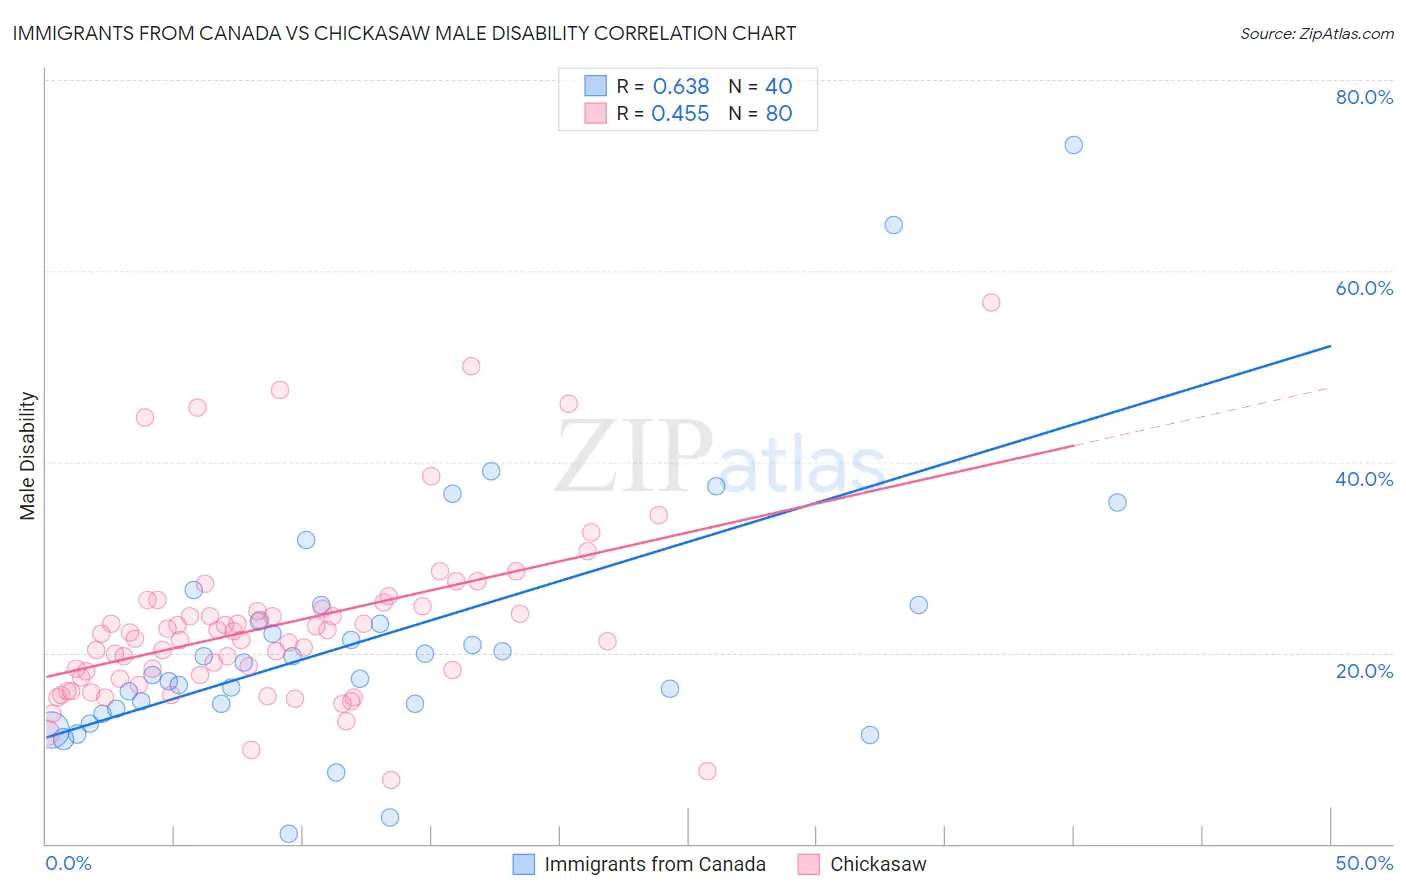
Immigrants from Canada vs Chickasaw Male Disability Correlation Chart
The statistical analysis conducted on geographies consisting of 459,334,704 people shows a significant positive correlation between the proportion of Immigrants from Canada and percentage of males with a disability in the United States with a correlation coefficient (R) of 0.638 and weighted average of 11.9%. Similarly, the statistical analysis conducted on geographies consisting of 147,685,248 people shows a moderate positive correlation between the proportion of Chickasaw and percentage of males with a disability in the United States with a correlation coefficient (R) of 0.455 and weighted average of 15.1%, a difference of 27.6%.
Male Disability Correlation Summary
| Measurement | Immigrants from Canada | Chickasaw |
| Minimum | 1.0% | 6.7% |
| Maximum | 73.2% | 56.8% |
| Range | 72.2% | 50.1% |
| Mean | 21.6% | 22.9% |
| Median | 18.4% | 21.7% |
| Interquartile 25% (IQ1) | 14.4% | 17.4% |
| Interquartile 75% (IQ3) | 24.1% | 24.7% |
| Interquartile Range (IQR) | 9.8% | 7.4% |
| Standard Deviation (Sample) | 14.0% | 9.2% |
| Standard Deviation (Population) | 13.8% | 9.1% |
Similar Demographics by Male Disability
Demographics Similar to Immigrants from Canada by Male Disability
In terms of male disability, the demographic groups most similar to Immigrants from Canada are Mexican (11.8%, a difference of 0.070%), Malaysian (11.8%, a difference of 0.11%), Immigrants from North America (11.9%, a difference of 0.13%), Dominican (11.8%, a difference of 0.18%), and U.S. Virgin Islander (11.9%, a difference of 0.26%).
| Demographics | Rating | Rank | Male Disability |
| Austrians | 2.5 /100 | #227 | Tragic 11.8% |
| Hispanics or Latinos | 2.3 /100 | #228 | Tragic 11.8% |
| Bermudans | 2.3 /100 | #229 | Tragic 11.8% |
| Croatians | 2.1 /100 | #230 | Tragic 11.8% |
| Dominicans | 1.8 /100 | #231 | Tragic 11.8% |
| Malaysians | 1.8 /100 | #232 | Tragic 11.8% |
| Mexicans | 1.7 /100 | #233 | Tragic 11.8% |
| Immigrants | Canada | 1.6 /100 | #234 | Tragic 11.9% |
| Immigrants | North America | 1.5 /100 | #235 | Tragic 11.9% |
| U.S. Virgin Islanders | 1.3 /100 | #236 | Tragic 11.9% |
| Carpatho Rusyns | 1.3 /100 | #237 | Tragic 11.9% |
| Yugoslavians | 1.2 /100 | #238 | Tragic 11.9% |
| Italians | 1.2 /100 | #239 | Tragic 11.9% |
| Czechs | 1.1 /100 | #240 | Tragic 11.9% |
| Bahamians | 1.1 /100 | #241 | Tragic 11.9% |
Demographics Similar to Chickasaw by Male Disability
In terms of male disability, the demographic groups most similar to Chickasaw are Lumbee (15.2%, a difference of 0.74%), Pueblo (15.0%, a difference of 0.80%), Menominee (15.0%, a difference of 0.91%), Alaskan Athabascan (14.9%, a difference of 1.4%), and Choctaw (15.4%, a difference of 1.8%).
| Demographics | Rating | Rank | Male Disability |
| Seminole | 0.0 /100 | #332 | Tragic 14.7% |
| Yuman | 0.0 /100 | #333 | Tragic 14.7% |
| Cherokee | 0.0 /100 | #334 | Tragic 14.8% |
| Dutch West Indians | 0.0 /100 | #335 | Tragic 14.8% |
| Alaskan Athabascans | 0.0 /100 | #336 | Tragic 14.9% |
| Menominee | 0.0 /100 | #337 | Tragic 15.0% |
| Pueblo | 0.0 /100 | #338 | Tragic 15.0% |
| Chickasaw | 0.0 /100 | #339 | Tragic 15.1% |
| Lumbee | 0.0 /100 | #340 | Tragic 15.2% |
| Choctaw | 0.0 /100 | #341 | Tragic 15.4% |
| Kiowa | 0.0 /100 | #342 | Tragic 15.4% |
| Creek | 0.0 /100 | #343 | Tragic 15.5% |
| Puerto Ricans | 0.0 /100 | #344 | Tragic 15.6% |
| Tsimshian | 0.0 /100 | #345 | Tragic 15.6% |
| Colville | 0.0 /100 | #346 | Tragic 16.5% |