Zip Codes with the Highest Percentage of Population Employed in Installation, Maintenance & Repair in Greenwich, CT
RELATED REPORTS & OPTIONS
Installation, Maintenance & Repair
Greenwich
Compare Zip Codes
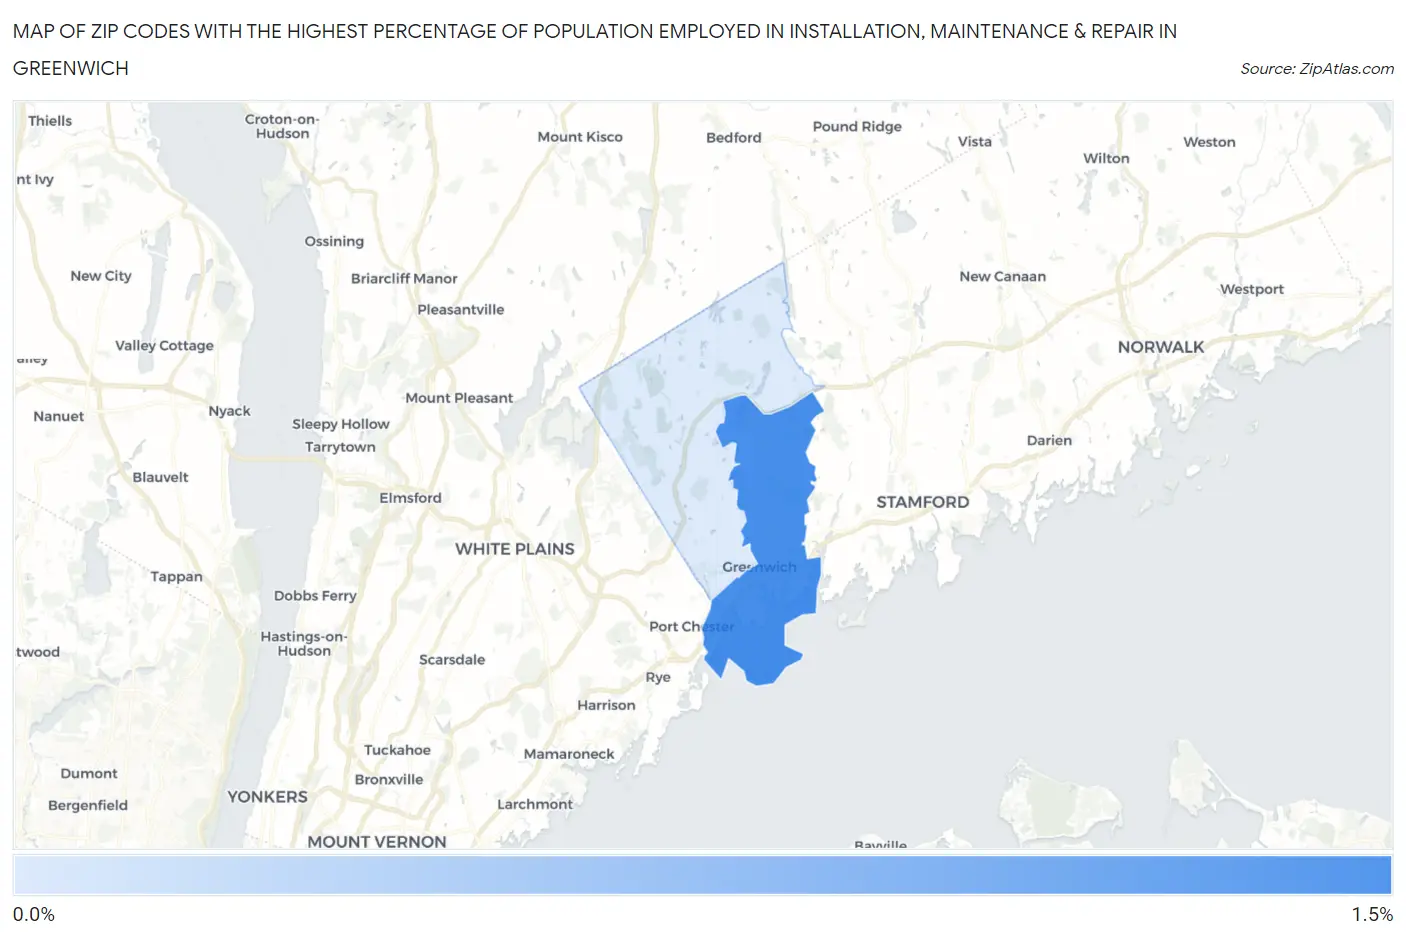
Map of Zip Codes with the Highest Percentage of Population Employed in Installation, Maintenance & Repair in Greenwich
0.40%
1.0%
Zip Codes with the Highest Percentage of Population Employed in Installation, Maintenance & Repair in Greenwich, CT
| Zip Code | % Employed | vs State | vs National | |
| 1. | 06830 | 1.0% | 2.5%(-1.44)#216 | 3.1%(-2.02)#25,794 |
| 2. | 06831 | 0.40% | 2.5%(-2.08)#246 | 3.1%(-2.67)#27,394 |
1
Common Questions
What are the Top Zip Codes with the Highest Percentage of Population Employed in Installation, Maintenance & Repair in Greenwich, CT?
Top Zip Codes with the Highest Percentage of Population Employed in Installation, Maintenance & Repair in Greenwich, CT are:
What zip code has the Highest Percentage of Population Employed in Installation, Maintenance & Repair in Greenwich, CT?
06830 has the Highest Percentage of Population Employed in Installation, Maintenance & Repair in Greenwich, CT with 1.0%.
What is the Percentage of Population Employed in Installation, Maintenance & Repair in Greenwich, CT?
Percentage of Population Employed in Installation, Maintenance & Repair in Greenwich is 0.64%.
What is the Percentage of Population Employed in Installation, Maintenance & Repair in Connecticut?
Percentage of Population Employed in Installation, Maintenance & Repair in Connecticut is 2.5%.
What is the Percentage of Population Employed in Installation, Maintenance & Repair in the United States?
Percentage of Population Employed in Installation, Maintenance & Repair in the United States is 3.1%.