Zip Codes with the Highest Percentage of Population Taking Taxi / Cab to Work in Greenwich, CT
RELATED REPORTS & OPTIONS
Taxi / Cab
Greenwich
Compare Zip Codes
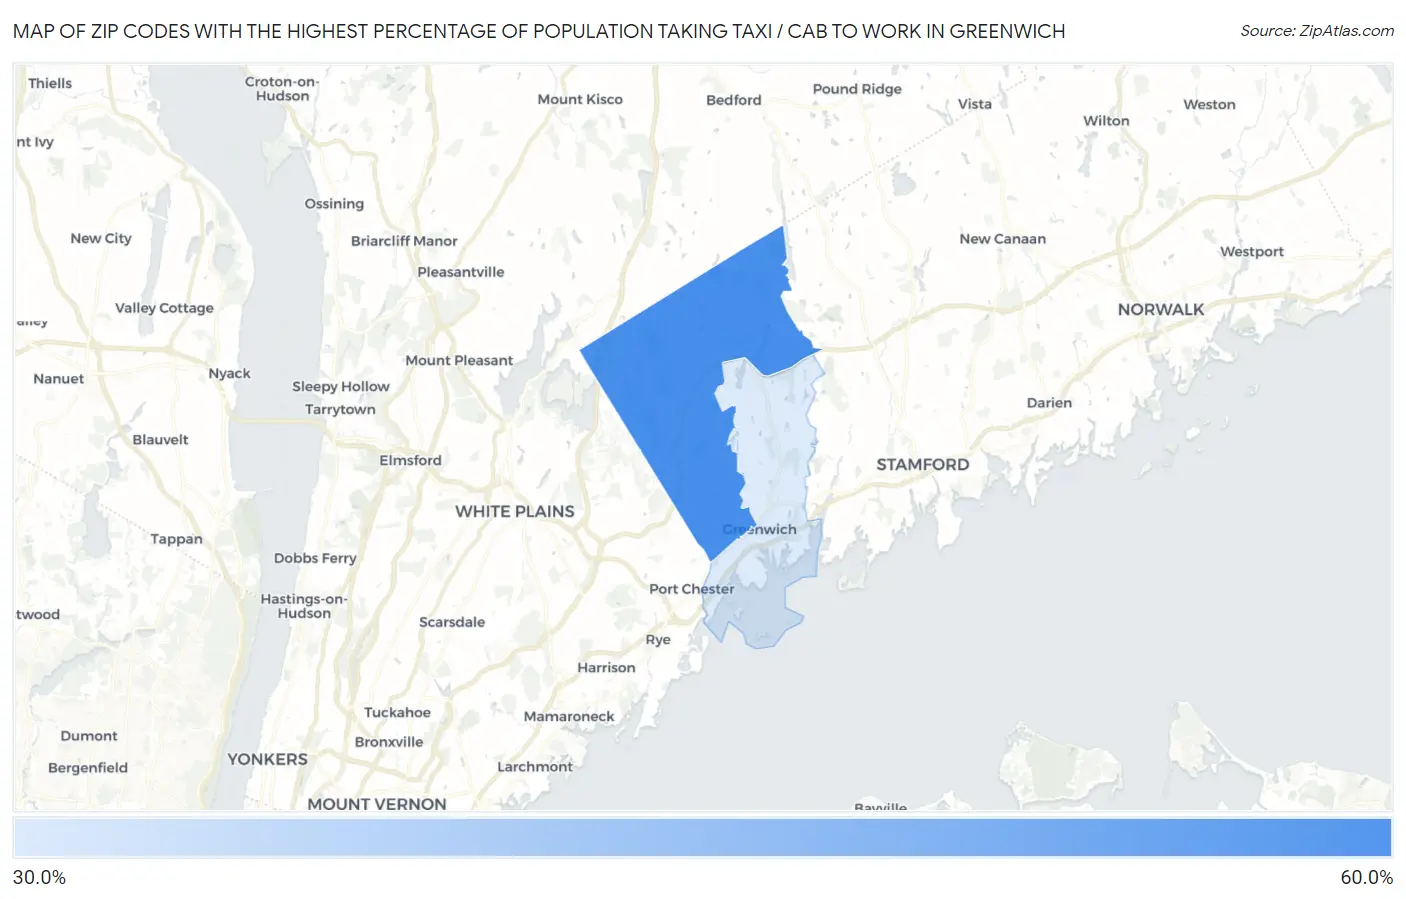
Map of Zip Codes with the Highest Percentage of Population Taking Taxi / Cab to Work in Greenwich
33.3%
58.4%
Zip Codes with the Highest Percentage of Population Taking Taxi / Cab to Work in Greenwich, CT
| Zip Code | % Take Taxi / Cab | vs State | vs National | |
| 1. | 06831 | 58.4% | 39.5%(+18.9)#11 | 38.2%(+20.2)#926 |
| 2. | 06830 | 33.3% | 39.5%(-6.20)#104 | 38.2%(-4.90)#9,663 |
1
Common Questions
What are the Top Zip Codes with the Highest Percentage of Population Taking Taxi / Cab to Work in Greenwich, CT?
Top Zip Codes with the Highest Percentage of Population Taking Taxi / Cab to Work in Greenwich, CT are:
What zip code has the Highest Percentage of Population Taking Taxi / Cab to Work in Greenwich, CT?
06831 has the Highest Percentage of Population Taking Taxi / Cab to Work in Greenwich, CT with 58.4%.
What is the Percentage of Population Taking Taxi / Cab to Work in Greenwich, CT?
Percentage of Population Taking Taxi / Cab to Work in Greenwich is 42.1%.
What is the Percentage of Population Taking Taxi / Cab to Work in Connecticut?
Percentage of Population Taking Taxi / Cab to Work in Connecticut is 39.5%.
What is the Percentage of Population Taking Taxi / Cab to Work in the United States?
Percentage of Population Taking Taxi / Cab to Work in the United States is 38.2%.