Zip Codes with the Highest Percentage of Population Employed in Mining, Quarrying, & Extraction in Covina, CA
RELATED REPORTS & OPTIONS
Mining, Quarrying, & Extraction
Covina
Compare Zip Codes
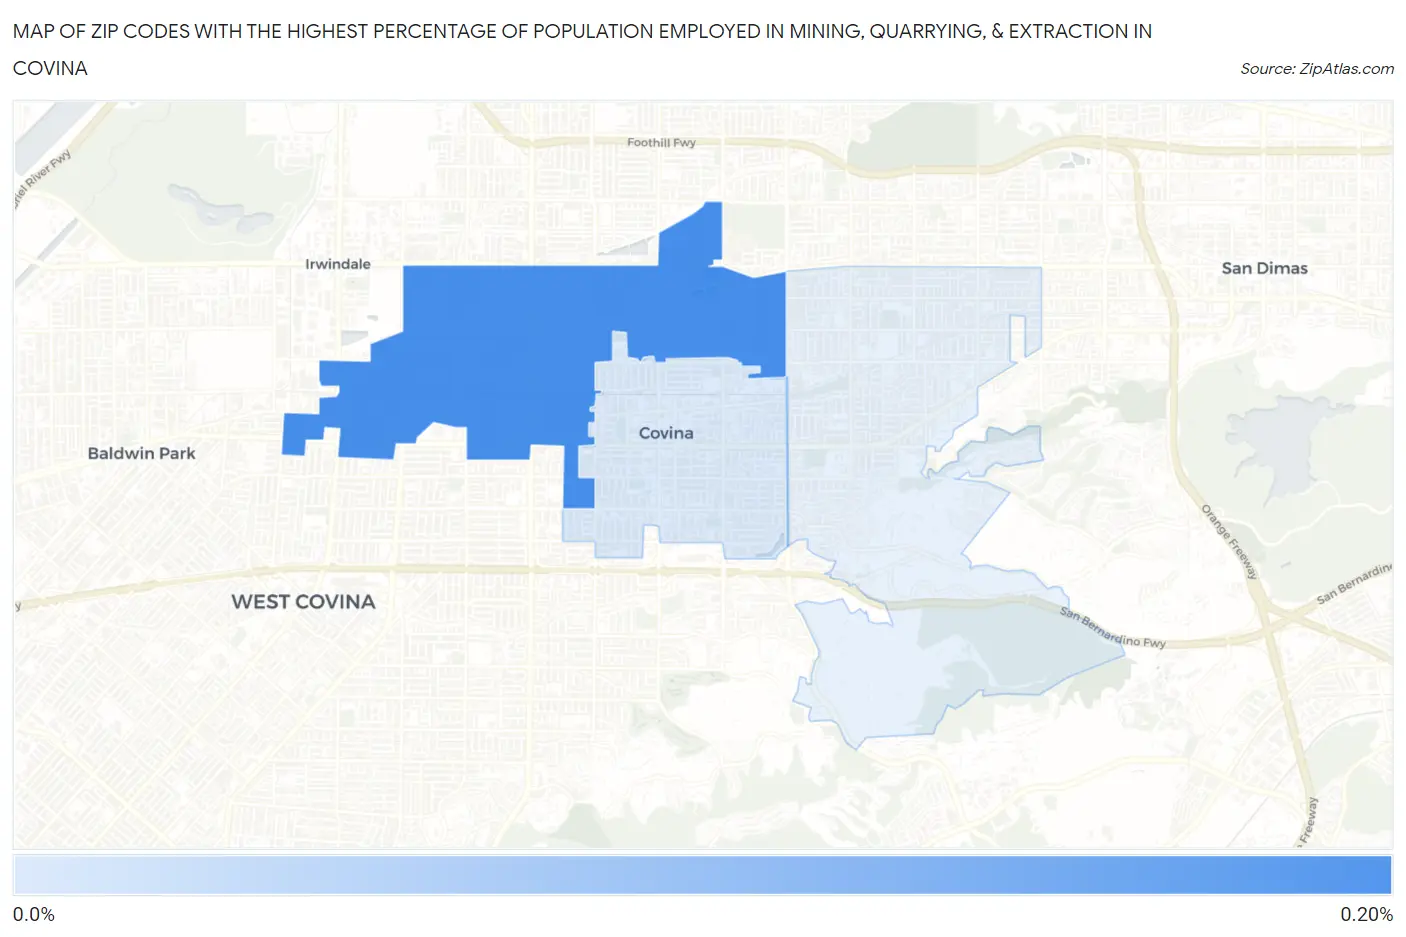
Map of Zip Codes with the Highest Percentage of Population Employed in Mining, Quarrying, & Extraction in Covina
0.079%
0.16%
Zip Codes with the Highest Percentage of Population Employed in Mining, Quarrying, & Extraction in Covina, CA
| Zip Code | % Employed | vs State | vs National | |
| 1. | 91722 | 0.16% | 0.12%(+0.036)#236 | 0.44%(-0.281)#9,986 |
| 2. | 91723 | 0.079% | 0.12%(-0.044)#357 | 0.44%(-0.361)#11,159 |
1
Common Questions
What are the Top Zip Codes with the Highest Percentage of Population Employed in Mining, Quarrying, & Extraction in Covina, CA?
Top Zip Codes with the Highest Percentage of Population Employed in Mining, Quarrying, & Extraction in Covina, CA are:
What zip code has the Highest Percentage of Population Employed in Mining, Quarrying, & Extraction in Covina, CA?
91722 has the Highest Percentage of Population Employed in Mining, Quarrying, & Extraction in Covina, CA with 0.16%.
What is the Percentage of Population Employed in Mining, Quarrying, & Extraction in Covina, CA?
Percentage of Population Employed in Mining, Quarrying, & Extraction in Covina is 0.033%.
What is the Percentage of Population Employed in Mining, Quarrying, & Extraction in California?
Percentage of Population Employed in Mining, Quarrying, & Extraction in California is 0.12%.
What is the Percentage of Population Employed in Mining, Quarrying, & Extraction in the United States?
Percentage of Population Employed in Mining, Quarrying, & Extraction in the United States is 0.44%.