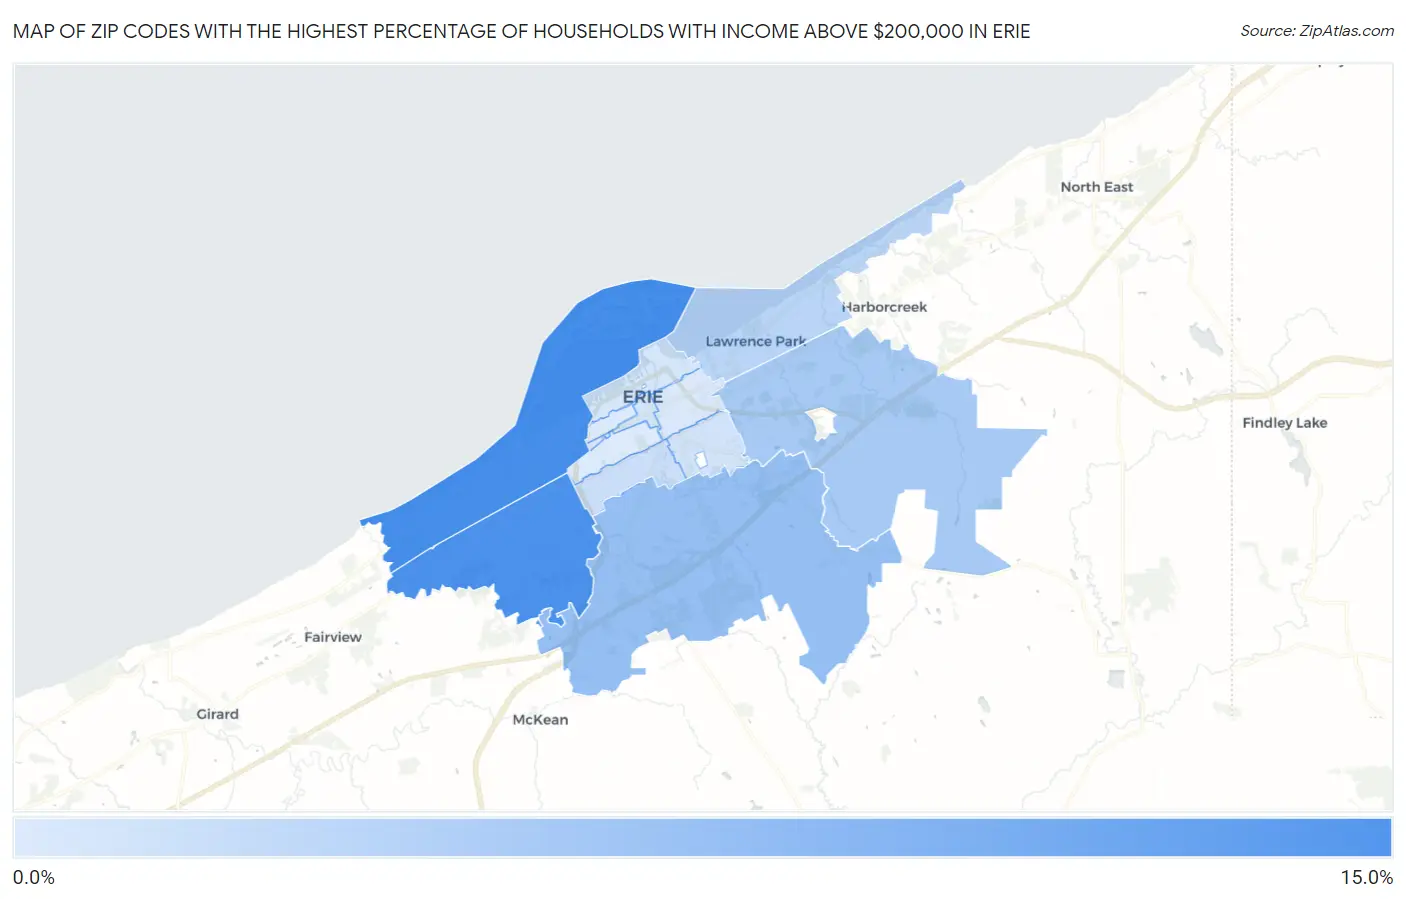
Zip Codes with the Highest Percentage of Households with Income Above $200,000 in Erie, PA
RELATED REPORTS & OPTIONS
Household Income | $200k+
Erie
Compare Zip Codes
Map of Zip Codes with the Highest Percentage of Households with Income Above $200,000 in Erie
1.2%
11.0%
Zip Codes with the Highest Percentage of Households with Income Above $200,000 in Erie, PA
| Zip Code | Households with Income > $200k | vs State | vs National | |
| 1. | 16505 | 11.0% | 10.2%(+0.800)#320 | 11.4%(-0.400)#7,413 |
| 2. | 16506 | 10.7% | 10.2%(+0.500)#338 | 11.4%(-0.700)#7,623 |
| 3. | 16509 | 5.7% | 10.2%(-4.50)#683 | 11.4%(-5.70)#14,072 |
| 4. | 16510 | 4.5% | 10.2%(-5.70)#821 | 11.4%(-6.90)#16,780 |
| 5. | 16511 | 3.4% | 10.2%(-6.80)#997 | 11.4%(-8.00)#19,740 |
| 6. | 16508 | 2.3% | 10.2%(-7.90)#1,185 | 11.4%(-9.10)#22,937 |
| 7. | 16504 | 1.9% | 10.2%(-8.30)#1,257 | 11.4%(-9.50)#24,068 |
| 8. | 16501 | 1.8% | 10.2%(-8.40)#1,272 | 11.4%(-9.60)#24,439 |
| 9. | 16507 | 1.7% | 10.2%(-8.50)#1,282 | 11.4%(-9.70)#24,592 |
| 10. | 16503 | 1.3% | 10.2%(-8.90)#1,341 | 11.4%(-10.1)#25,540 |
| 11. | 16502 | 1.2% | 10.2%(-9.00)#1,353 | 11.4%(-10.2)#25,763 |
1
Common Questions
What are the Top 10 Zip Codes with the Highest Percentage of Households with Income Above $200,000 in Erie, PA?
Top 10 Zip Codes with the Highest Percentage of Households with Income Above $200,000 in Erie, PA are:
What zip code has the Highest Percentage of Households with Income Above $200,000 in Erie, PA?
16505 has the Highest Percentage of Households with Income Above $200,000 in Erie, PA with 11.0%.
What is the Percentage of Households with Income Above $200,000 in Erie, PA?
Percentage of Households with Income Above $200,000 in Erie is 2.2%.
What is the Percentage of Households with Income Above $200,000 in Pennsylvania?
Percentage of Households with Income Above $200,000 in Pennsylvania is 10.2%.
What is the Percentage of Households with Income Above $200,000 in the United States?
Percentage of Households with Income Above $200,000 in the United States is 11.4%.