Zip Codes with the Highest Percentage of Households with Income Above $200,000 in Allentown, PA
RELATED REPORTS & OPTIONS
Household Income | $200k+
Allentown
Compare Zip Codes
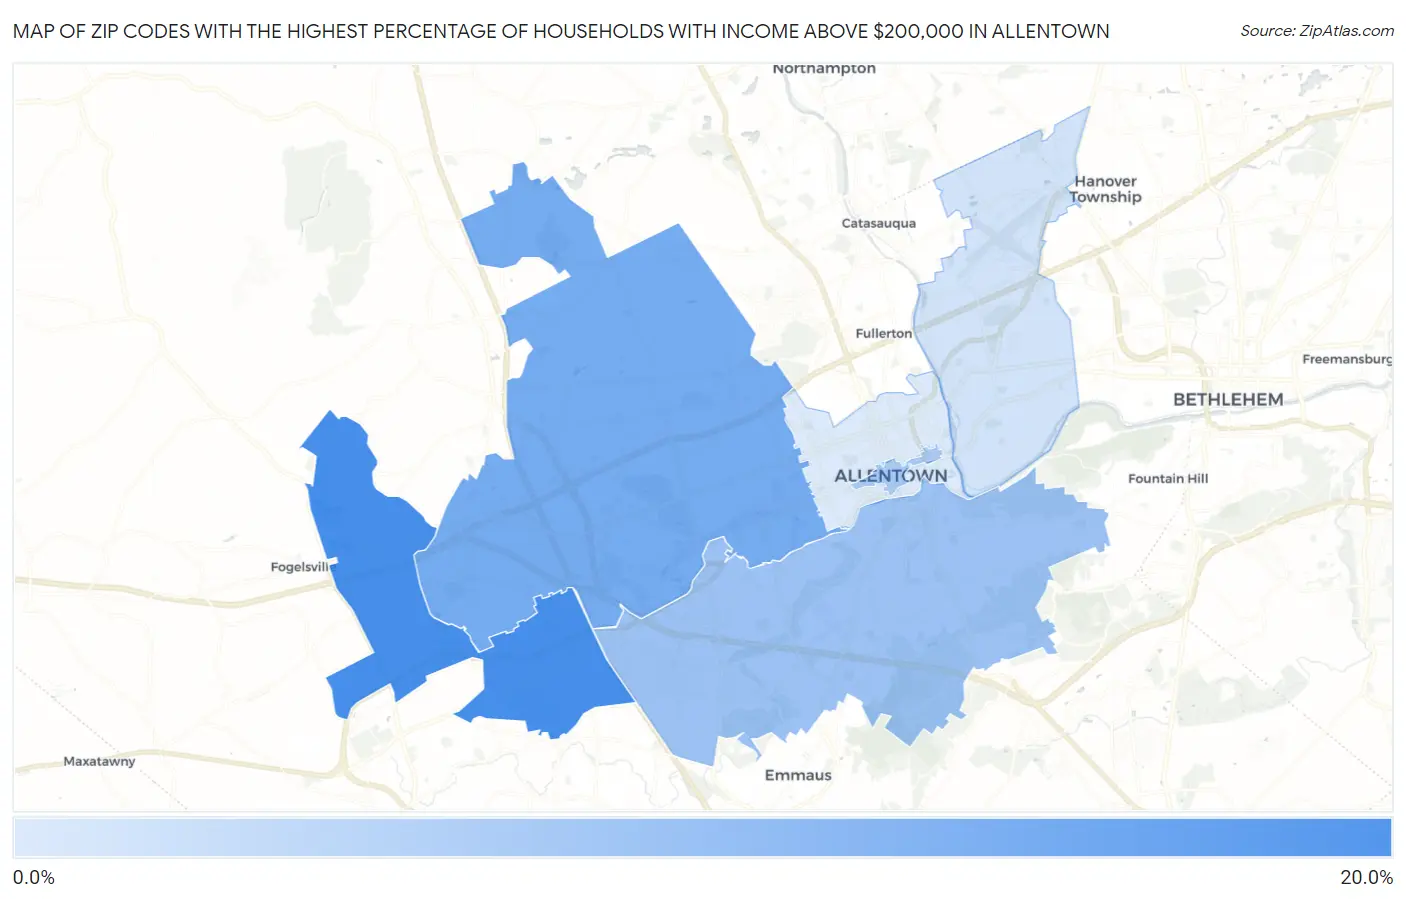
Map of Zip Codes with the Highest Percentage of Households with Income Above $200,000 in Allentown
0.90%
16.4%
Zip Codes with the Highest Percentage of Households with Income Above $200,000 in Allentown, PA
| Zip Code | Households with Income > $200k | vs State | vs National | |
| 1. | 18106 | 16.4% | 10.2%(+6.20)#186 | 11.4%(+5.00)#4,421 |
| 2. | 18104 | 11.3% | 10.2%(+1.10)#310 | 11.4%(-0.100)#7,143 |
| 3. | 18103 | 7.5% | 10.2%(-2.70)#526 | 11.4%(-3.90)#11,030 |
| 4. | 18101 | 5.8% | 10.2%(-4.40)#670 | 11.4%(-5.60)#13,906 |
| 5. | 18109 | 2.0% | 10.2%(-8.20)#1,243 | 11.4%(-9.40)#23,763 |
| 6. | 18102 | 0.90% | 10.2%(-9.30)#1,387 | 11.4%(-10.5)#26,361 |
1
Common Questions
What are the Top 5 Zip Codes with the Highest Percentage of Households with Income Above $200,000 in Allentown, PA?
Top 5 Zip Codes with the Highest Percentage of Households with Income Above $200,000 in Allentown, PA are:
What zip code has the Highest Percentage of Households with Income Above $200,000 in Allentown, PA?
18106 has the Highest Percentage of Households with Income Above $200,000 in Allentown, PA with 16.4%.
What is the Percentage of Households with Income Above $200,000 in Allentown, PA?
Percentage of Households with Income Above $200,000 in Allentown is 2.9%.
What is the Percentage of Households with Income Above $200,000 in Pennsylvania?
Percentage of Households with Income Above $200,000 in Pennsylvania is 10.2%.
What is the Percentage of Households with Income Above $200,000 in the United States?
Percentage of Households with Income Above $200,000 in the United States is 11.4%.