Zip Codes with the Highest Percentage of Households with Income Above $200,000 in Mckeesport, PA
RELATED REPORTS & OPTIONS
Household Income | $200k+
Mckeesport
Compare Zip Codes
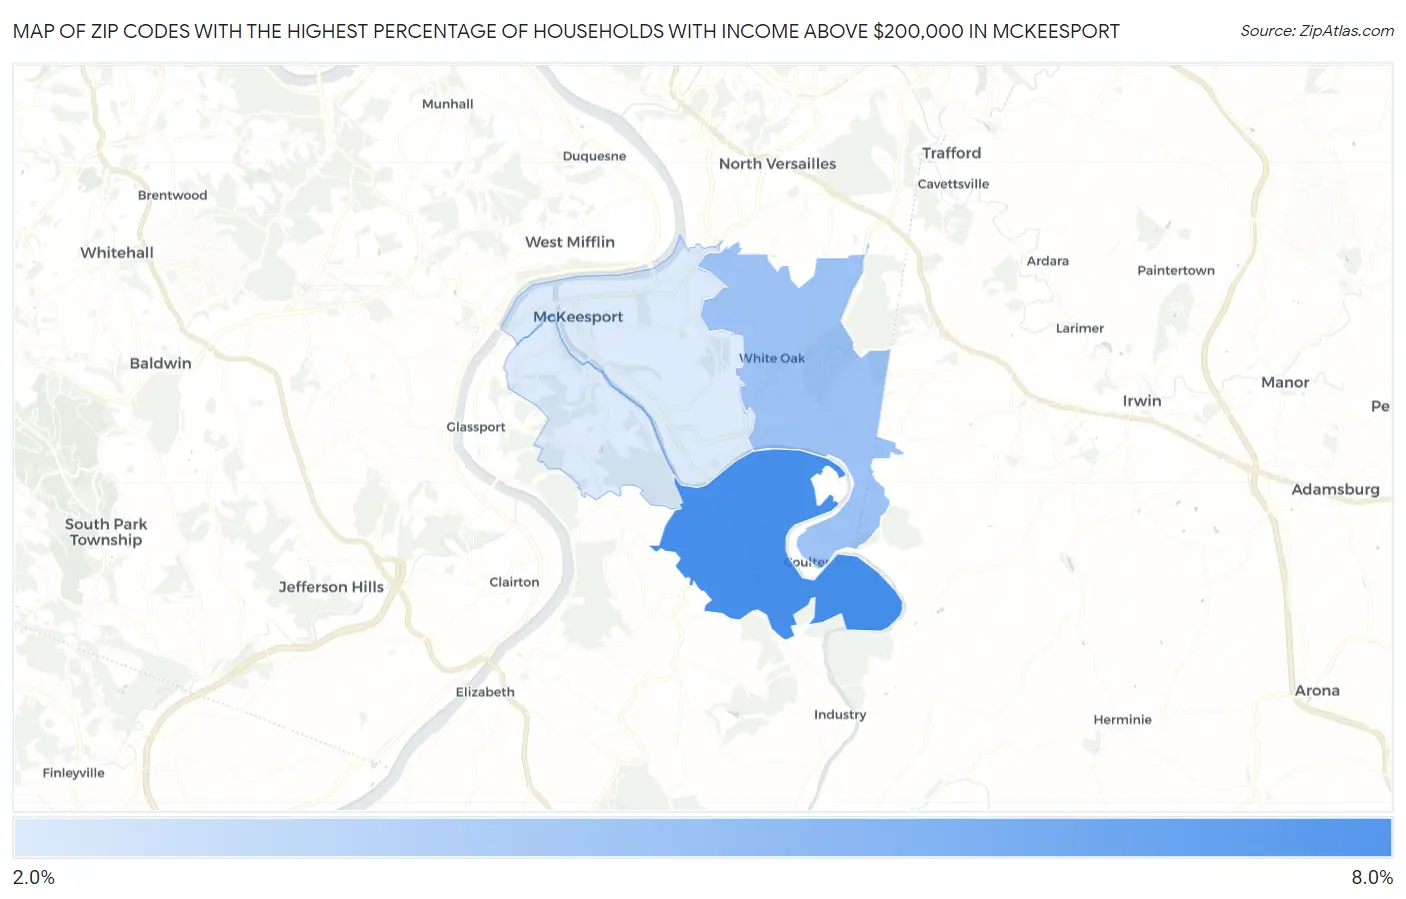
Map of Zip Codes with the Highest Percentage of Households with Income Above $200,000 in Mckeesport
2.3%
6.6%
Zip Codes with the Highest Percentage of Households with Income Above $200,000 in Mckeesport, PA
| Zip Code | Households with Income > $200k | vs State | vs National | |
| 1. | 15135 | 6.6% | 10.2%(-3.60)#598 | 11.4%(-4.80)#12,459 |
| 2. | 15131 | 4.2% | 10.2%(-6.00)#870 | 11.4%(-7.20)#17,625 |
| 3. | 15132 | 2.3% | 10.2%(-7.90)#1,183 | 11.4%(-9.10)#22,924 |
| 4. | 15133 | 2.3% | 10.2%(-7.90)#1,191 | 11.4%(-9.10)#22,977 |
1
Common Questions
What are the Top 3 Zip Codes with the Highest Percentage of Households with Income Above $200,000 in Mckeesport, PA?
Top 3 Zip Codes with the Highest Percentage of Households with Income Above $200,000 in Mckeesport, PA are:
What zip code has the Highest Percentage of Households with Income Above $200,000 in Mckeesport, PA?
15135 has the Highest Percentage of Households with Income Above $200,000 in Mckeesport, PA with 6.6%.
What is the Percentage of Households with Income Above $200,000 in Mckeesport, PA?
Percentage of Households with Income Above $200,000 in Mckeesport is 2.5%.
What is the Percentage of Households with Income Above $200,000 in Pennsylvania?
Percentage of Households with Income Above $200,000 in Pennsylvania is 10.2%.
What is the Percentage of Households with Income Above $200,000 in the United States?
Percentage of Households with Income Above $200,000 in the United States is 11.4%.