Zip Codes with the Highest Percentage of Households with Income Above $200,000 in Scranton, PA
RELATED REPORTS & OPTIONS
Household Income | $200k+
Scranton
Compare Zip Codes
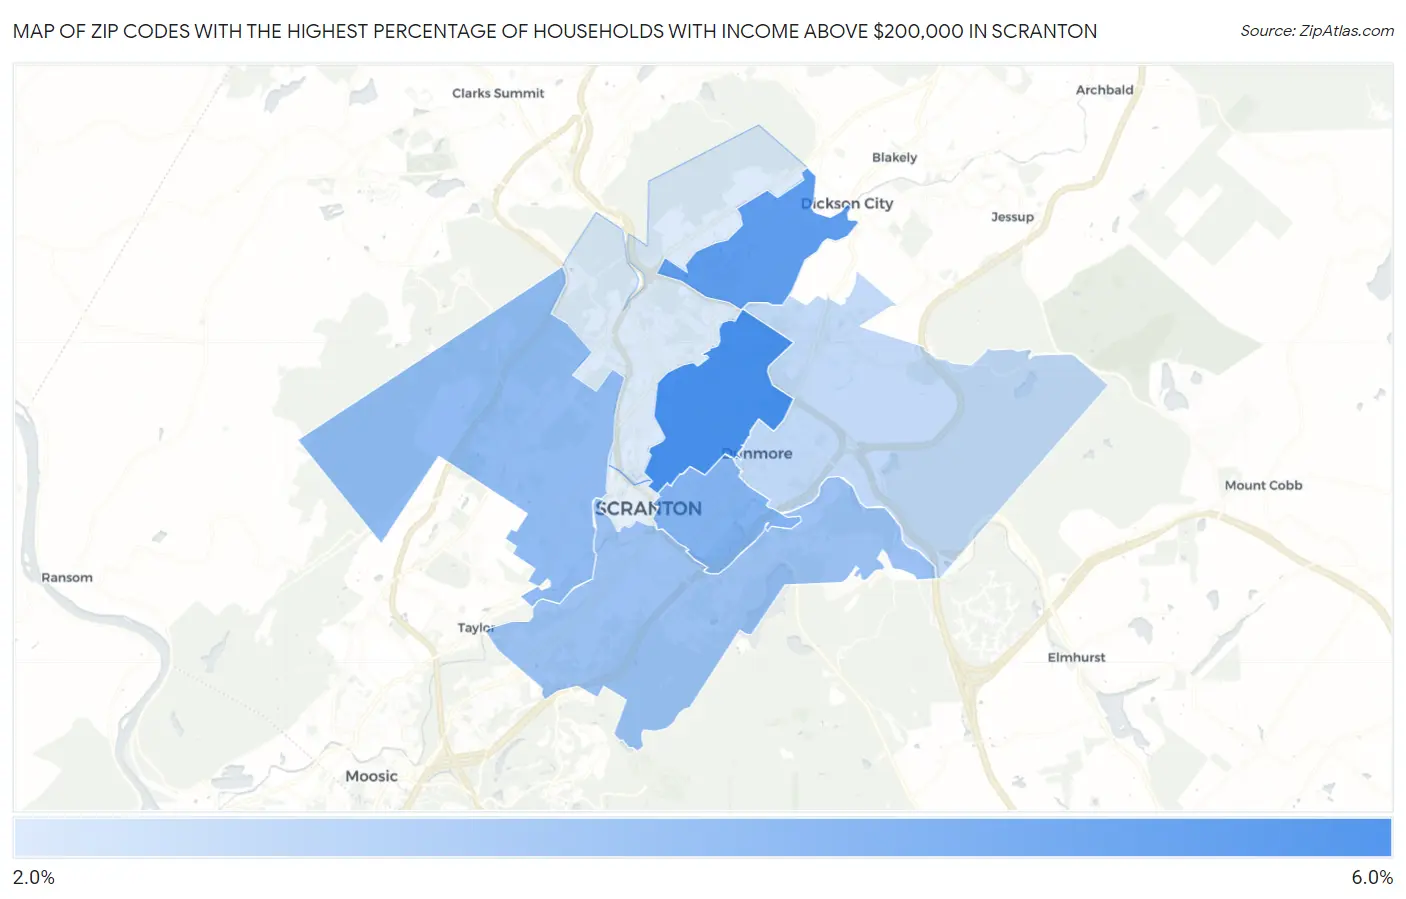
Map of Zip Codes with the Highest Percentage of Households with Income Above $200,000 in Scranton
2.5%
5.7%
Zip Codes with the Highest Percentage of Households with Income Above $200,000 in Scranton, PA
| Zip Code | Households with Income > $200k | vs State | vs National | |
| 1. | 18509 | 5.7% | 10.2%(-4.50)#686 | 11.4%(-5.70)#14,106 |
| 2. | 18519 | 5.2% | 10.2%(-5.00)#740 | 11.4%(-6.20)#15,170 |
| 3. | 18510 | 4.4% | 10.2%(-5.80)#839 | 11.4%(-7.00)#17,058 |
| 4. | 18504 | 4.1% | 10.2%(-6.10)#883 | 11.4%(-7.30)#17,848 |
| 5. | 18505 | 3.9% | 10.2%(-6.30)#918 | 11.4%(-7.50)#18,362 |
| 6. | 18512 | 3.1% | 10.2%(-7.10)#1,045 | 11.4%(-8.30)#20,630 |
| 7. | 18508 | 2.5% | 10.2%(-7.70)#1,149 | 11.4%(-8.90)#22,380 |
1
Common Questions
What are the Top 5 Zip Codes with the Highest Percentage of Households with Income Above $200,000 in Scranton, PA?
Top 5 Zip Codes with the Highest Percentage of Households with Income Above $200,000 in Scranton, PA are:
What zip code has the Highest Percentage of Households with Income Above $200,000 in Scranton, PA?
18509 has the Highest Percentage of Households with Income Above $200,000 in Scranton, PA with 5.7%.
What is the Percentage of Households with Income Above $200,000 in Scranton, PA?
Percentage of Households with Income Above $200,000 in Scranton is 3.7%.
What is the Percentage of Households with Income Above $200,000 in Pennsylvania?
Percentage of Households with Income Above $200,000 in Pennsylvania is 10.2%.
What is the Percentage of Households with Income Above $200,000 in the United States?
Percentage of Households with Income Above $200,000 in the United States is 11.4%.