North Branch, MN Map & Demographics
North Branch Map
North Branch Overview
$44,360
PER CAPITA INCOME
$113,060
AVG FAMILY INCOME
$94,564
AVG HOUSEHOLD INCOME
26.7%
WAGE / INCOME GAP [ % ]
73.3¢/ $1
WAGE / INCOME GAP [ $ ]
0.43
INEQUALITY / GINI INDEX
10,968
TOTAL POPULATION
5,634
MALE POPULATION
5,334
FEMALE POPULATION
105.62
MALES / 100 FEMALES
94.68
FEMALES / 100 MALES
39.9
MEDIAN AGE
3.1
AVG FAMILY SIZE
2.5
AVG HOUSEHOLD SIZE
6,208
LABOR FORCE [ PEOPLE ]
70.5%
PERCENT IN LABOR FORCE
3.7%
UNEMPLOYMENT RATE
North Branch Zip Codes
North Branch Area Codes
Income in North Branch
Income Overview in North Branch
Per Capita Income in North Branch is $44,360, while median incomes of families and households are $113,060 and $94,564 respectively.
| Characteristic | Number | Measure |
| Per Capita Income | 10,968 | $44,360 |
| Median Family Income | 2,850 | $113,060 |
| Mean Family Income | 2,850 | $135,938 |
| Median Household Income | 4,221 | $94,564 |
| Mean Household Income | 4,221 | $114,782 |
| Income Deficit | 2,850 | $0 |
| Wage / Income Gap (%) | 10,968 | 26.71% |
| Wage / Income Gap ($) | 10,968 | 73.29¢ per $1 |
| Gini / Inequality Index | 10,968 | 0.43 |
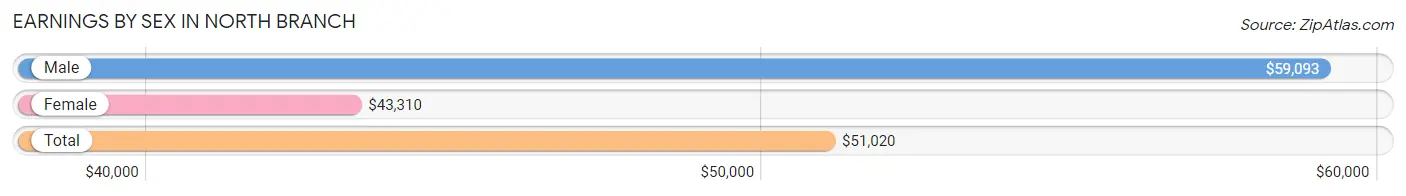
Earnings by Sex in North Branch
Average Earnings in North Branch are $51,020, $59,093 for men and $43,310 for women, a difference of 26.7%.
| Sex | Number | Average Earnings |
| Male | 3,415 (53.8%) | $59,093 |
| Female | 2,936 (46.2%) | $43,310 |
| Total | 6,351 (100.0%) | $51,020 |
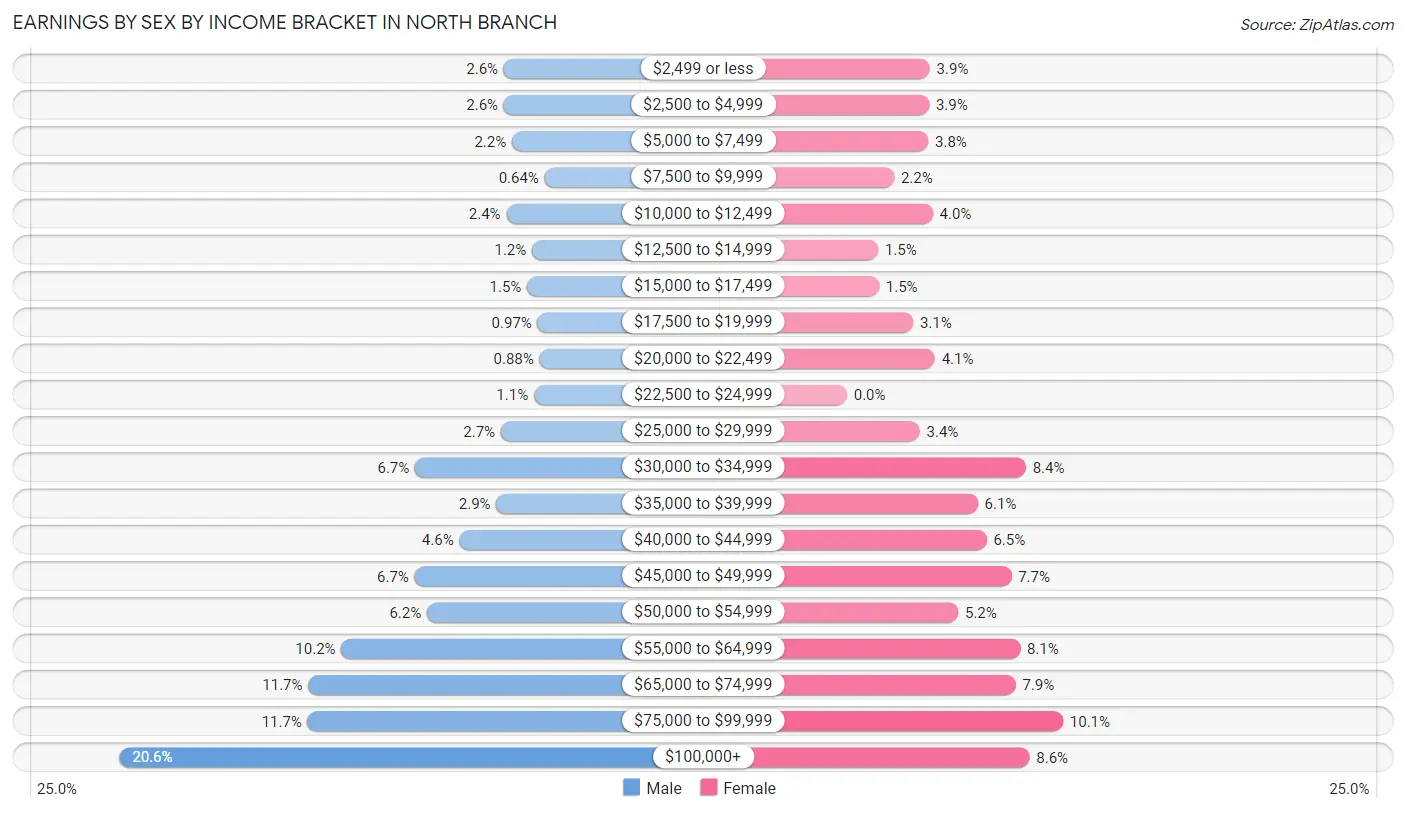
Earnings by Sex by Income Bracket in North Branch
The most common earnings brackets in North Branch are $100,000+ for men (702 | 20.6%) and $75,000 to $99,999 for women (297 | 10.1%).
| Income | Male | Female |
| $2,499 or less | 87 (2.5%) | 114 (3.9%) |
| $2,500 to $4,999 | 87 (2.5%) | 113 (3.8%) |
| $5,000 to $7,499 | 74 (2.2%) | 112 (3.8%) |
| $7,500 to $9,999 | 22 (0.6%) | 65 (2.2%) |
| $10,000 to $12,499 | 83 (2.4%) | 118 (4.0%) |
| $12,500 to $14,999 | 42 (1.2%) | 43 (1.5%) |
| $15,000 to $17,499 | 50 (1.5%) | 44 (1.5%) |
| $17,500 to $19,999 | 33 (1.0%) | 91 (3.1%) |
| $20,000 to $22,499 | 30 (0.9%) | 121 (4.1%) |
| $22,500 to $24,999 | 39 (1.1%) | 0 (0.0%) |
| $25,000 to $29,999 | 92 (2.7%) | 100 (3.4%) |
| $30,000 to $34,999 | 229 (6.7%) | 246 (8.4%) |
| $35,000 to $39,999 | 99 (2.9%) | 180 (6.1%) |
| $40,000 to $44,999 | 158 (4.6%) | 192 (6.5%) |
| $45,000 to $49,999 | 230 (6.7%) | 226 (7.7%) |
| $50,000 to $54,999 | 210 (6.1%) | 153 (5.2%) |
| $55,000 to $64,999 | 347 (10.2%) | 238 (8.1%) |
| $65,000 to $74,999 | 400 (11.7%) | 232 (7.9%) |
| $75,000 to $99,999 | 401 (11.7%) | 297 (10.1%) |
| $100,000+ | 702 (20.6%) | 251 (8.6%) |
| Total | 3,415 (100.0%) | 2,936 (100.0%) |
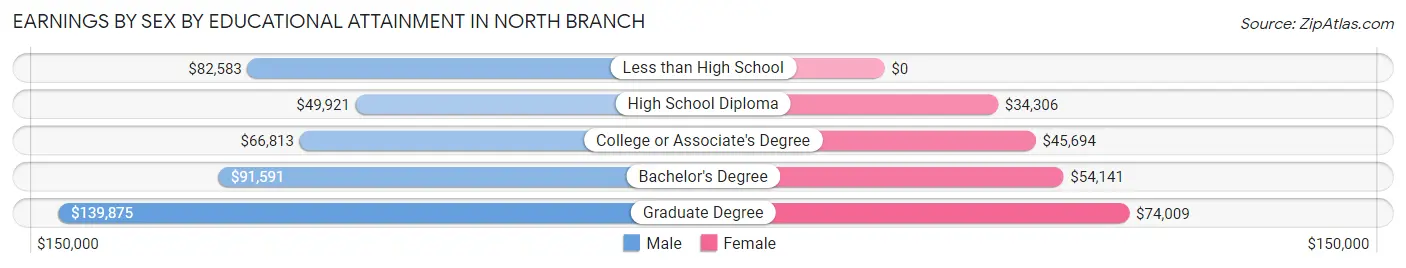
Earnings by Sex by Educational Attainment in North Branch
Average earnings in North Branch are $64,701 for men and $45,088 for women, a difference of 30.3%. Men with an educational attainment of graduate degree enjoy the highest average annual earnings of $139,875, while those with high school diploma education earn the least with $49,921. Women with an educational attainment of graduate degree earn the most with the average annual earnings of $74,009, while those with high school diploma education have the smallest earnings of $34,306.
| Educational Attainment | Male Income | Female Income |
| Less than High School | $82,583 | $0 |
| High School Diploma | $49,921 | $34,306 |
| College or Associate's Degree | $66,813 | $45,694 |
| Bachelor's Degree | $91,591 | $54,141 |
| Graduate Degree | $139,875 | $74,009 |
| Total | $64,701 | $45,088 |
Family Income in North Branch
Family Income Brackets in North Branch
According to the North Branch family income data, there are 943 families falling into the $100,000 to $149,999 income range, which is the most common income bracket and makes up 33.1% of all families.
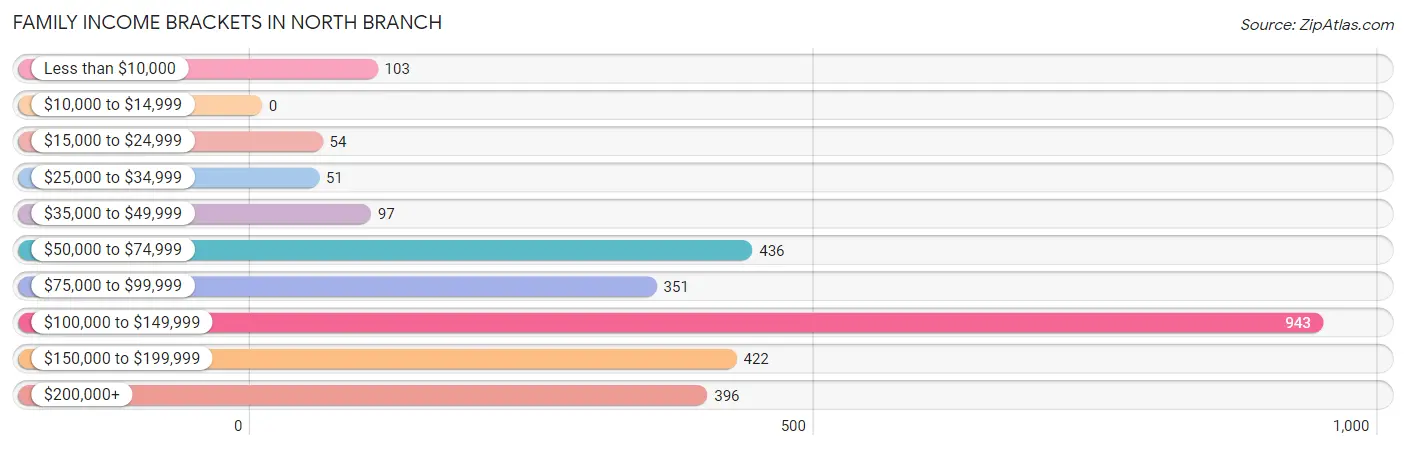
| Income Bracket | # Families | % Families |
| Less than $10,000 | 103 | 3.6% |
| $10,000 to $14,999 | 0 | 0.0% |
| $15,000 to $24,999 | 54 | 1.9% |
| $25,000 to $34,999 | 51 | 1.8% |
| $35,000 to $49,999 | 97 | 3.4% |
| $50,000 to $74,999 | 436 | 15.3% |
| $75,000 to $99,999 | 351 | 12.3% |
| $100,000 to $149,999 | 943 | 33.1% |
| $150,000 to $199,999 | 422 | 14.8% |
| $200,000+ | 396 | 13.9% |
Family Income by Famaliy Size in North Branch
5-person families (245 | 8.6%) account for the highest median family income in North Branch with $145,972 per family, while 2-person families (1,249 | 43.8%) have the highest median income of $53,095 per family member.
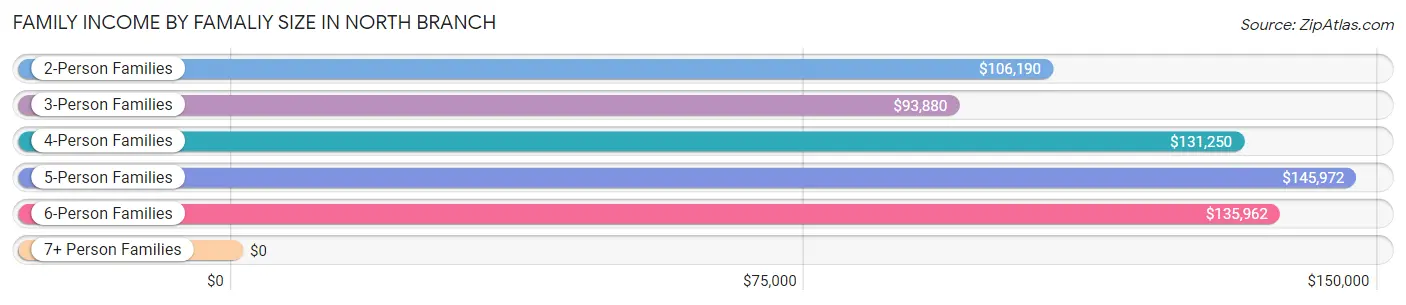
| Income Bracket | # Families | Median Income |
| 2-Person Families | 1,249 (43.8%) | $106,190 |
| 3-Person Families | 657 (23.1%) | $93,880 |
| 4-Person Families | 608 (21.3%) | $131,250 |
| 5-Person Families | 245 (8.6%) | $145,972 |
| 6-Person Families | 48 (1.7%) | $135,962 |
| 7+ Person Families | 43 (1.5%) | $0 |
| Total | 2,850 (100.0%) | $113,060 |
Family Income by Number of Earners in North Branch
The median family income in North Branch is $113,060, with families comprising 3+ earners (376) having the highest median family income of $166,625, while families with no earners (239) have the lowest median family income of $44,583, accounting for 13.2% and 8.4% of families, respectively.
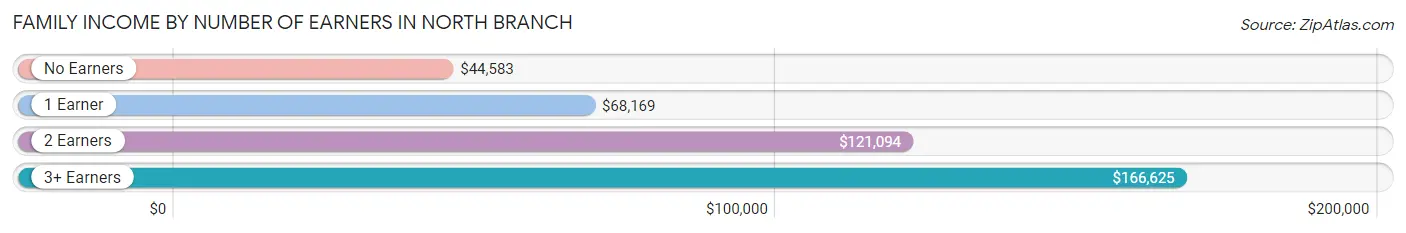
| Number of Earners | # Families | Median Income |
| No Earners | 239 (8.4%) | $44,583 |
| 1 Earner | 601 (21.1%) | $68,169 |
| 2 Earners | 1,634 (57.3%) | $121,094 |
| 3+ Earners | 376 (13.2%) | $166,625 |
| Total | 2,850 (100.0%) | $113,060 |
Household Income in North Branch
Household Income Brackets in North Branch
With 1,059 households falling in the category, the $100,000 to $149,999 income range is the most frequent in North Branch, accounting for 25.1% of all households. In contrast, only 51 households (1.2%) fall into the $10,000 to $14,999 income bracket, making it the least populous group.
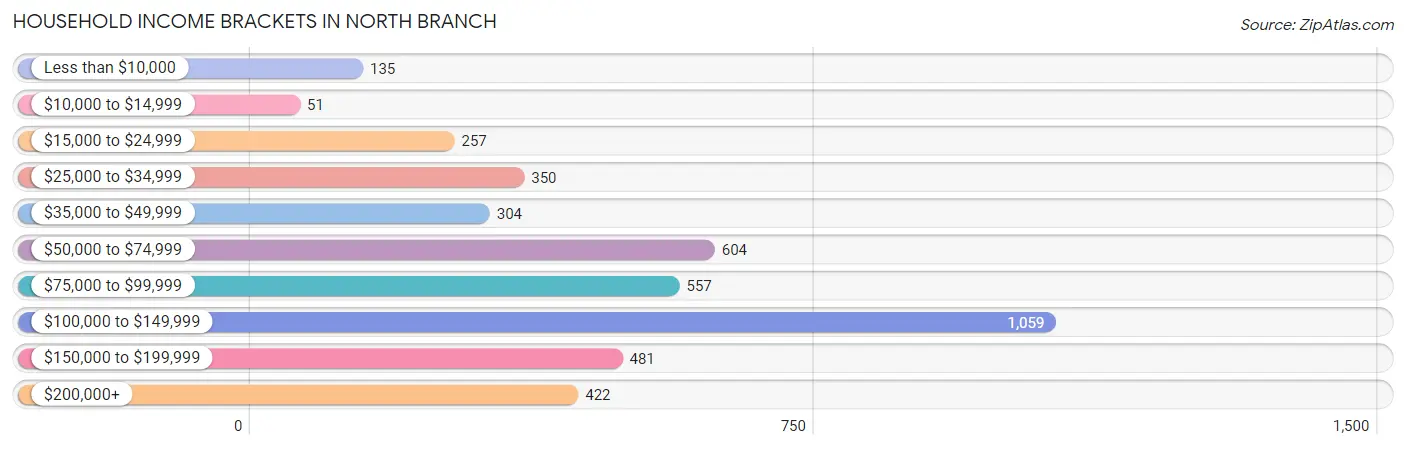
| Income Bracket | # Households | % Households |
| Less than $10,000 | 135 | 3.2% |
| $10,000 to $14,999 | 51 | 1.2% |
| $15,000 to $24,999 | 257 | 6.1% |
| $25,000 to $34,999 | 350 | 8.3% |
| $35,000 to $49,999 | 304 | 7.2% |
| $50,000 to $74,999 | 604 | 14.3% |
| $75,000 to $99,999 | 557 | 13.2% |
| $100,000 to $149,999 | 1,059 | 25.1% |
| $150,000 to $199,999 | 481 | 11.4% |
| $200,000+ | 422 | 10.0% |
Household Income by Householder Age in North Branch
The median household income in North Branch is $94,564, with the highest median household income of $112,540 found in the 25 to 44 years age bracket for the primary householder. A total of 1,413 households (33.5%) fall into this category. Meanwhile, the 65+ years age bracket for the primary householder has the lowest median household income of $37,821, with 1,105 households (26.2%) in this group.
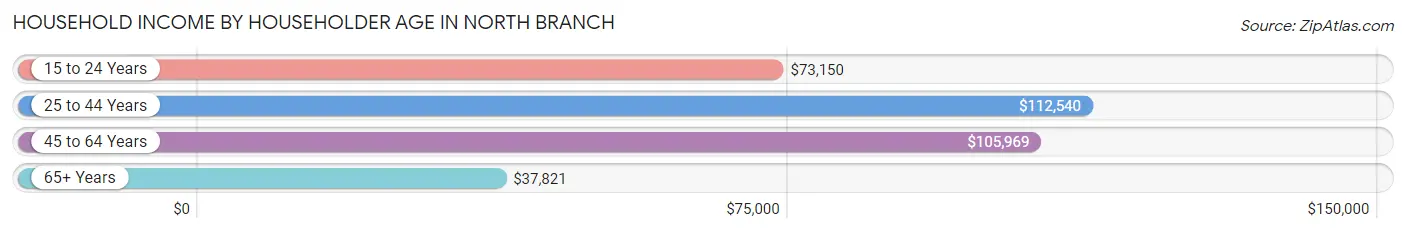
| Income Bracket | # Households | Median Income |
| 15 to 24 Years | 87 (2.1%) | $73,150 |
| 25 to 44 Years | 1,413 (33.5%) | $112,540 |
| 45 to 64 Years | 1,616 (38.3%) | $105,969 |
| 65+ Years | 1,105 (26.2%) | $37,821 |
| Total | 4,221 (100.0%) | $94,564 |
Poverty in North Branch
Income Below Poverty by Sex and Age in North Branch
With 7.7% poverty level for males and 6.6% for females among the residents of North Branch, 25 to 34 year old males and 16 and 17 year old females are the most vulnerable to poverty, with 145 males (17.9%) and 36 females (39.1%) in their respective age groups living below the poverty level.
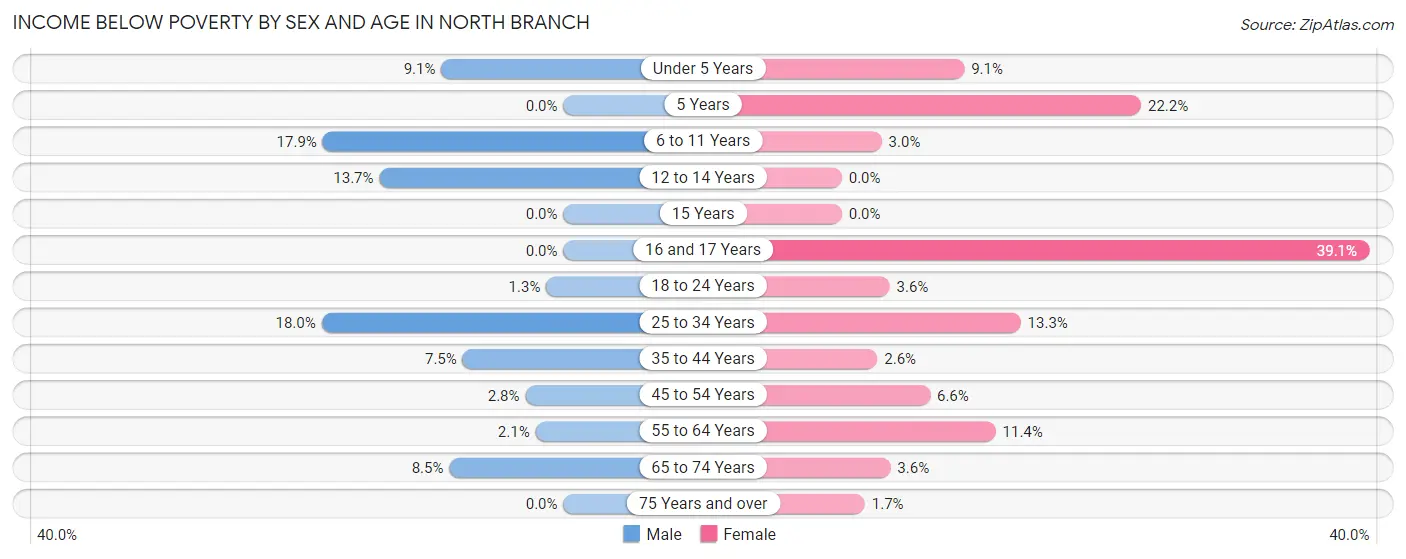
| Age Bracket | Male | Female |
| Under 5 Years | 26 (9.1%) | 19 (9.1%) |
| 5 Years | 0 (0.0%) | 14 (22.2%) |
| 6 to 11 Years | 89 (17.9%) | 14 (3.0%) |
| 12 to 14 Years | 31 (13.7%) | 0 (0.0%) |
| 15 Years | 0 (0.0%) | 0 (0.0%) |
| 16 and 17 Years | 0 (0.0%) | 36 (39.1%) |
| 18 to 24 Years | 4 (1.3%) | 18 (3.5%) |
| 25 to 34 Years | 145 (17.9%) | 85 (13.3%) |
| 35 to 44 Years | 69 (7.5%) | 20 (2.6%) |
| 45 to 54 Years | 22 (2.8%) | 51 (6.6%) |
| 55 to 64 Years | 16 (2.1%) | 70 (11.4%) |
| 65 to 74 Years | 31 (8.5%) | 15 (3.6%) |
| 75 Years and over | 0 (0.0%) | 7 (1.7%) |
| Total | 433 (7.7%) | 349 (6.6%) |
Income Above Poverty by Sex and Age in North Branch
According to the poverty statistics in North Branch, males aged 5 years and females aged 12 to 14 years are the age groups that are most secure financially, with 100.0% of males and 100.0% of females in these age groups living above the poverty line.
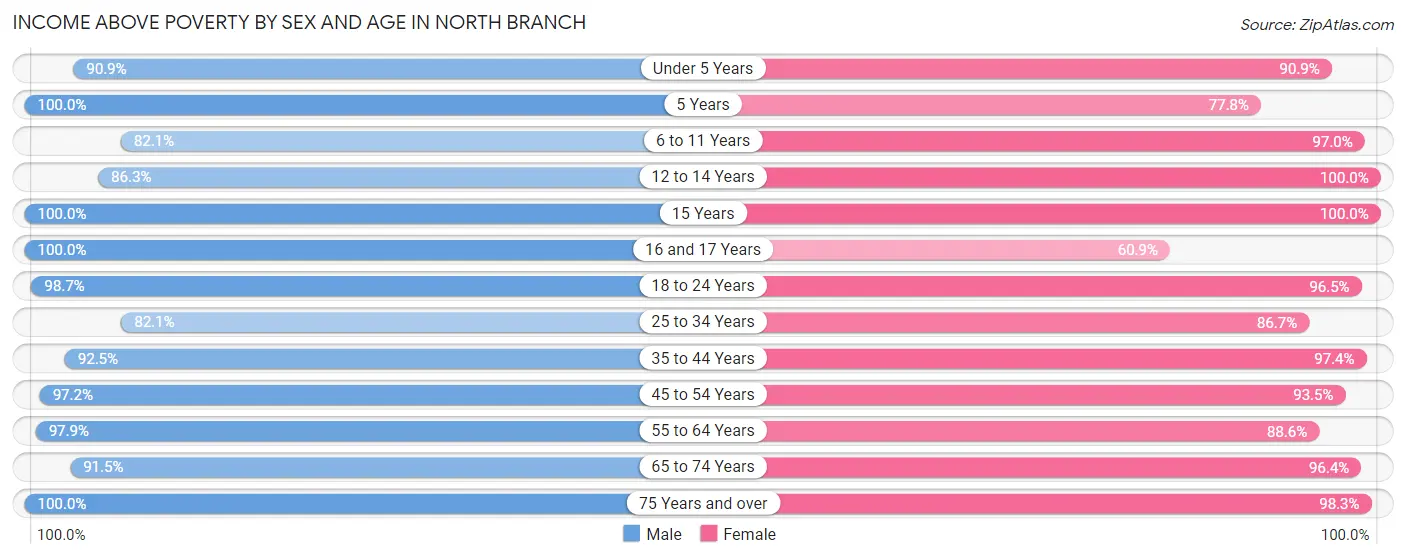
| Age Bracket | Male | Female |
| Under 5 Years | 261 (90.9%) | 190 (90.9%) |
| 5 Years | 58 (100.0%) | 49 (77.8%) |
| 6 to 11 Years | 409 (82.1%) | 459 (97.0%) |
| 12 to 14 Years | 196 (86.3%) | 269 (100.0%) |
| 15 Years | 25 (100.0%) | 50 (100.0%) |
| 16 and 17 Years | 172 (100.0%) | 56 (60.9%) |
| 18 to 24 Years | 312 (98.7%) | 489 (96.5%) |
| 25 to 34 Years | 663 (82.1%) | 555 (86.7%) |
| 35 to 44 Years | 853 (92.5%) | 737 (97.4%) |
| 45 to 54 Years | 759 (97.2%) | 728 (93.4%) |
| 55 to 64 Years | 756 (97.9%) | 543 (88.6%) |
| 65 to 74 Years | 335 (91.5%) | 400 (96.4%) |
| 75 Years and over | 369 (100.0%) | 402 (98.3%) |
| Total | 5,168 (92.3%) | 4,927 (93.4%) |
Income Below Poverty Among Married-Couple Families in North Branch
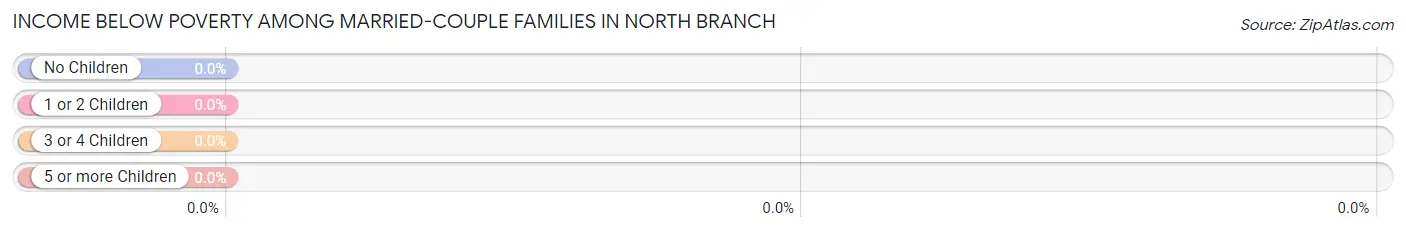
| Children | Above Poverty | Below Poverty |
| No Children | 1,361 (100.0%) | 0 (0.0%) |
| 1 or 2 Children | 778 (100.0%) | 0 (0.0%) |
| 3 or 4 Children | 177 (100.0%) | 0 (0.0%) |
| 5 or more Children | 28 (100.0%) | 0 (0.0%) |
| Total | 2,344 (100.0%) | 0 (0.0%) |
Income Below Poverty Among Single-Parent Households in North Branch
According to the poverty data in North Branch, 2.9% or 7 single-father households and 44.3% or 117 single-mother households are living below the poverty line. Among single-father households, those with 1 or 2 children have the highest poverty rate, with 7 households (7.2%) experiencing poverty. Likewise, among single-mother households, those with 1 or 2 children have the highest poverty rate, with 72 households (55.0%) falling below the poverty line.

| Children | Single Father | Single Mother |
| No Children | 0 (0.0%) | 30 (35.3%) |
| 1 or 2 Children | 7 (7.2%) | 72 (55.0%) |
| 3 or 4 Children | 0 (0.0%) | 15 (31.2%) |
| 5 or more Children | 0 (0.0%) | 0 (0.0%) |
| Total | 7 (2.9%) | 117 (44.3%) |
Income Below Poverty Among Married-Couple vs Single-Parent Households in North Branch
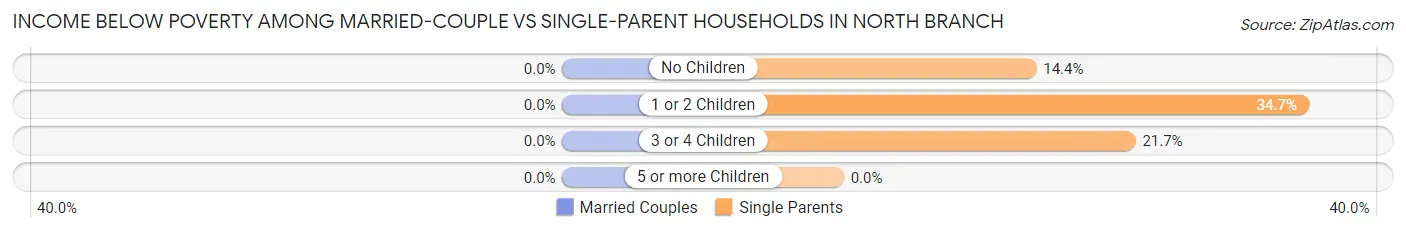
| Children | Married-Couple Families | Single-Parent Households |
| No Children | 0 (0.0%) | 30 (14.3%) |
| 1 or 2 Children | 0 (0.0%) | 79 (34.6%) |
| 3 or 4 Children | 0 (0.0%) | 15 (21.7%) |
| 5 or more Children | 0 (0.0%) | 0 (0.0%) |
| Total | 0 (0.0%) | 124 (24.5%) |
Race in North Branch
The most populous races in North Branch are White / Caucasian (10,312 | 94.0%), Two or more Races (365 | 3.3%), and Hispanic or Latino (256 | 2.3%).
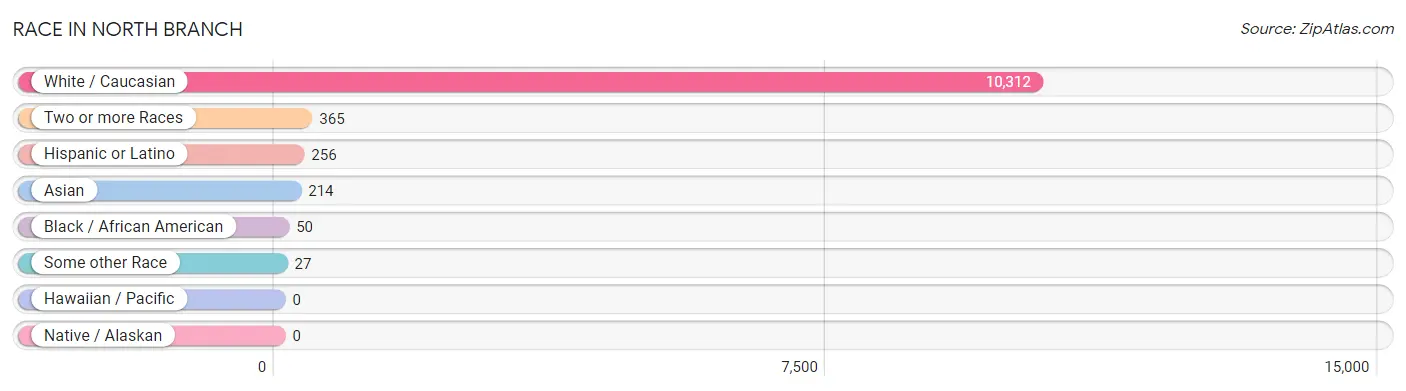
| Race | # Population | % Population |
| Asian | 214 | 1.9% |
| Black / African American | 50 | 0.5% |
| Hawaiian / Pacific | 0 | 0.0% |
| Hispanic or Latino | 256 | 2.3% |
| Native / Alaskan | 0 | 0.0% |
| White / Caucasian | 10,312 | 94.0% |
| Two or more Races | 365 | 3.3% |
| Some other Race | 27 | 0.3% |
| Total | 10,968 | 100.0% |
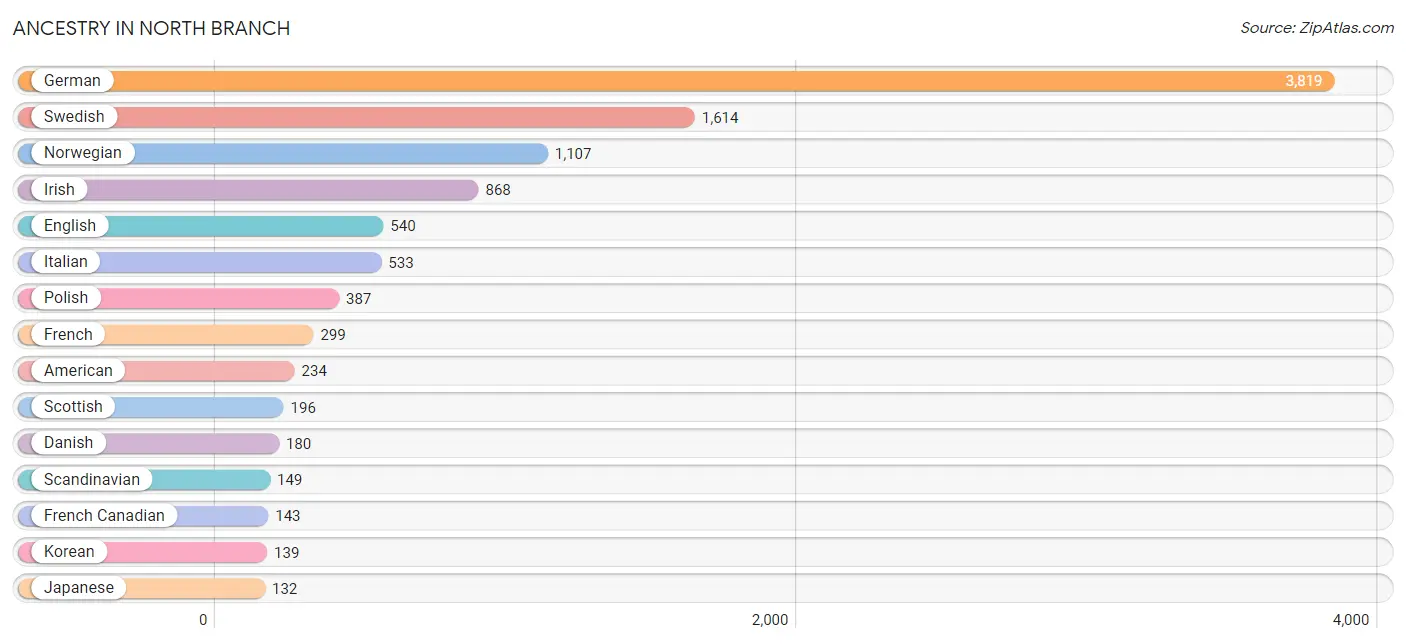
Ancestry in North Branch
The most populous ancestries reported in North Branch are German (3,819 | 34.8%), Swedish (1,614 | 14.7%), Norwegian (1,107 | 10.1%), Irish (868 | 7.9%), and English (540 | 4.9%), together accounting for 72.5% of all North Branch residents.
| Ancestry | # Population | % Population |
| African | 15 | 0.1% |
| American | 234 | 2.1% |
| Belgian | 59 | 0.5% |
| Bhutanese | 19 | 0.2% |
| Brazilian | 5 | 0.1% |
| British | 37 | 0.3% |
| Bulgarian | 19 | 0.2% |
| Canadian | 12 | 0.1% |
| Central American | 115 | 1.1% |
| Chippewa | 13 | 0.1% |
| Colombian | 15 | 0.1% |
| Czech | 80 | 0.7% |
| Danish | 180 | 1.6% |
| Dutch | 124 | 1.1% |
| Eastern European | 67 | 0.6% |
| English | 540 | 4.9% |
| Estonian | 14 | 0.1% |
| European | 19 | 0.2% |
| Finnish | 87 | 0.8% |
| French | 299 | 2.7% |
| French Canadian | 143 | 1.3% |
| German | 3,819 | 34.8% |
| Guatemalan | 115 | 1.1% |
| Hungarian | 10 | 0.1% |
| Irish | 868 | 7.9% |
| Italian | 533 | 4.9% |
| Japanese | 132 | 1.2% |
| Korean | 139 | 1.3% |
| Latvian | 17 | 0.2% |
| Lithuanian | 14 | 0.1% |
| Luxembourger | 29 | 0.3% |
| Mexican | 77 | 0.7% |
| Native Hawaiian | 19 | 0.2% |
| Norwegian | 1,107 | 10.1% |
| Pakistani | 23 | 0.2% |
| Polish | 387 | 3.5% |
| Puerto Rican | 49 | 0.4% |
| Russian | 106 | 1.0% |
| Scandinavian | 149 | 1.4% |
| Scotch-Irish | 41 | 0.4% |
| Scottish | 196 | 1.8% |
| South American | 15 | 0.1% |
| Sri Lankan | 9 | 0.1% |
| Subsaharan African | 15 | 0.1% |
| Swedish | 1,614 | 14.7% |
| Swiss | 34 | 0.3% |
| Turkish | 6 | 0.1% |
| Ukrainian | 19 | 0.2% |
| Welsh | 59 | 0.5% | View All 49 Rows |
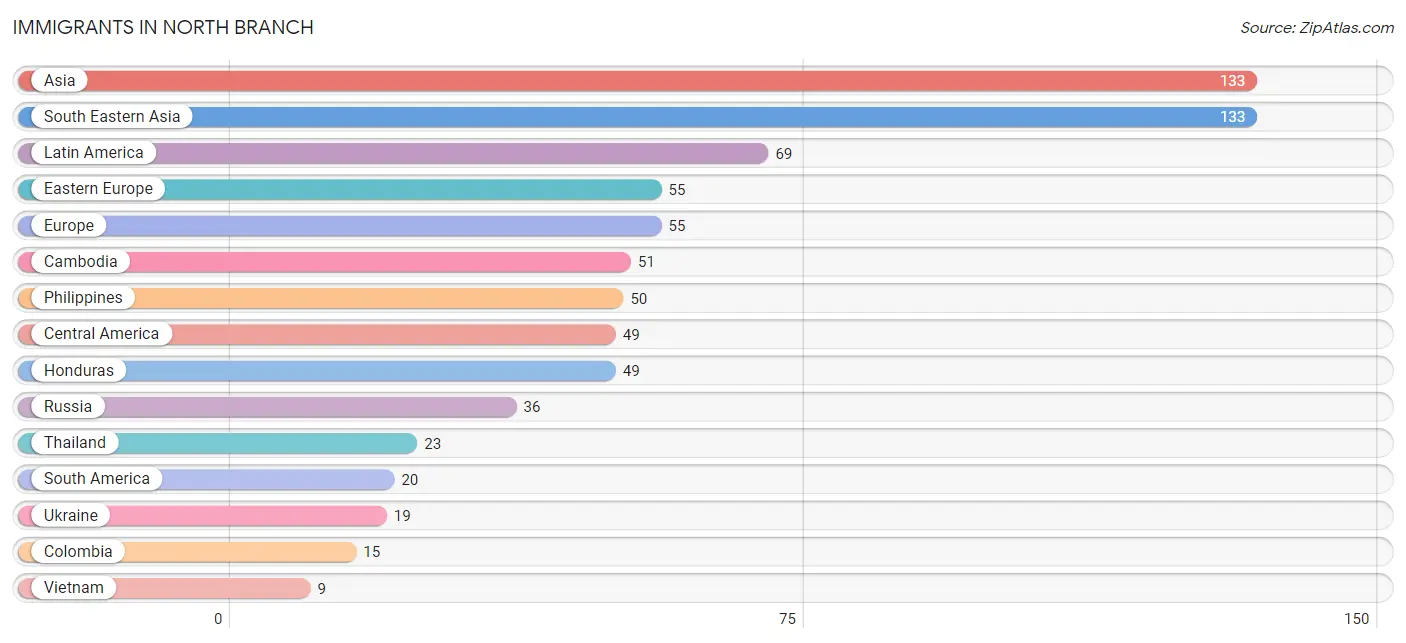
Immigrants in North Branch
The most numerous immigrant groups reported in North Branch came from Asia (133 | 1.2%), South Eastern Asia (133 | 1.2%), Latin America (69 | 0.6%), Eastern Europe (55 | 0.5%), and Europe (55 | 0.5%), together accounting for 4.0% of all North Branch residents.
| Immigration Origin | # Population | % Population |
| Asia | 133 | 1.2% |
| Brazil | 5 | 0.1% |
| Cambodia | 51 | 0.5% |
| Central America | 49 | 0.4% |
| Colombia | 15 | 0.1% |
| Eastern Europe | 55 | 0.5% |
| Europe | 55 | 0.5% |
| Honduras | 49 | 0.4% |
| Latin America | 69 | 0.6% |
| Philippines | 50 | 0.5% |
| Russia | 36 | 0.3% |
| South America | 20 | 0.2% |
| South Eastern Asia | 133 | 1.2% |
| Thailand | 23 | 0.2% |
| Ukraine | 19 | 0.2% |
| Vietnam | 9 | 0.1% | View All 16 Rows |
Sex and Age in North Branch
Sex and Age in North Branch
The most populous age groups in North Branch are 40 to 44 Years (567 | 10.1%) for men and 35 to 39 Years (443 | 8.3%) for women.
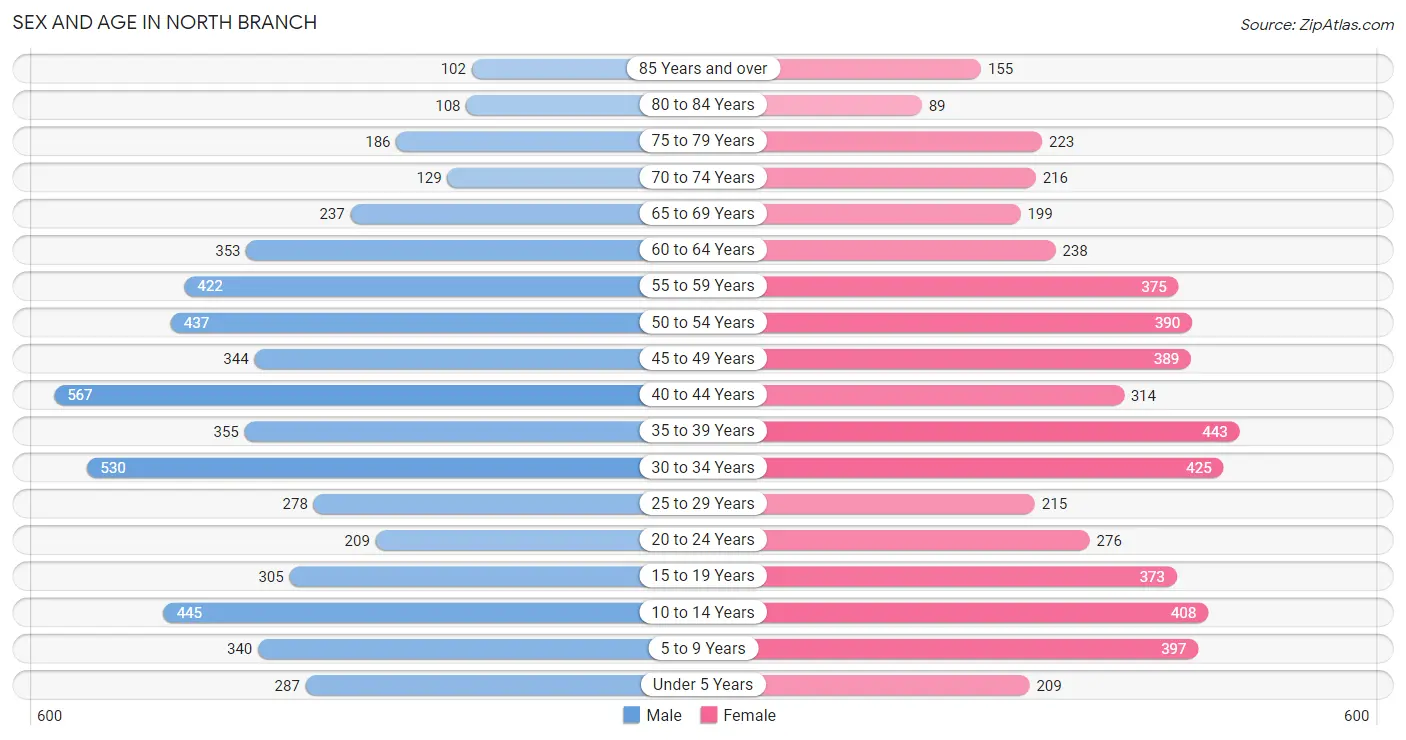
| Age Bracket | Male | Female |
| Under 5 Years | 287 (5.1%) | 209 (3.9%) |
| 5 to 9 Years | 340 (6.0%) | 397 (7.4%) |
| 10 to 14 Years | 445 (7.9%) | 408 (7.6%) |
| 15 to 19 Years | 305 (5.4%) | 373 (7.0%) |
| 20 to 24 Years | 209 (3.7%) | 276 (5.2%) |
| 25 to 29 Years | 278 (4.9%) | 215 (4.0%) |
| 30 to 34 Years | 530 (9.4%) | 425 (8.0%) |
| 35 to 39 Years | 355 (6.3%) | 443 (8.3%) |
| 40 to 44 Years | 567 (10.1%) | 314 (5.9%) |
| 45 to 49 Years | 344 (6.1%) | 389 (7.3%) |
| 50 to 54 Years | 437 (7.8%) | 390 (7.3%) |
| 55 to 59 Years | 422 (7.5%) | 375 (7.0%) |
| 60 to 64 Years | 353 (6.3%) | 238 (4.5%) |
| 65 to 69 Years | 237 (4.2%) | 199 (3.7%) |
| 70 to 74 Years | 129 (2.3%) | 216 (4.1%) |
| 75 to 79 Years | 186 (3.3%) | 223 (4.2%) |
| 80 to 84 Years | 108 (1.9%) | 89 (1.7%) |
| 85 Years and over | 102 (1.8%) | 155 (2.9%) |
| Total | 5,634 (100.0%) | 5,334 (100.0%) |
Families and Households in North Branch
Median Family Size in North Branch
The median family size in North Branch is 3.09 persons per family, with single female/mother families (264 | 9.3%) accounting for the largest median family size of 3.31 persons per family. On the other hand, single male/father families (242 | 8.5%) represent the smallest median family size with 2.26 persons per family.
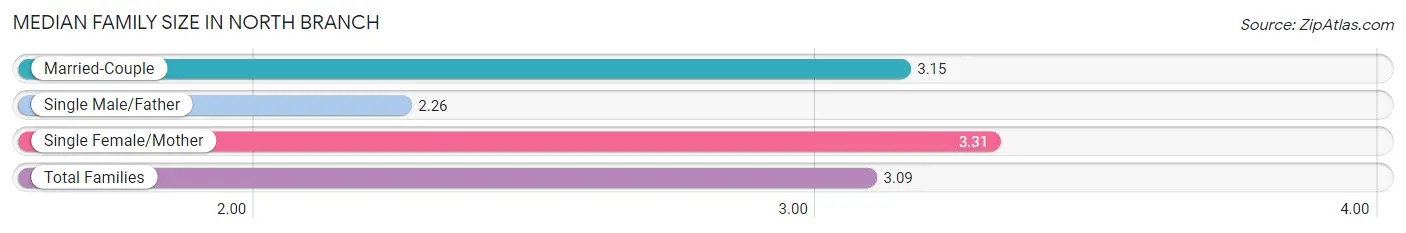
| Family Type | # Families | Family Size |
| Married-Couple | 2,344 (82.3%) | 3.15 |
| Single Male/Father | 242 (8.5%) | 2.26 |
| Single Female/Mother | 264 (9.3%) | 3.31 |
| Total Families | 2,850 (100.0%) | 3.09 |
Median Household Size in North Branch
The median household size in North Branch is 2.55 persons per household, with single female/mother households (264 | 6.2%) accounting for the largest median household size of 3.57 persons per household. non-family households (1,371 | 32.5%) represent the smallest median household size with 1.25 persons per household.
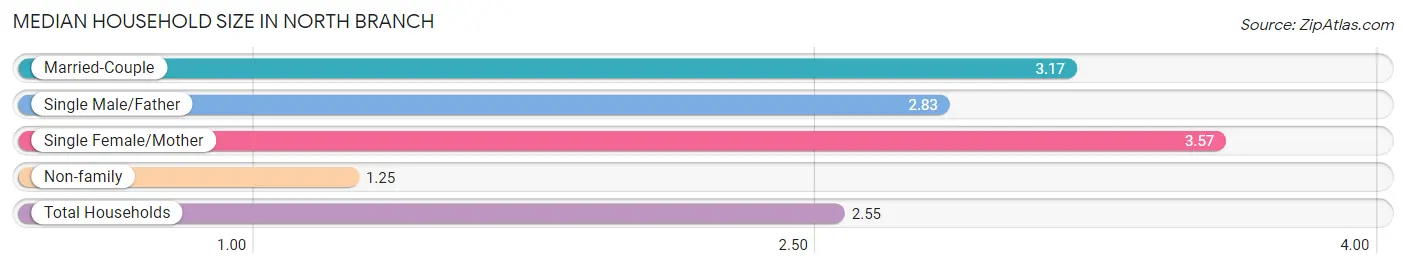
| Household Type | # Households | Household Size |
| Married-Couple | 2,344 (55.5%) | 3.17 |
| Single Male/Father | 242 (5.7%) | 2.83 |
| Single Female/Mother | 264 (6.2%) | 3.57 |
| Non-family | 1,371 (32.5%) | 1.25 |
| Total Households | 4,221 (100.0%) | 2.55 |
Household Size by Marriage Status in North Branch
Out of a total of 4,221 households in North Branch, 2,850 (67.5%) are family households, while 1,371 (32.5%) are nonfamily households. The most numerous type of family households are 2-person households, comprising 1,124, and the most common type of nonfamily households are 1-person households, comprising 1,043.
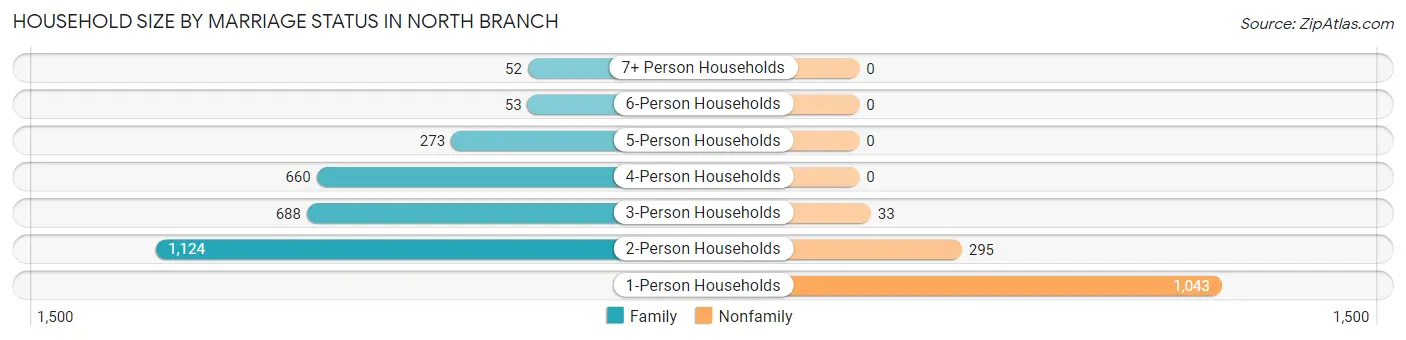
| Household Size | Family Households | Nonfamily Households |
| 1-Person Households | - | 1,043 (24.7%) |
| 2-Person Households | 1,124 (26.6%) | 295 (7.0%) |
| 3-Person Households | 688 (16.3%) | 33 (0.8%) |
| 4-Person Households | 660 (15.6%) | 0 (0.0%) |
| 5-Person Households | 273 (6.5%) | 0 (0.0%) |
| 6-Person Households | 53 (1.3%) | 0 (0.0%) |
| 7+ Person Households | 52 (1.2%) | 0 (0.0%) |
| Total | 2,850 (67.5%) | 1,371 (32.5%) |
Female Fertility in North Branch
Fertility by Age in North Branch
Average fertility rate in North Branch is 39.0 births per 1,000 women. Women in the age bracket of 20 to 34 years have the highest fertility rate with 99.0 births per 1,000 women. Women in the age bracket of 20 to 34 years acount for 92.9% of all women with births.
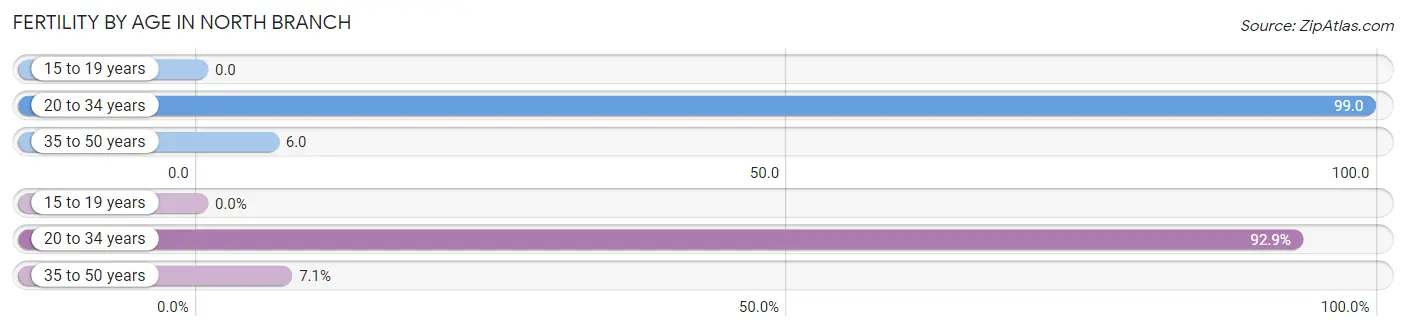
| Age Bracket | Women with Births | Births / 1,000 Women |
| 15 to 19 years | 0 (0.0%) | 0.0 |
| 20 to 34 years | 91 (92.9%) | 99.0 |
| 35 to 50 years | 7 (7.1%) | 6.0 |
| Total | 98 (100.0%) | 39.0 |
Fertility by Age by Marriage Status in North Branch
93.9% of women with births (98) in North Branch are married. The highest percentage of unmarried women with births falls into 20 to 34 years age bracket with 6.6% of them unmarried at the time of birth, while the lowest percentage of unmarried women with births belong to 35 to 50 years age bracket with 0.0% of them unmarried.
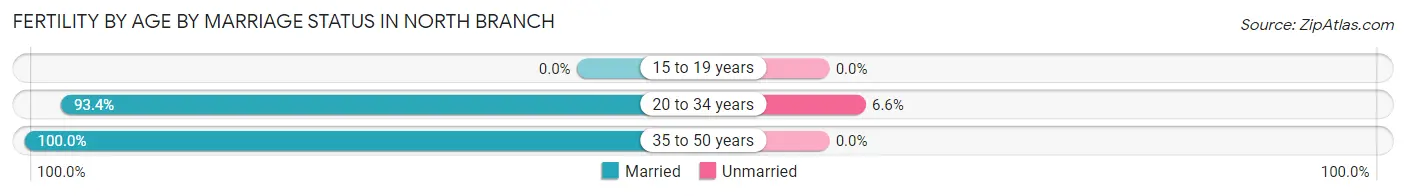
| Age Bracket | Married | Unmarried |
| 15 to 19 years | 0 (0.0%) | 0 (0.0%) |
| 20 to 34 years | 85 (93.4%) | 6 (6.6%) |
| 35 to 50 years | 7 (100.0%) | 0 (0.0%) |
| Total | 92 (93.9%) | 6 (6.1%) |
Fertility by Education in North Branch
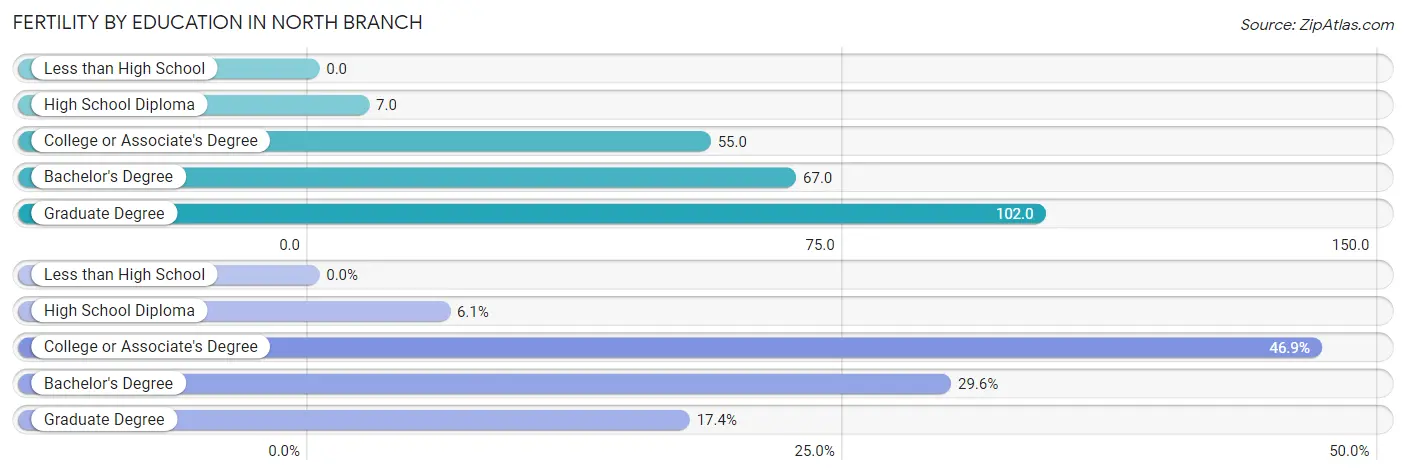
| Educational Attainment | Women with Births | Births / 1,000 Women |
| Less than High School | 0 (0.0%) | 0.0 |
| High School Diploma | 6 (6.1%) | 7.0 |
| College or Associate's Degree | 46 (46.9%) | 55.0 |
| Bachelor's Degree | 29 (29.6%) | 67.0 |
| Graduate Degree | 17 (17.3%) | 102.0 |
| Total | 98 (100.0%) | 39.0 |
Fertility by Education by Marriage Status in North Branch
6.1% of women with births in North Branch are unmarried. Women with the educational attainment of college or associate's degree are most likely to be married with 100.0% of them married at childbirth, while women with the educational attainment of high school diploma are least likely to be married with 100.0% of them unmarried at childbirth.
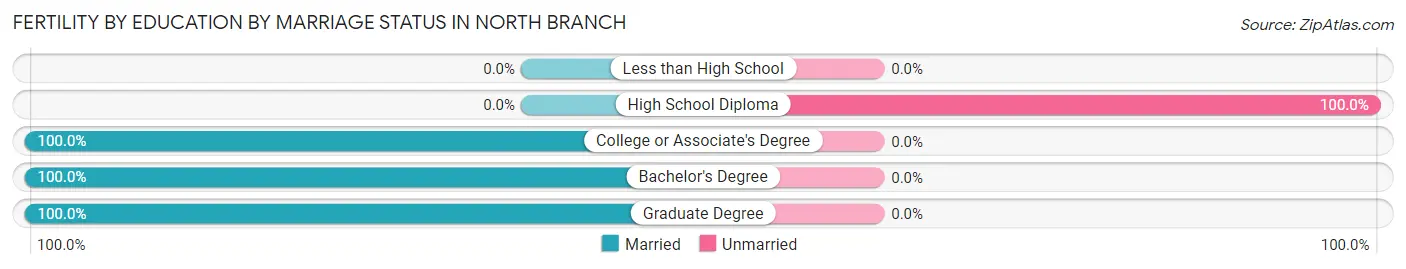
| Educational Attainment | Married | Unmarried |
| Less than High School | 0 (0.0%) | 0 (0.0%) |
| High School Diploma | 0 (0.0%) | 6 (100.0%) |
| College or Associate's Degree | 46 (100.0%) | 0 (0.0%) |
| Bachelor's Degree | 29 (100.0%) | 0 (0.0%) |
| Graduate Degree | 17 (100.0%) | 0 (0.0%) |
| Total | 92 (93.9%) | 6 (6.1%) |
Employment Characteristics in North Branch
Employment by Class of Employer in North Branch
Among the 5,932 employed individuals in North Branch, private company employees (4,223 | 71.2%), not-for-profit organizations (523 | 8.8%), and local government employees (410 | 6.9%) make up the most common classes of employment.
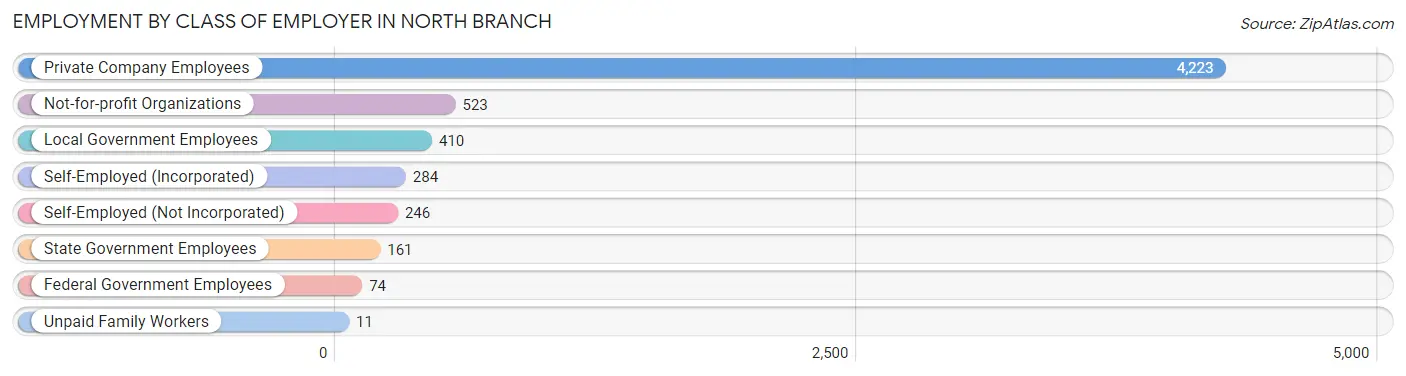
| Employer Class | # Employees | % Employees |
| Private Company Employees | 4,223 | 71.2% |
| Self-Employed (Incorporated) | 284 | 4.8% |
| Self-Employed (Not Incorporated) | 246 | 4.2% |
| Not-for-profit Organizations | 523 | 8.8% |
| Local Government Employees | 410 | 6.9% |
| State Government Employees | 161 | 2.7% |
| Federal Government Employees | 74 | 1.3% |
| Unpaid Family Workers | 11 | 0.2% |
| Total | 5,932 | 100.0% |
Employment Status by Age in North Branch
According to the labor force statistics for North Branch, out of the total population over 16 years of age (8,806), 70.5% or 6,208 individuals are in the labor force, with 3.7% or 230 of them unemployed. The age group with the highest labor force participation rate is 45 to 54 years, with 94.0% or 1,466 individuals in the labor force. Within the labor force, the 16 to 19 years age range has the highest percentage of unemployed individuals, with 8.2% or 27 of them being unemployed.
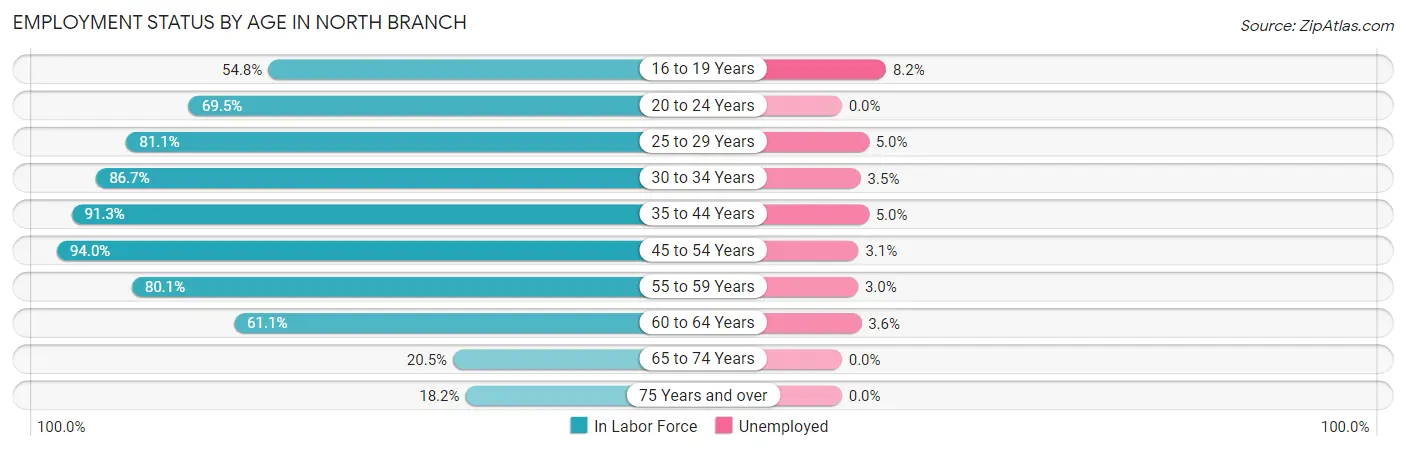
| Age Bracket | In Labor Force | Unemployed |
| 16 to 19 Years | 330 (54.8%) | 27 (8.2%) |
| 20 to 24 Years | 337 (69.5%) | 0 (0.0%) |
| 25 to 29 Years | 400 (81.1%) | 20 (5.0%) |
| 30 to 34 Years | 828 (86.7%) | 29 (3.5%) |
| 35 to 44 Years | 1,533 (91.3%) | 77 (5.0%) |
| 45 to 54 Years | 1,466 (94.0%) | 45 (3.1%) |
| 55 to 59 Years | 638 (80.1%) | 19 (3.0%) |
| 60 to 64 Years | 361 (61.1%) | 13 (3.6%) |
| 65 to 74 Years | 160 (20.5%) | 0 (0.0%) |
| 75 Years and over | 157 (18.2%) | 0 (0.0%) |
| Total | 6,208 (70.5%) | 230 (3.7%) |
Employment Status by Educational Attainment in North Branch
According to labor force statistics for North Branch, 86.0% of individuals (5,224) out of the total population between 25 and 64 years of age (6,075) are in the labor force, with 3.9% or 204 of them being unemployed. The group with the highest labor force participation rate are those with the educational attainment of college / associate degree, with 91.3% or 2,152 individuals in the labor force. Within the labor force, individuals with less than high school education have the highest percentage of unemployment, with 20.0% or 20 of them being unemployed.
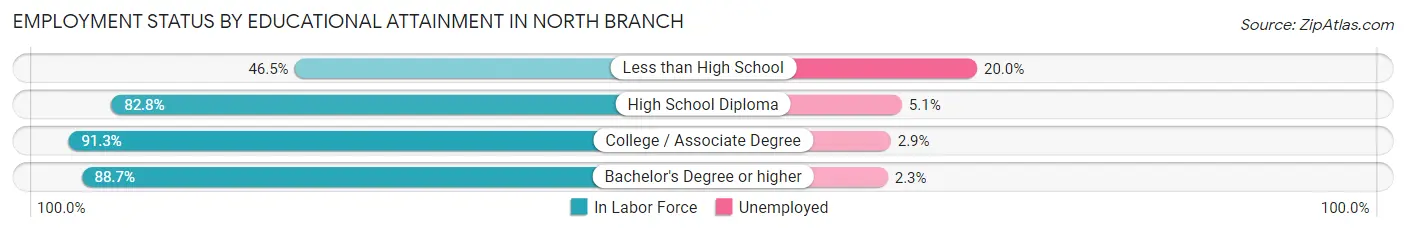
| Educational Attainment | In Labor Force | Unemployed |
| Less than High School | 100 (46.5%) | 43 (20.0%) |
| High School Diploma | 1,880 (82.8%) | 116 (5.1%) |
| College / Associate Degree | 2,152 (91.3%) | 68 (2.9%) |
| Bachelor's Degree or higher | 1,093 (88.7%) | 28 (2.3%) |
| Total | 5,224 (86.0%) | 237 (3.9%) |
Employment Occupations by Sex in North Branch
Management, Business, Science and Arts Occupations
The most common Management, Business, Science and Arts occupations in North Branch are Community & Social Service (752 | 12.6%), Management (630 | 10.5%), Education Instruction & Library (415 | 6.9%), Health Diagnosing & Treating (362 | 6.0%), and Computers, Engineering & Science (252 | 4.2%).
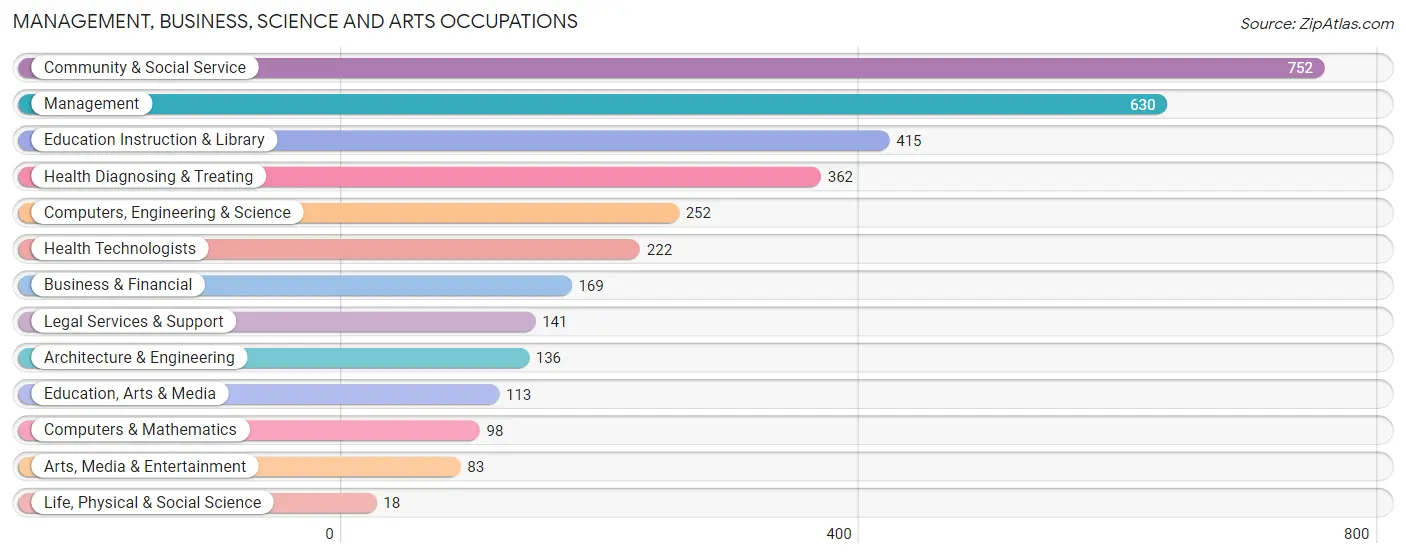
Management, Business, Science and Arts Occupations by Sex
Within the Management, Business, Science and Arts occupations in North Branch, the most male-oriented occupations are Life, Physical & Social Science (100.0%), Management (55.4%), and Computers, Engineering & Science (52.8%), while the most female-oriented occupations are Health Diagnosing & Treating (90.3%), Health Technologists (84.2%), and Education Instruction & Library (81.0%).
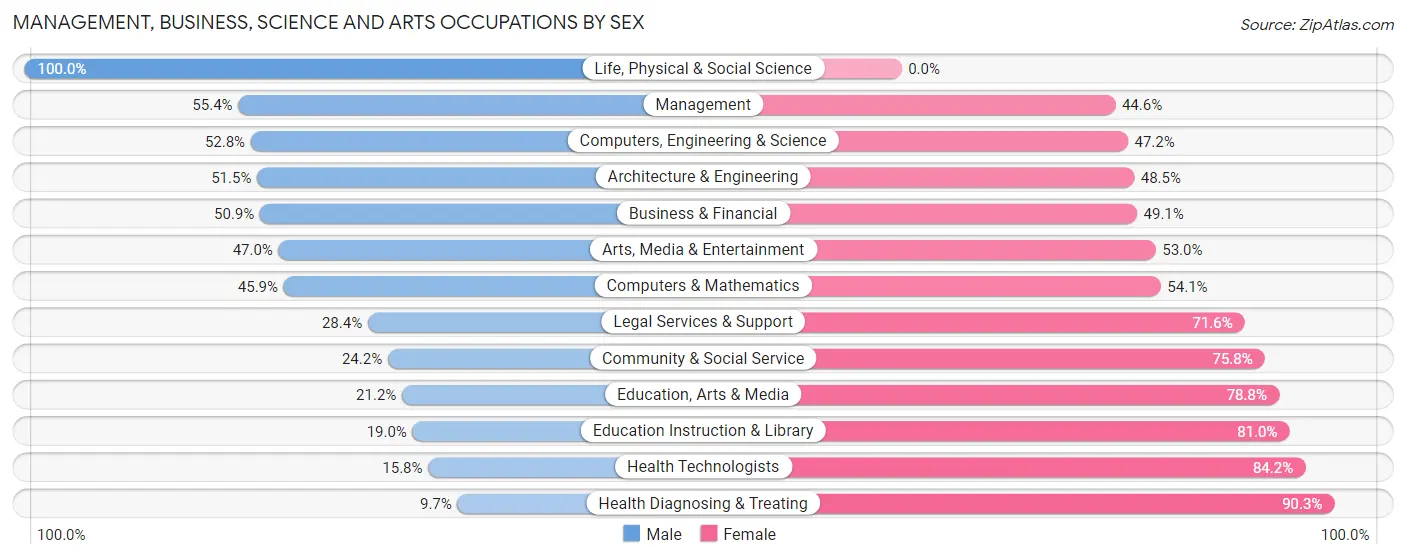
| Occupation | Male | Female |
| Management | 349 (55.4%) | 281 (44.6%) |
| Business & Financial | 86 (50.9%) | 83 (49.1%) |
| Computers, Engineering & Science | 133 (52.8%) | 119 (47.2%) |
| Computers & Mathematics | 45 (45.9%) | 53 (54.1%) |
| Architecture & Engineering | 70 (51.5%) | 66 (48.5%) |
| Life, Physical & Social Science | 18 (100.0%) | 0 (0.0%) |
| Community & Social Service | 182 (24.2%) | 570 (75.8%) |
| Education, Arts & Media | 24 (21.2%) | 89 (78.8%) |
| Legal Services & Support | 40 (28.4%) | 101 (71.6%) |
| Education Instruction & Library | 79 (19.0%) | 336 (81.0%) |
| Arts, Media & Entertainment | 39 (47.0%) | 44 (53.0%) |
| Health Diagnosing & Treating | 35 (9.7%) | 327 (90.3%) |
| Health Technologists | 35 (15.8%) | 187 (84.2%) |
| Total (Category) | 785 (36.3%) | 1,380 (63.7%) |
| Total (Overall) | 3,247 (54.3%) | 2,734 (45.7%) |
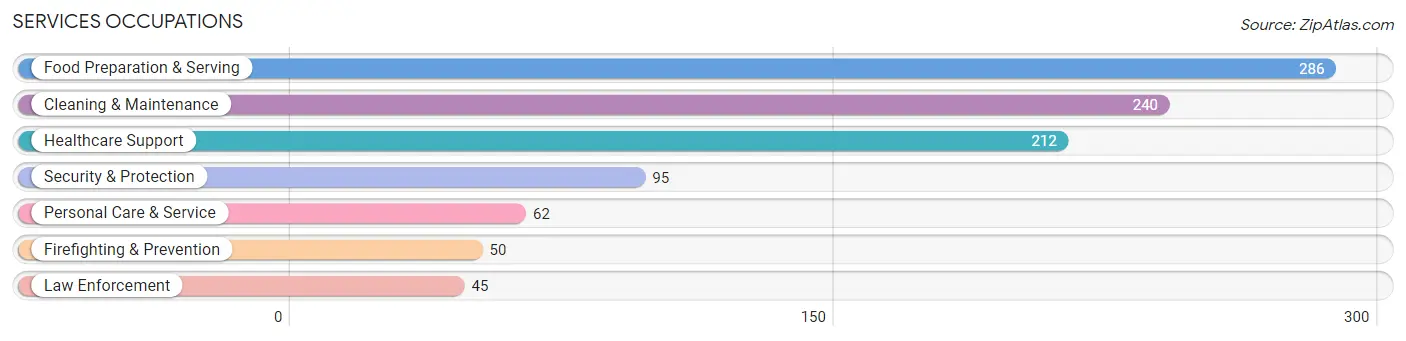
Services Occupations
The most common Services occupations in North Branch are Food Preparation & Serving (286 | 4.8%), Cleaning & Maintenance (240 | 4.0%), Healthcare Support (212 | 3.5%), Security & Protection (95 | 1.6%), and Personal Care & Service (62 | 1.0%).
Services Occupations by Sex
Within the Services occupations in North Branch, the most male-oriented occupations are Firefighting & Prevention (100.0%), Security & Protection (89.5%), and Law Enforcement (77.8%), while the most female-oriented occupations are Healthcare Support (100.0%), Personal Care & Service (62.9%), and Food Preparation & Serving (44.4%).
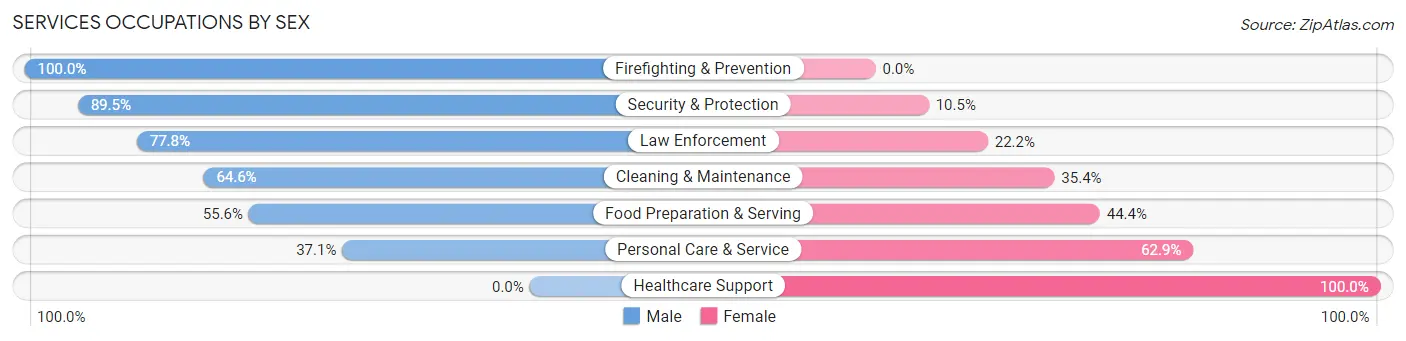
| Occupation | Male | Female |
| Healthcare Support | 0 (0.0%) | 212 (100.0%) |
| Security & Protection | 85 (89.5%) | 10 (10.5%) |
| Firefighting & Prevention | 50 (100.0%) | 0 (0.0%) |
| Law Enforcement | 35 (77.8%) | 10 (22.2%) |
| Food Preparation & Serving | 159 (55.6%) | 127 (44.4%) |
| Cleaning & Maintenance | 155 (64.6%) | 85 (35.4%) |
| Personal Care & Service | 23 (37.1%) | 39 (62.9%) |
| Total (Category) | 422 (47.1%) | 473 (52.8%) |
| Total (Overall) | 3,247 (54.3%) | 2,734 (45.7%) |
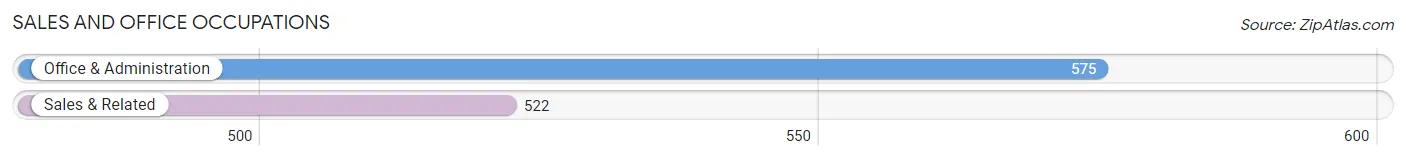
Sales and Office Occupations
The most common Sales and Office occupations in North Branch are Office & Administration (575 | 9.6%), and Sales & Related (522 | 8.7%).
Sales and Office Occupations by Sex
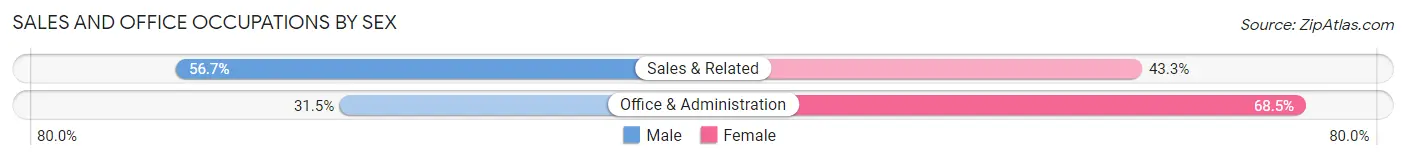
| Occupation | Male | Female |
| Sales & Related | 296 (56.7%) | 226 (43.3%) |
| Office & Administration | 181 (31.5%) | 394 (68.5%) |
| Total (Category) | 477 (43.5%) | 620 (56.5%) |
| Total (Overall) | 3,247 (54.3%) | 2,734 (45.7%) |
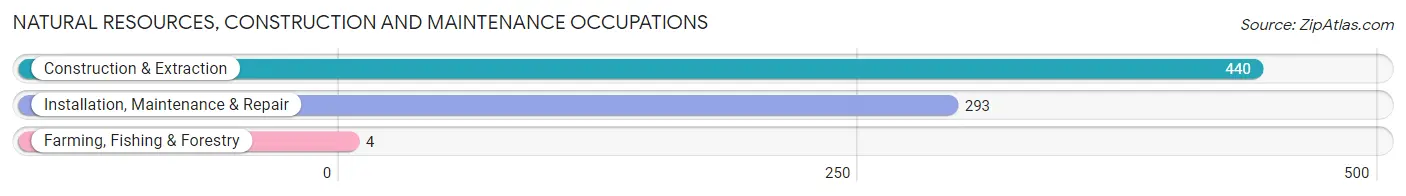
Natural Resources, Construction and Maintenance Occupations
The most common Natural Resources, Construction and Maintenance occupations in North Branch are Construction & Extraction (440 | 7.4%), Installation, Maintenance & Repair (293 | 4.9%), and Farming, Fishing & Forestry (4 | 0.1%).
Natural Resources, Construction and Maintenance Occupations by Sex
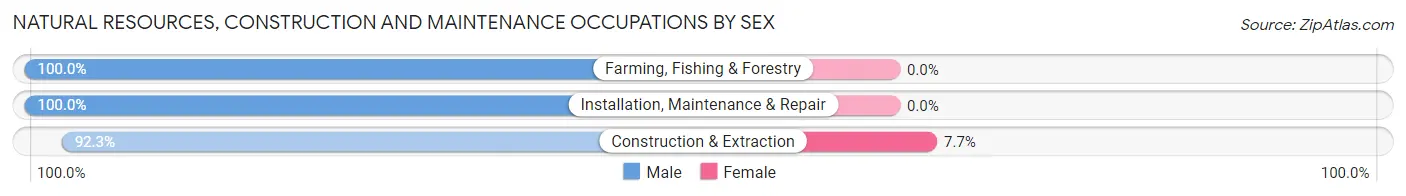
| Occupation | Male | Female |
| Farming, Fishing & Forestry | 4 (100.0%) | 0 (0.0%) |
| Construction & Extraction | 406 (92.3%) | 34 (7.7%) |
| Installation, Maintenance & Repair | 293 (100.0%) | 0 (0.0%) |
| Total (Category) | 703 (95.4%) | 34 (4.6%) |
| Total (Overall) | 3,247 (54.3%) | 2,734 (45.7%) |
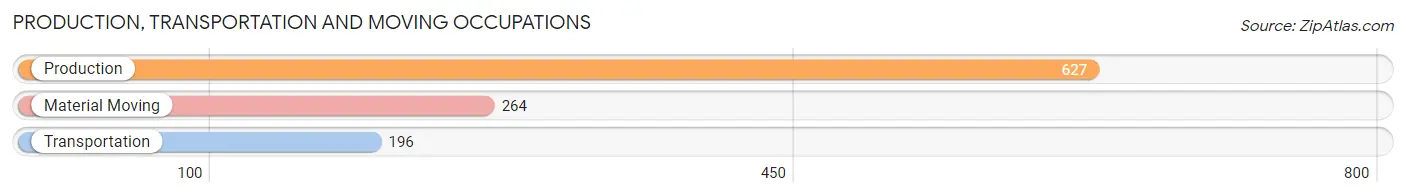
Production, Transportation and Moving Occupations
The most common Production, Transportation and Moving occupations in North Branch are Production (627 | 10.5%), Material Moving (264 | 4.4%), and Transportation (196 | 3.3%).
Production, Transportation and Moving Occupations by Sex
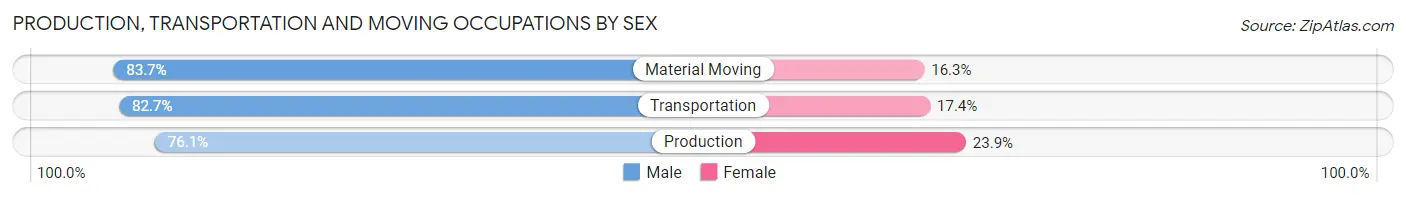
| Occupation | Male | Female |
| Production | 477 (76.1%) | 150 (23.9%) |
| Transportation | 162 (82.7%) | 34 (17.3%) |
| Material Moving | 221 (83.7%) | 43 (16.3%) |
| Total (Category) | 860 (79.1%) | 227 (20.9%) |
| Total (Overall) | 3,247 (54.3%) | 2,734 (45.7%) |
Employment Industries by Sex in North Branch
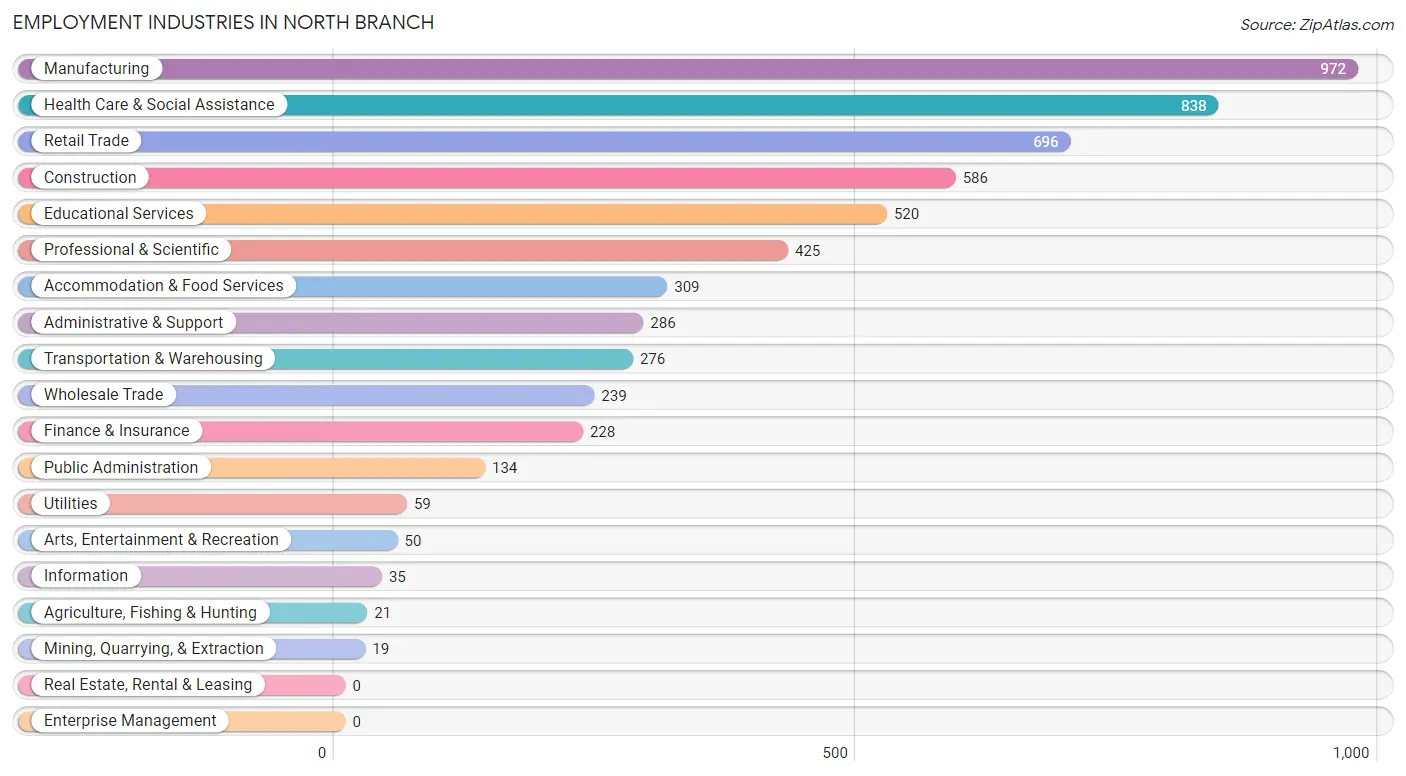
Employment Industries in North Branch
The major employment industries in North Branch include Manufacturing (972 | 16.3%), Health Care & Social Assistance (838 | 14.0%), Retail Trade (696 | 11.6%), Construction (586 | 9.8%), and Educational Services (520 | 8.7%).
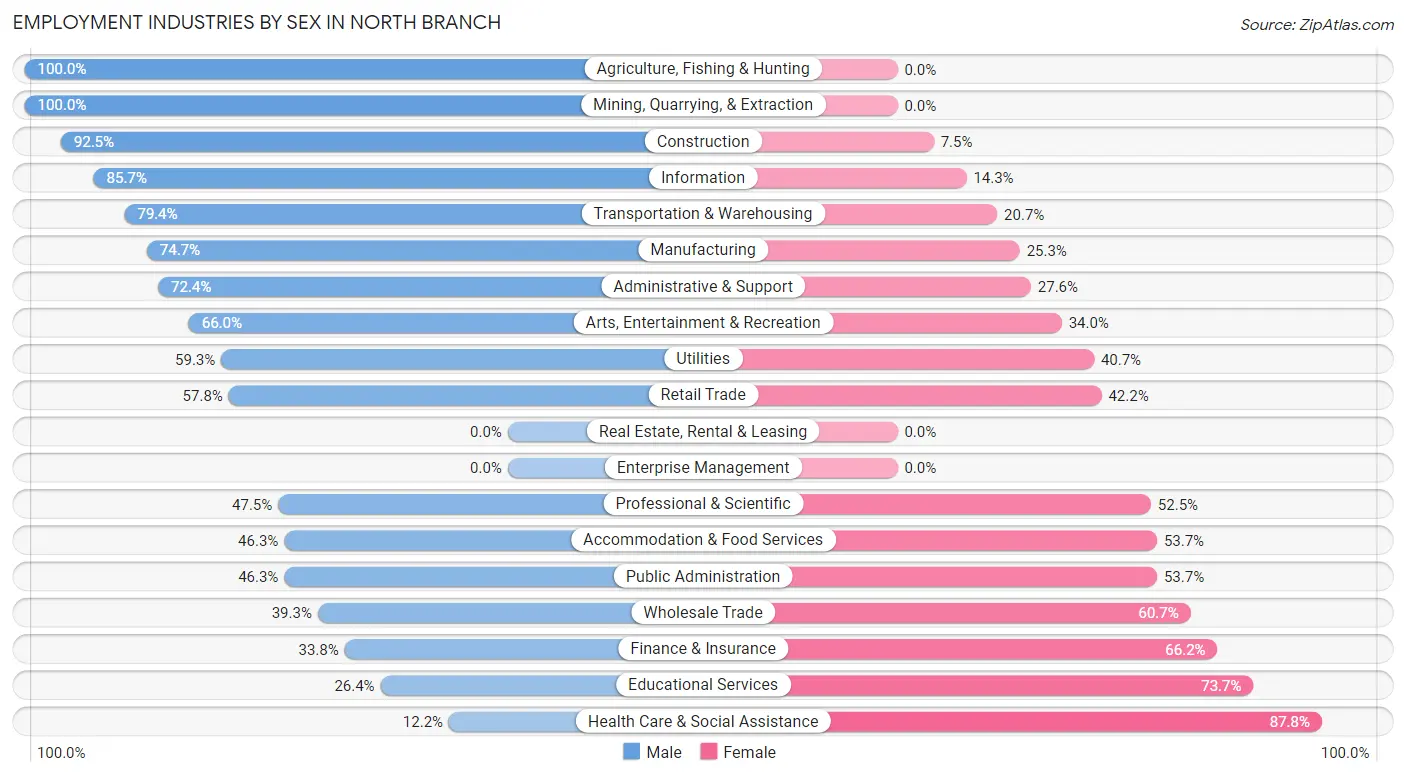
Employment Industries by Sex in North Branch
The North Branch industries that see more men than women are Agriculture, Fishing & Hunting (100.0%), Mining, Quarrying, & Extraction (100.0%), and Construction (92.5%), whereas the industries that tend to have a higher number of women are Health Care & Social Assistance (87.8%), Educational Services (73.7%), and Finance & Insurance (66.2%).
| Industry | Male | Female |
| Agriculture, Fishing & Hunting | 21 (100.0%) | 0 (0.0%) |
| Mining, Quarrying, & Extraction | 19 (100.0%) | 0 (0.0%) |
| Construction | 542 (92.5%) | 44 (7.5%) |
| Manufacturing | 726 (74.7%) | 246 (25.3%) |
| Wholesale Trade | 94 (39.3%) | 145 (60.7%) |
| Retail Trade | 402 (57.8%) | 294 (42.2%) |
| Transportation & Warehousing | 219 (79.3%) | 57 (20.6%) |
| Utilities | 35 (59.3%) | 24 (40.7%) |
| Information | 30 (85.7%) | 5 (14.3%) |
| Finance & Insurance | 77 (33.8%) | 151 (66.2%) |
| Real Estate, Rental & Leasing | 0 (0.0%) | 0 (0.0%) |
| Professional & Scientific | 202 (47.5%) | 223 (52.5%) |
| Enterprise Management | 0 (0.0%) | 0 (0.0%) |
| Administrative & Support | 207 (72.4%) | 79 (27.6%) |
| Educational Services | 137 (26.4%) | 383 (73.7%) |
| Health Care & Social Assistance | 102 (12.2%) | 736 (87.8%) |
| Arts, Entertainment & Recreation | 33 (66.0%) | 17 (34.0%) |
| Accommodation & Food Services | 143 (46.3%) | 166 (53.7%) |
| Public Administration | 62 (46.3%) | 72 (53.7%) |
| Total | 3,247 (54.3%) | 2,734 (45.7%) |
Education in North Branch
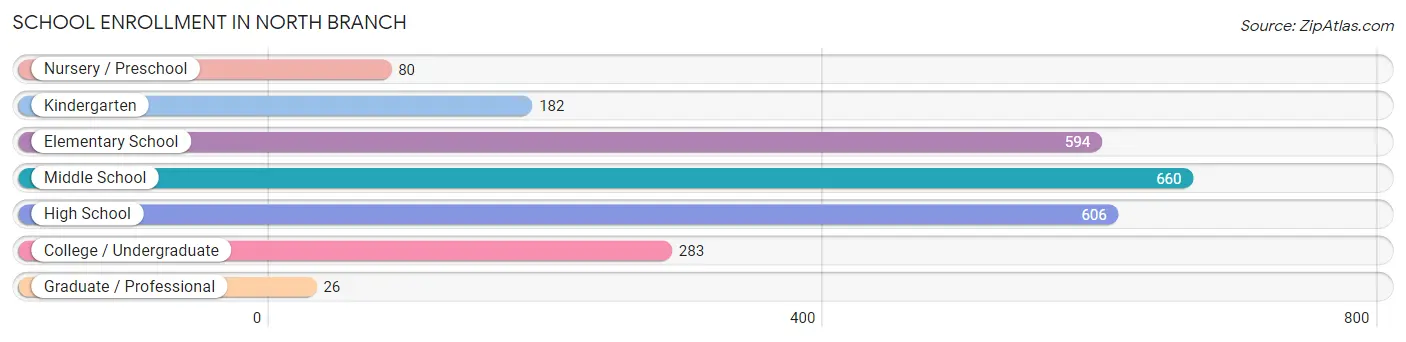
School Enrollment in North Branch
The most common levels of schooling among the 2,431 students in North Branch are middle school (660 | 27.2%), high school (606 | 24.9%), and elementary school (594 | 24.4%).
| School Level | # Students | % Students |
| Nursery / Preschool | 80 | 3.3% |
| Kindergarten | 182 | 7.5% |
| Elementary School | 594 | 24.4% |
| Middle School | 660 | 27.2% |
| High School | 606 | 24.9% |
| College / Undergraduate | 283 | 11.6% |
| Graduate / Professional | 26 | 1.1% |
| Total | 2,431 | 100.0% |
School Enrollment by Age by Funding Source in North Branch
Out of a total of 2,431 students who are enrolled in schools in North Branch, 97 (4.0%) attend a private institution, while the remaining 2,334 (96.0%) are enrolled in public schools. The age group of 20 to 24 year olds has the highest likelihood of being enrolled in private schools, with 22 (100.0% in the age bracket) enrolled. Conversely, the age group of 15 to 17 year olds has the lowest likelihood of being enrolled in a private school, with 340 (100.0% in the age bracket) attending a public institution.
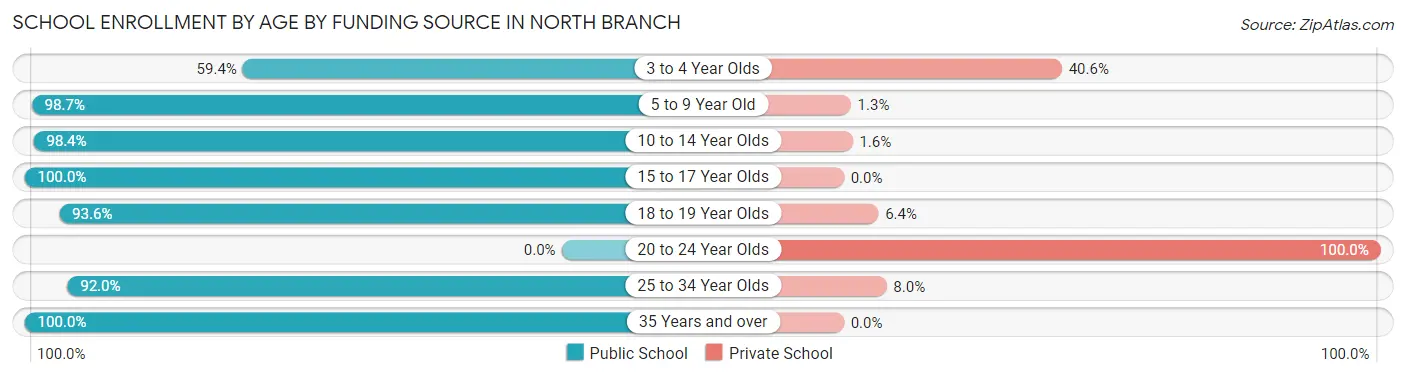
| Age Bracket | Public School | Private School |
| 3 to 4 Year Olds | 38 (59.4%) | 26 (40.6%) |
| 5 to 9 Year Old | 684 (98.7%) | 9 (1.3%) |
| 10 to 14 Year Olds | 839 (98.4%) | 14 (1.6%) |
| 15 to 17 Year Olds | 340 (100.0%) | 0 (0.0%) |
| 18 to 19 Year Olds | 247 (93.6%) | 17 (6.4%) |
| 20 to 24 Year Olds | 0 (0.0%) | 22 (100.0%) |
| 25 to 34 Year Olds | 104 (92.0%) | 9 (8.0%) |
| 35 Years and over | 82 (100.0%) | 0 (0.0%) |
| Total | 2,334 (96.0%) | 97 (4.0%) |
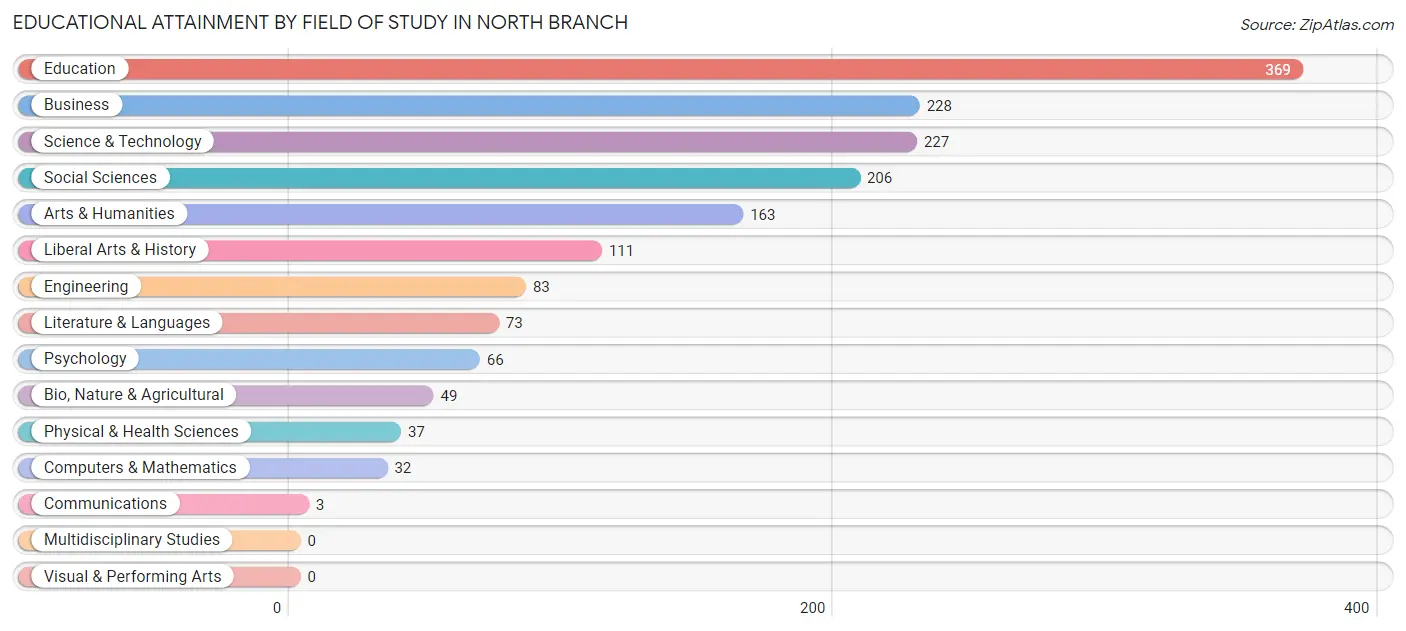
Educational Attainment by Field of Study in North Branch
Education (369 | 22.4%), business (228 | 13.8%), science & technology (227 | 13.8%), social sciences (206 | 12.5%), and arts & humanities (163 | 9.9%) are the most common fields of study among 1,647 individuals in North Branch who have obtained a bachelor's degree or higher.
| Field of Study | # Graduates | % Graduates |
| Computers & Mathematics | 32 | 1.9% |
| Bio, Nature & Agricultural | 49 | 3.0% |
| Physical & Health Sciences | 37 | 2.2% |
| Psychology | 66 | 4.0% |
| Social Sciences | 206 | 12.5% |
| Engineering | 83 | 5.0% |
| Multidisciplinary Studies | 0 | 0.0% |
| Science & Technology | 227 | 13.8% |
| Business | 228 | 13.8% |
| Education | 369 | 22.4% |
| Literature & Languages | 73 | 4.4% |
| Liberal Arts & History | 111 | 6.7% |
| Visual & Performing Arts | 0 | 0.0% |
| Communications | 3 | 0.2% |
| Arts & Humanities | 163 | 9.9% |
| Total | 1,647 | 100.0% |
Transportation & Commute in North Branch
Vehicle Availability by Sex in North Branch
The most prevalent vehicle ownership categories in North Branch are males with 2 vehicles (1,214, accounting for 38.0%) and females with 2 vehicles (927, making up 44.9%).
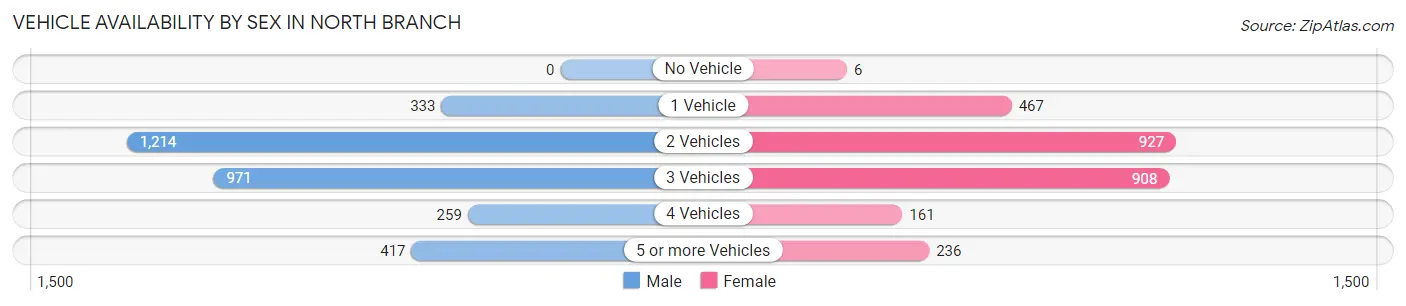
| Vehicles Available | Male | Female |
| No Vehicle | 0 (0.0%) | 6 (0.2%) |
| 1 Vehicle | 333 (10.4%) | 467 (17.3%) |
| 2 Vehicles | 1,214 (38.0%) | 927 (34.3%) |
| 3 Vehicles | 971 (30.4%) | 908 (33.6%) |
| 4 Vehicles | 259 (8.1%) | 161 (5.9%) |
| 5 or more Vehicles | 417 (13.1%) | 236 (8.7%) |
| Total | 3,194 (100.0%) | 2,705 (100.0%) |
Commute Time in North Branch
The most frequently occuring commute durations in North Branch are 45 to 59 minutes (1,036 commuters, 18.6%), 20 to 24 minutes (705 commuters, 12.7%), and 10 to 14 minutes (669 commuters, 12.0%).
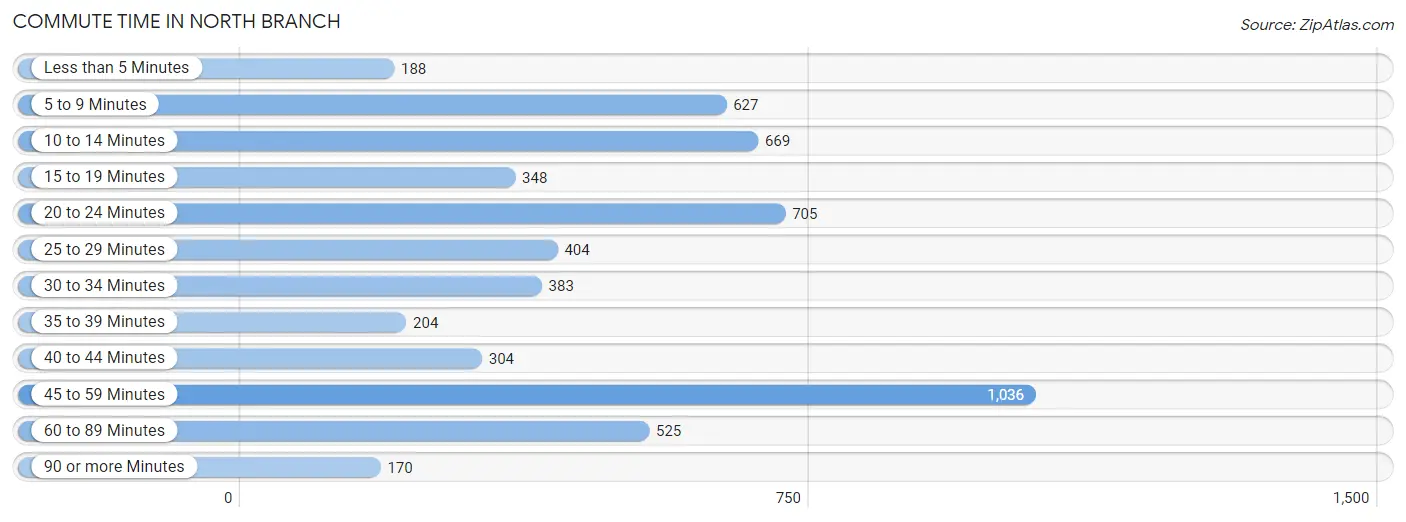
| Commute Time | # Commuters | % Commuters |
| Less than 5 Minutes | 188 | 3.4% |
| 5 to 9 Minutes | 627 | 11.3% |
| 10 to 14 Minutes | 669 | 12.0% |
| 15 to 19 Minutes | 348 | 6.3% |
| 20 to 24 Minutes | 705 | 12.7% |
| 25 to 29 Minutes | 404 | 7.3% |
| 30 to 34 Minutes | 383 | 6.9% |
| 35 to 39 Minutes | 204 | 3.7% |
| 40 to 44 Minutes | 304 | 5.5% |
| 45 to 59 Minutes | 1,036 | 18.6% |
| 60 to 89 Minutes | 525 | 9.4% |
| 90 or more Minutes | 170 | 3.1% |
Commute Time by Sex in North Branch
The most common commute times in North Branch are 45 to 59 minutes (658 commuters, 21.4%) for males and 20 to 24 minutes (400 commuters, 16.1%) for females.
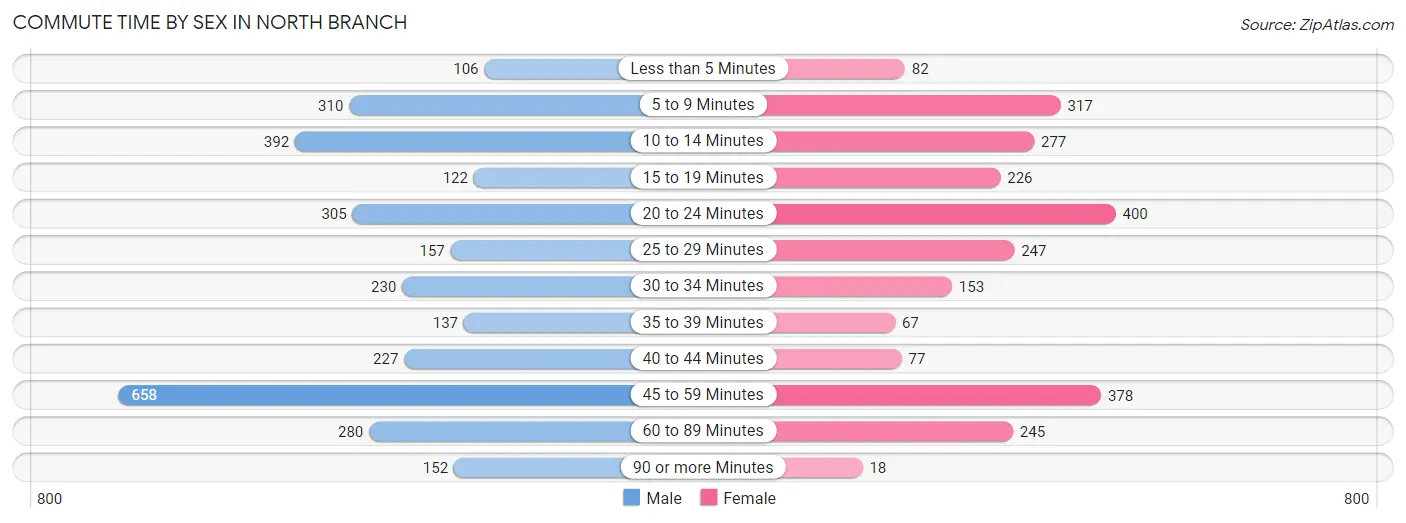
| Commute Time | Male | Female |
| Less than 5 Minutes | 106 (3.5%) | 82 (3.3%) |
| 5 to 9 Minutes | 310 (10.1%) | 317 (12.8%) |
| 10 to 14 Minutes | 392 (12.7%) | 277 (11.1%) |
| 15 to 19 Minutes | 122 (4.0%) | 226 (9.1%) |
| 20 to 24 Minutes | 305 (9.9%) | 400 (16.1%) |
| 25 to 29 Minutes | 157 (5.1%) | 247 (9.9%) |
| 30 to 34 Minutes | 230 (7.5%) | 153 (6.1%) |
| 35 to 39 Minutes | 137 (4.4%) | 67 (2.7%) |
| 40 to 44 Minutes | 227 (7.4%) | 77 (3.1%) |
| 45 to 59 Minutes | 658 (21.4%) | 378 (15.2%) |
| 60 to 89 Minutes | 280 (9.1%) | 245 (9.9%) |
| 90 or more Minutes | 152 (4.9%) | 18 (0.7%) |
Time of Departure to Work by Sex in North Branch
The most frequent times of departure to work in North Branch are 6:00 AM to 6:29 AM (488, 15.9%) for males and 7:00 AM to 7:29 AM (465, 18.7%) for females.
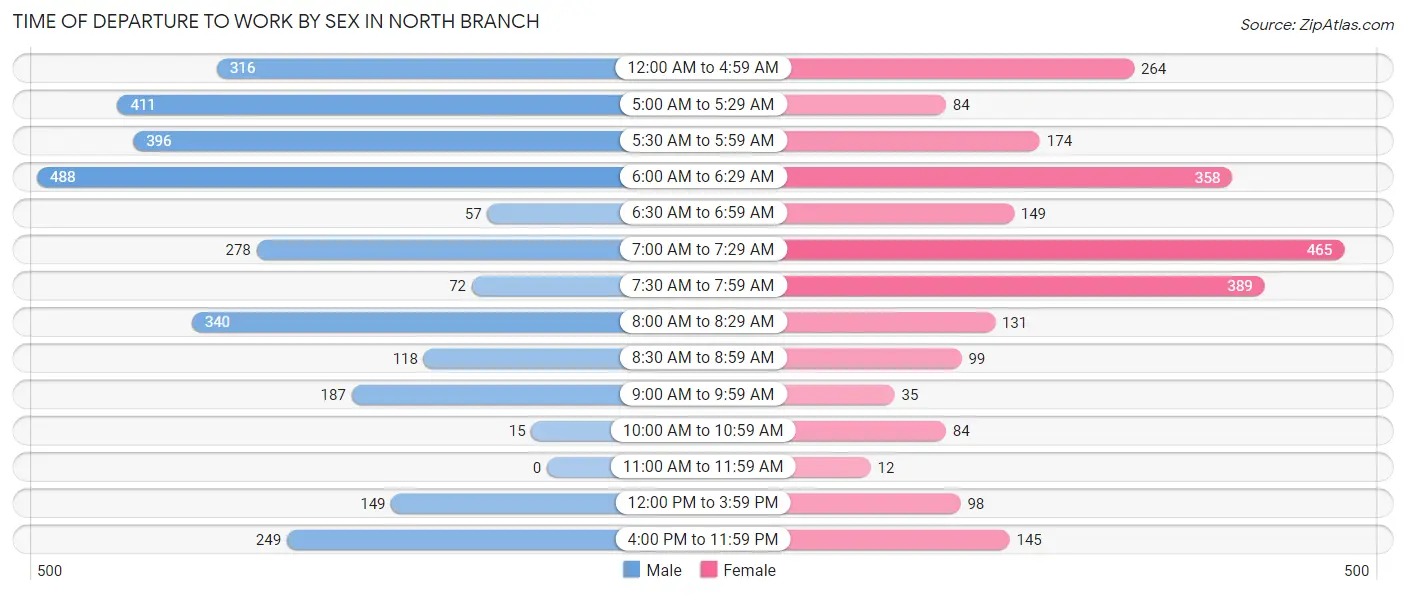
| Time of Departure | Male | Female |
| 12:00 AM to 4:59 AM | 316 (10.3%) | 264 (10.6%) |
| 5:00 AM to 5:29 AM | 411 (13.4%) | 84 (3.4%) |
| 5:30 AM to 5:59 AM | 396 (12.9%) | 174 (7.0%) |
| 6:00 AM to 6:29 AM | 488 (15.9%) | 358 (14.4%) |
| 6:30 AM to 6:59 AM | 57 (1.8%) | 149 (6.0%) |
| 7:00 AM to 7:29 AM | 278 (9.0%) | 465 (18.7%) |
| 7:30 AM to 7:59 AM | 72 (2.3%) | 389 (15.6%) |
| 8:00 AM to 8:29 AM | 340 (11.1%) | 131 (5.3%) |
| 8:30 AM to 8:59 AM | 118 (3.8%) | 99 (4.0%) |
| 9:00 AM to 9:59 AM | 187 (6.1%) | 35 (1.4%) |
| 10:00 AM to 10:59 AM | 15 (0.5%) | 84 (3.4%) |
| 11:00 AM to 11:59 AM | 0 (0.0%) | 12 (0.5%) |
| 12:00 PM to 3:59 PM | 149 (4.8%) | 98 (3.9%) |
| 4:00 PM to 11:59 PM | 249 (8.1%) | 145 (5.8%) |
| Total | 3,076 (100.0%) | 2,487 (100.0%) |
Housing Occupancy in North Branch
Occupancy by Ownership in North Branch
Of the total 4,221 dwellings in North Branch, owner-occupied units account for 3,547 (84.0%), while renter-occupied units make up 674 (16.0%).
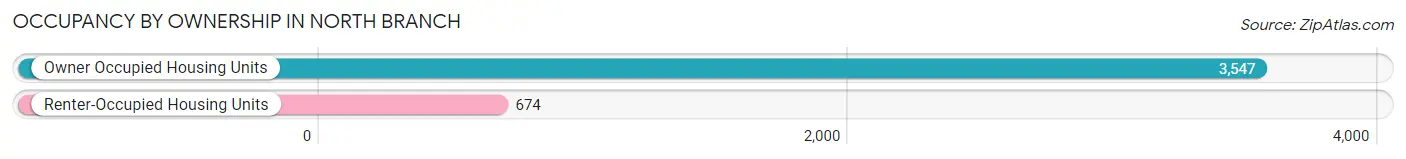
| Occupancy | # Housing Units | % Housing Units |
| Owner Occupied Housing Units | 3,547 | 84.0% |
| Renter-Occupied Housing Units | 674 | 16.0% |
| Total Occupied Housing Units | 4,221 | 100.0% |
Occupancy by Household Size in North Branch
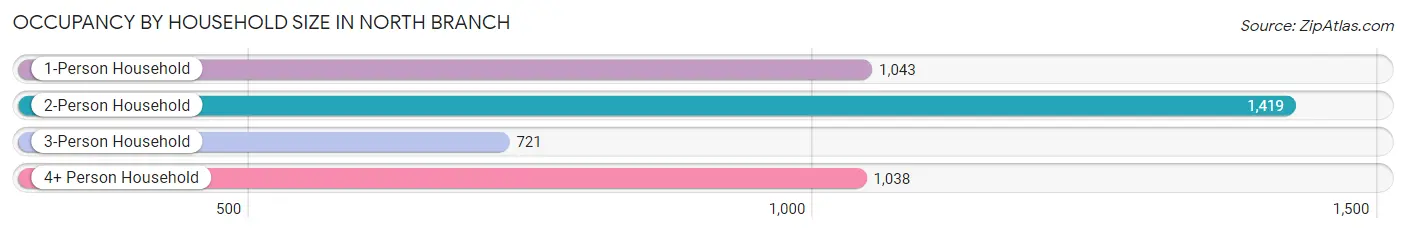
| Household Size | # Housing Units | % Housing Units |
| 1-Person Household | 1,043 | 24.7% |
| 2-Person Household | 1,419 | 33.6% |
| 3-Person Household | 721 | 17.1% |
| 4+ Person Household | 1,038 | 24.6% |
| Total Housing Units | 4,221 | 100.0% |
Occupancy by Ownership by Household Size in North Branch
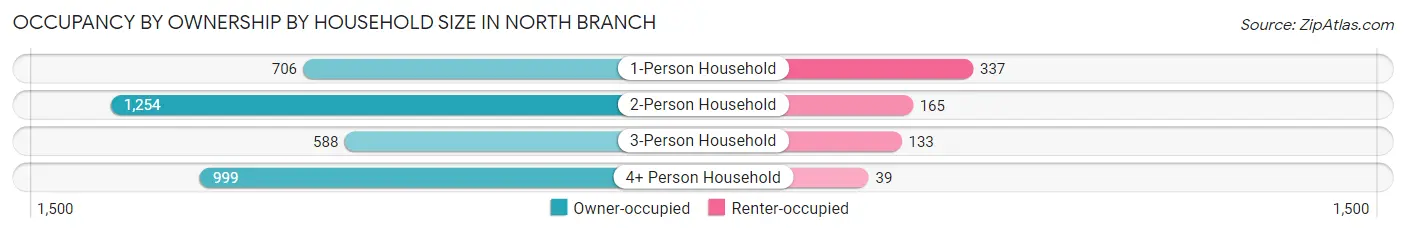
| Household Size | Owner-occupied | Renter-occupied |
| 1-Person Household | 706 (67.7%) | 337 (32.3%) |
| 2-Person Household | 1,254 (88.4%) | 165 (11.6%) |
| 3-Person Household | 588 (81.6%) | 133 (18.4%) |
| 4+ Person Household | 999 (96.2%) | 39 (3.8%) |
| Total Housing Units | 3,547 (84.0%) | 674 (16.0%) |
Occupancy by Educational Attainment in North Branch
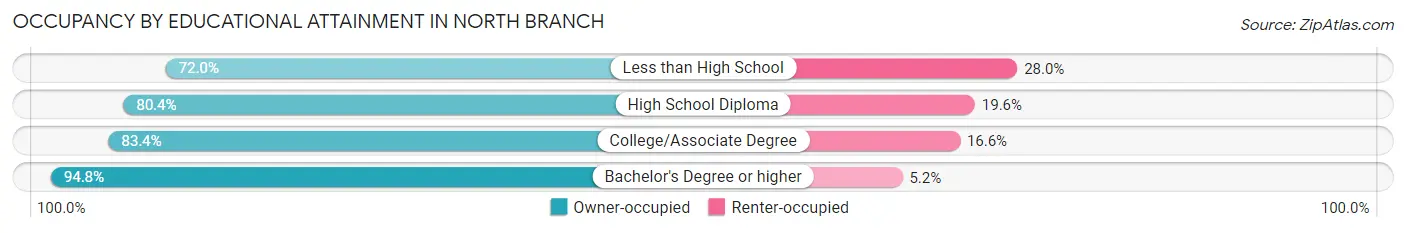
| Household Size | Owner-occupied | Renter-occupied |
| Less than High School | 152 (72.0%) | 59 (28.0%) |
| High School Diploma | 1,110 (80.4%) | 270 (19.6%) |
| College/Associate Degree | 1,521 (83.4%) | 303 (16.6%) |
| Bachelor's Degree or higher | 764 (94.8%) | 42 (5.2%) |
Occupancy by Age of Householder in North Branch
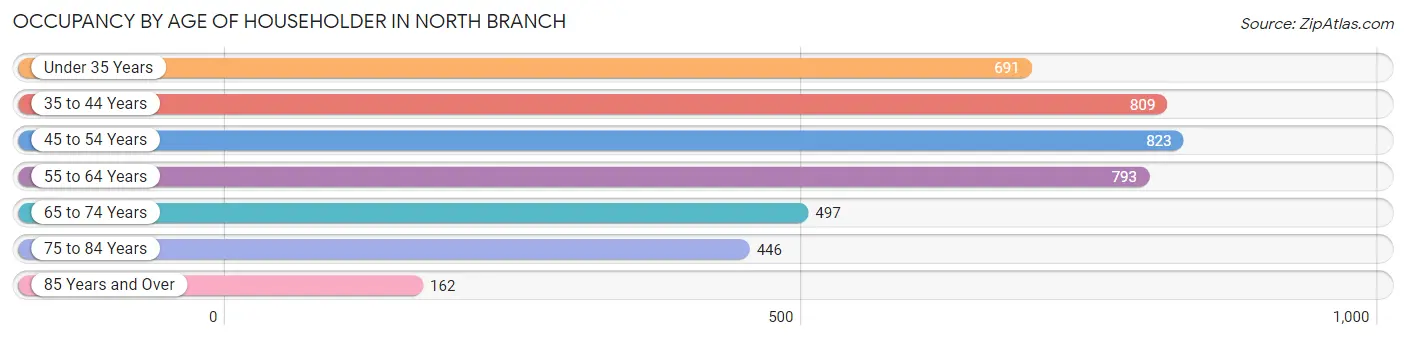
| Age Bracket | # Households | % Households |
| Under 35 Years | 691 | 16.4% |
| 35 to 44 Years | 809 | 19.2% |
| 45 to 54 Years | 823 | 19.5% |
| 55 to 64 Years | 793 | 18.8% |
| 65 to 74 Years | 497 | 11.8% |
| 75 to 84 Years | 446 | 10.6% |
| 85 Years and Over | 162 | 3.8% |
| Total | 4,221 | 100.0% |
Housing Finances in North Branch
Median Income by Occupancy in North Branch
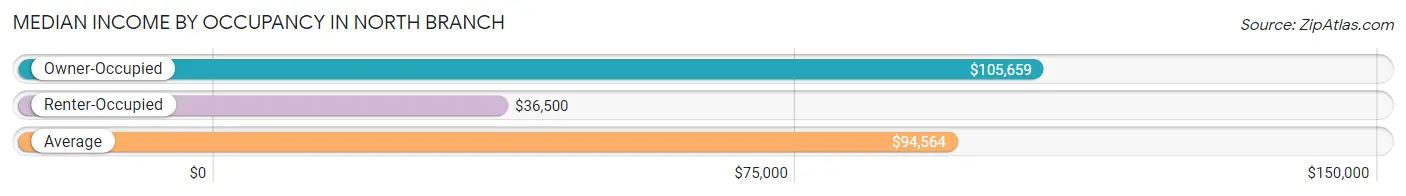
| Occupancy Type | # Households | Median Income |
| Owner-Occupied | 3,547 (84.0%) | $105,659 |
| Renter-Occupied | 674 (16.0%) | $36,500 |
| Average | 4,221 (100.0%) | $94,564 |
Occupancy by Householder Income Bracket in North Branch
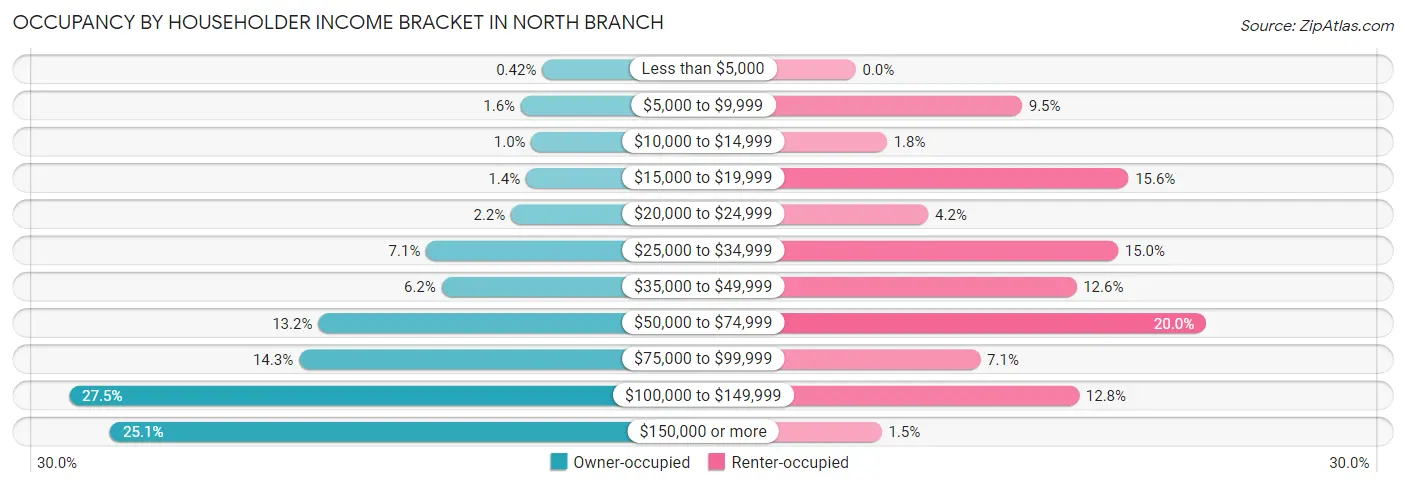
| Income Bracket | Owner-occupied | Renter-occupied |
| Less than $5,000 | 15 (0.4%) | 0 (0.0%) |
| $5,000 to $9,999 | 58 (1.6%) | 64 (9.5%) |
| $10,000 to $14,999 | 37 (1.0%) | 12 (1.8%) |
| $15,000 to $19,999 | 48 (1.3%) | 105 (15.6%) |
| $20,000 to $24,999 | 78 (2.2%) | 28 (4.2%) |
| $25,000 to $34,999 | 250 (7.0%) | 101 (15.0%) |
| $35,000 to $49,999 | 219 (6.2%) | 85 (12.6%) |
| $50,000 to $74,999 | 469 (13.2%) | 135 (20.0%) |
| $75,000 to $99,999 | 508 (14.3%) | 48 (7.1%) |
| $100,000 to $149,999 | 974 (27.5%) | 86 (12.8%) |
| $150,000 or more | 891 (25.1%) | 10 (1.5%) |
| Total | 3,547 (100.0%) | 674 (100.0%) |
Monthly Housing Cost Tiers in North Branch
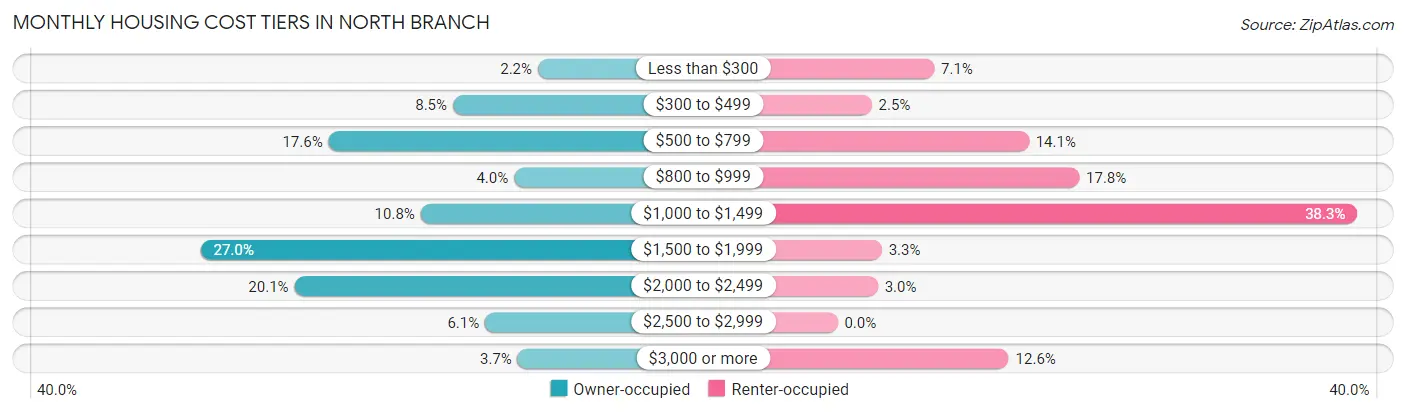
| Monthly Cost | Owner-occupied | Renter-occupied |
| Less than $300 | 78 (2.2%) | 48 (7.1%) |
| $300 to $499 | 300 (8.5%) | 17 (2.5%) |
| $500 to $799 | 625 (17.6%) | 95 (14.1%) |
| $800 to $999 | 140 (4.0%) | 120 (17.8%) |
| $1,000 to $1,499 | 384 (10.8%) | 258 (38.3%) |
| $1,500 to $1,999 | 959 (27.0%) | 22 (3.3%) |
| $2,000 to $2,499 | 714 (20.1%) | 20 (3.0%) |
| $2,500 to $2,999 | 216 (6.1%) | 0 (0.0%) |
| $3,000 or more | 131 (3.7%) | 85 (12.6%) |
| Total | 3,547 (100.0%) | 674 (100.0%) |
Physical Housing Characteristics in North Branch
Housing Structures in North Branch
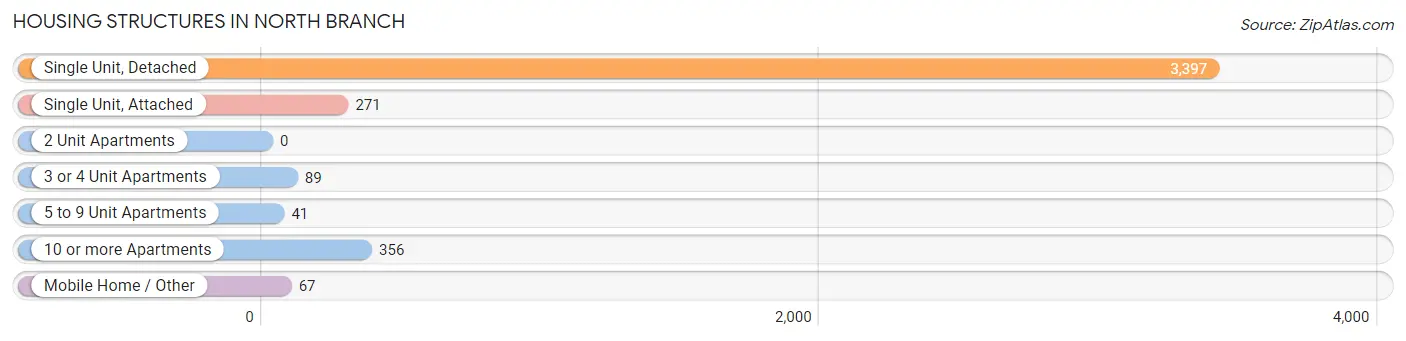
| Structure Type | # Housing Units | % Housing Units |
| Single Unit, Detached | 3,397 | 80.5% |
| Single Unit, Attached | 271 | 6.4% |
| 2 Unit Apartments | 0 | 0.0% |
| 3 or 4 Unit Apartments | 89 | 2.1% |
| 5 to 9 Unit Apartments | 41 | 1.0% |
| 10 or more Apartments | 356 | 8.4% |
| Mobile Home / Other | 67 | 1.6% |
| Total | 4,221 | 100.0% |
Housing Structures by Occupancy in North Branch
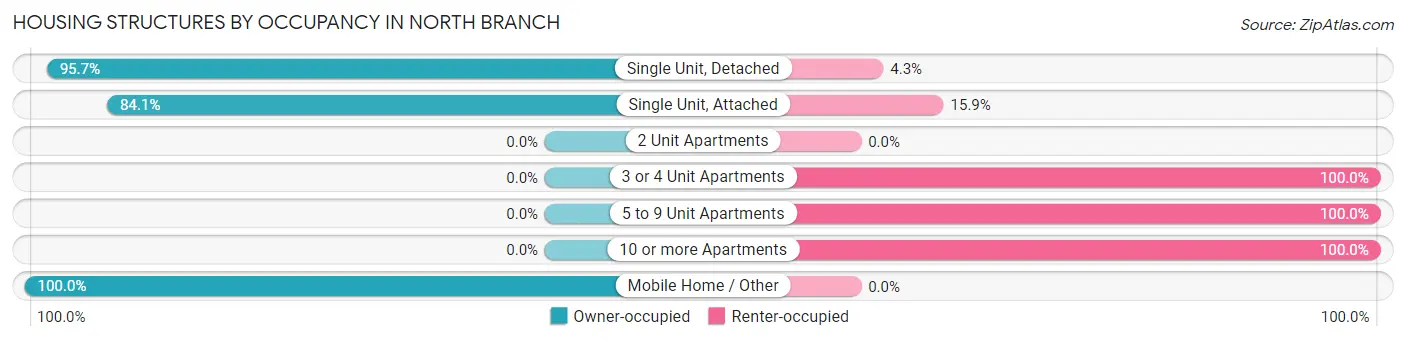
| Structure Type | Owner-occupied | Renter-occupied |
| Single Unit, Detached | 3,252 (95.7%) | 145 (4.3%) |
| Single Unit, Attached | 228 (84.1%) | 43 (15.9%) |
| 2 Unit Apartments | 0 (0.0%) | 0 (0.0%) |
| 3 or 4 Unit Apartments | 0 (0.0%) | 89 (100.0%) |
| 5 to 9 Unit Apartments | 0 (0.0%) | 41 (100.0%) |
| 10 or more Apartments | 0 (0.0%) | 356 (100.0%) |
| Mobile Home / Other | 67 (100.0%) | 0 (0.0%) |
| Total | 3,547 (84.0%) | 674 (16.0%) |
Housing Structures by Number of Rooms in North Branch
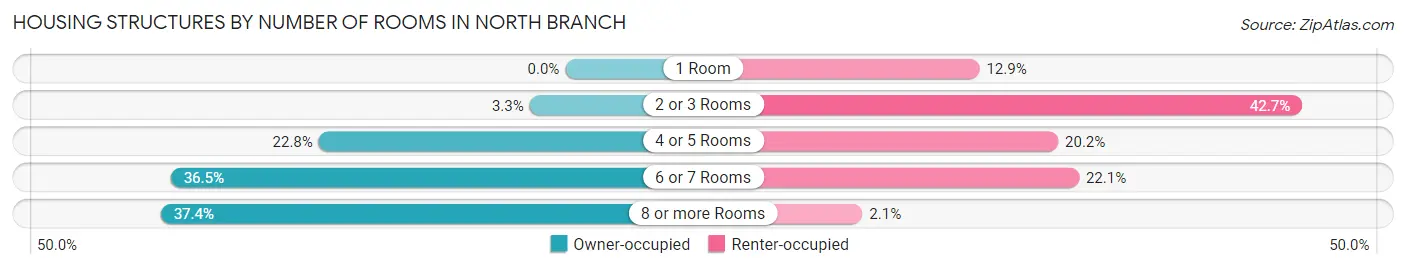
| Number of Rooms | Owner-occupied | Renter-occupied |
| 1 Room | 0 (0.0%) | 87 (12.9%) |
| 2 or 3 Rooms | 117 (3.3%) | 288 (42.7%) |
| 4 or 5 Rooms | 809 (22.8%) | 136 (20.2%) |
| 6 or 7 Rooms | 1,294 (36.5%) | 149 (22.1%) |
| 8 or more Rooms | 1,327 (37.4%) | 14 (2.1%) |
| Total | 3,547 (100.0%) | 674 (100.0%) |
Housing Structure by Heating Type in North Branch
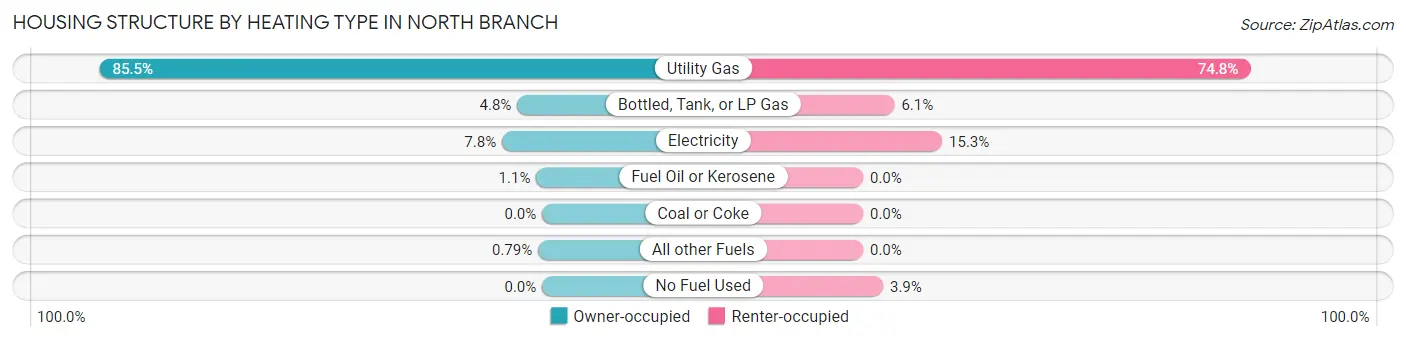
| Heating Type | Owner-occupied | Renter-occupied |
| Utility Gas | 3,033 (85.5%) | 504 (74.8%) |
| Bottled, Tank, or LP Gas | 171 (4.8%) | 41 (6.1%) |
| Electricity | 275 (7.7%) | 103 (15.3%) |
| Fuel Oil or Kerosene | 40 (1.1%) | 0 (0.0%) |
| Coal or Coke | 0 (0.0%) | 0 (0.0%) |
| All other Fuels | 28 (0.8%) | 0 (0.0%) |
| No Fuel Used | 0 (0.0%) | 26 (3.9%) |
| Total | 3,547 (100.0%) | 674 (100.0%) |
Household Vehicle Usage in North Branch
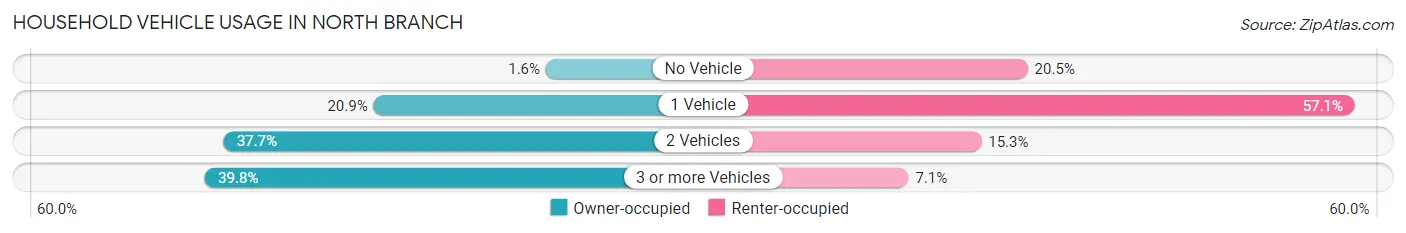
| Vehicles per Household | Owner-occupied | Renter-occupied |
| No Vehicle | 57 (1.6%) | 138 (20.5%) |
| 1 Vehicle | 742 (20.9%) | 385 (57.1%) |
| 2 Vehicles | 1,337 (37.7%) | 103 (15.3%) |
| 3 or more Vehicles | 1,411 (39.8%) | 48 (7.1%) |
| Total | 3,547 (100.0%) | 674 (100.0%) |
Real Estate & Mortgages in North Branch
Real Estate and Mortgage Overview in North Branch
| Characteristic | Without Mortgage | With Mortgage |
| Housing Units | 1,013 | 2,534 |
| Median Property Value | $215,000 | $284,100 |
| Median Household Income | $65,655 | $734 |
| Monthly Housing Costs | $577 | $131 |
| Real Estate Taxes | $2,608 | $15 |
Property Value by Mortgage Status in North Branch
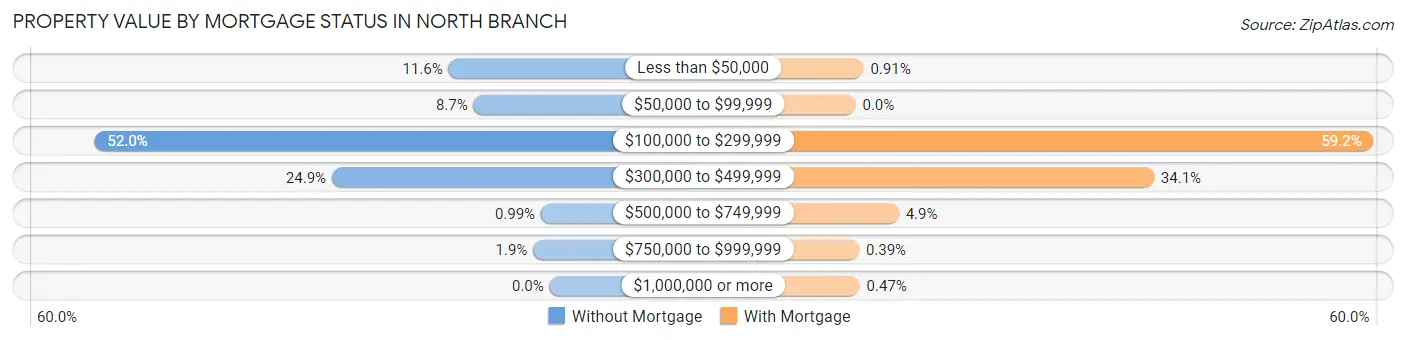
| Property Value | Without Mortgage | With Mortgage |
| Less than $50,000 | 117 (11.6%) | 23 (0.9%) |
| $50,000 to $99,999 | 88 (8.7%) | 0 (0.0%) |
| $100,000 to $299,999 | 527 (52.0%) | 1,500 (59.2%) |
| $300,000 to $499,999 | 252 (24.9%) | 864 (34.1%) |
| $500,000 to $749,999 | 10 (1.0%) | 125 (4.9%) |
| $750,000 to $999,999 | 19 (1.9%) | 10 (0.4%) |
| $1,000,000 or more | 0 (0.0%) | 12 (0.5%) |
| Total | 1,013 (100.0%) | 2,534 (100.0%) |
Household Income by Mortgage Status in North Branch
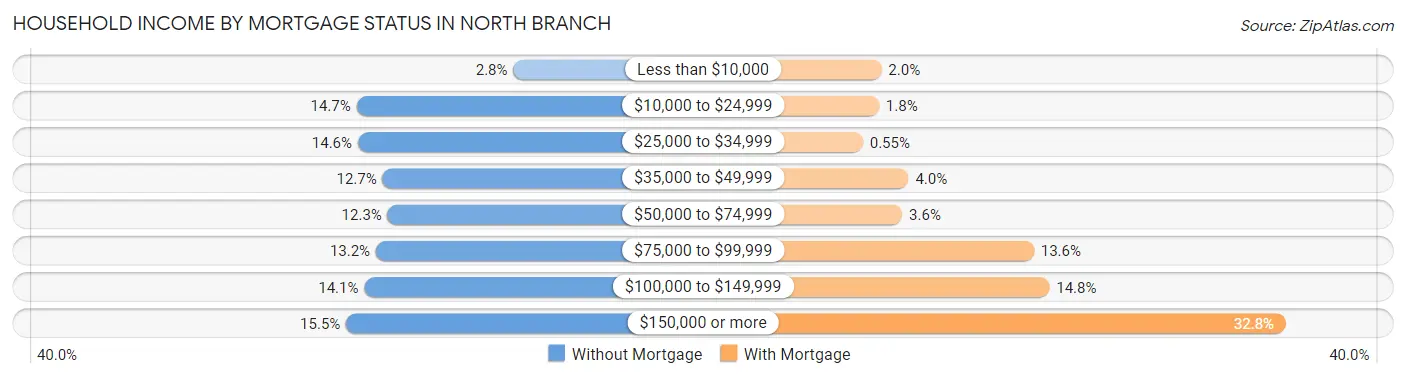
| Household Income | Without Mortgage | With Mortgage |
| Less than $10,000 | 28 (2.8%) | 50 (2.0%) |
| $10,000 to $24,999 | 149 (14.7%) | 45 (1.8%) |
| $25,000 to $34,999 | 148 (14.6%) | 14 (0.5%) |
| $35,000 to $49,999 | 129 (12.7%) | 102 (4.0%) |
| $50,000 to $74,999 | 125 (12.3%) | 90 (3.5%) |
| $75,000 to $99,999 | 134 (13.2%) | 344 (13.6%) |
| $100,000 to $149,999 | 143 (14.1%) | 374 (14.8%) |
| $150,000 or more | 157 (15.5%) | 831 (32.8%) |
| Total | 1,013 (100.0%) | 2,534 (100.0%) |
Property Value to Household Income Ratio in North Branch
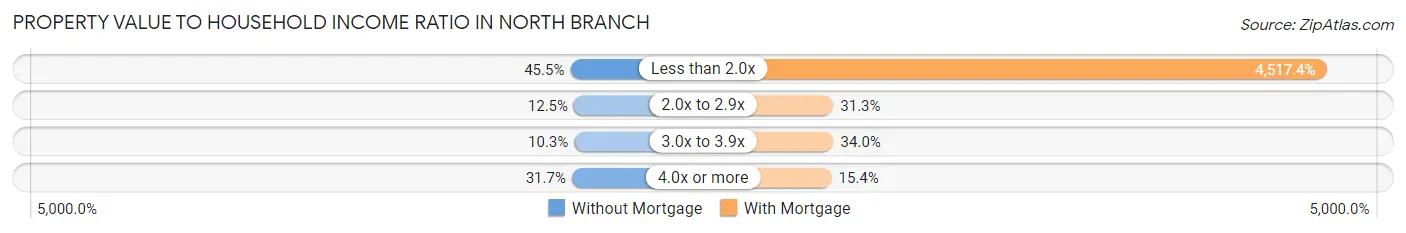
| Value-to-Income Ratio | Without Mortgage | With Mortgage |
| Less than 2.0x | 461 (45.5%) | 114,472 (4,517.4%) |
| 2.0x to 2.9x | 127 (12.5%) | 793 (31.3%) |
| 3.0x to 3.9x | 104 (10.3%) | 861 (34.0%) |
| 4.0x or more | 321 (31.7%) | 390 (15.4%) |
| Total | 1,013 (100.0%) | 2,534 (100.0%) |
Real Estate Taxes by Mortgage Status in North Branch
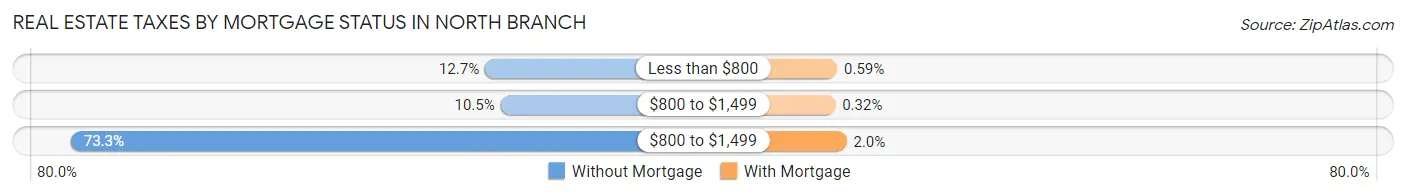
| Property Taxes | Without Mortgage | With Mortgage |
| Less than $800 | 129 (12.7%) | 15 (0.6%) |
| $800 to $1,499 | 106 (10.5%) | 8 (0.3%) |
| $800 to $1,499 | 742 (73.3%) | 50 (2.0%) |
| Total | 1,013 (100.0%) | 2,534 (100.0%) |
Health & Disability in North Branch
Health Insurance Coverage by Age in North Branch
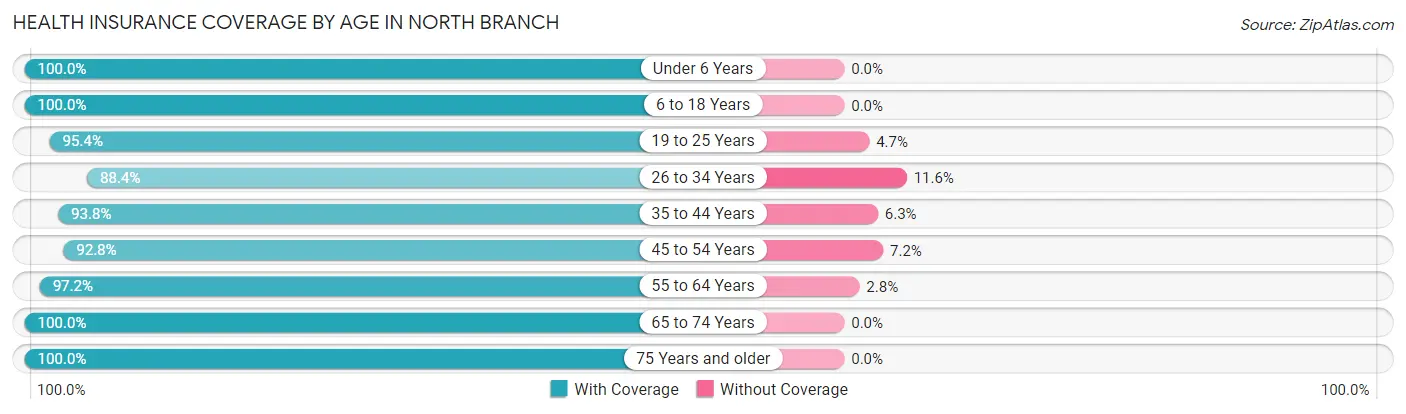
| Age Bracket | With Coverage | Without Coverage |
| Under 6 Years | 617 (100.0%) | 0 (0.0%) |
| 6 to 18 Years | 1,997 (100.0%) | 0 (0.0%) |
| 19 to 25 Years | 697 (95.4%) | 34 (4.6%) |
| 26 to 34 Years | 1,192 (88.4%) | 157 (11.6%) |
| 35 to 44 Years | 1,574 (93.8%) | 105 (6.2%) |
| 45 to 54 Years | 1,447 (92.8%) | 113 (7.2%) |
| 55 to 64 Years | 1,346 (97.2%) | 39 (2.8%) |
| 65 to 74 Years | 781 (100.0%) | 0 (0.0%) |
| 75 Years and older | 778 (100.0%) | 0 (0.0%) |
| Total | 10,429 (95.9%) | 448 (4.1%) |
Health Insurance Coverage by Citizenship Status in North Branch
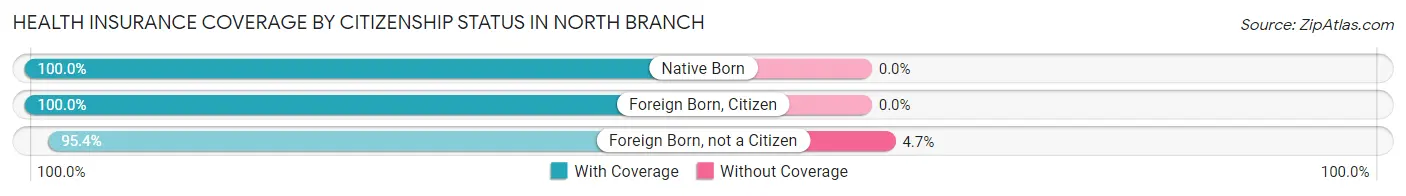
| Citizenship Status | With Coverage | Without Coverage |
| Native Born | 617 (100.0%) | 0 (0.0%) |
| Foreign Born, Citizen | 1,997 (100.0%) | 0 (0.0%) |
| Foreign Born, not a Citizen | 697 (95.4%) | 34 (4.6%) |
Health Insurance Coverage by Household Income in North Branch
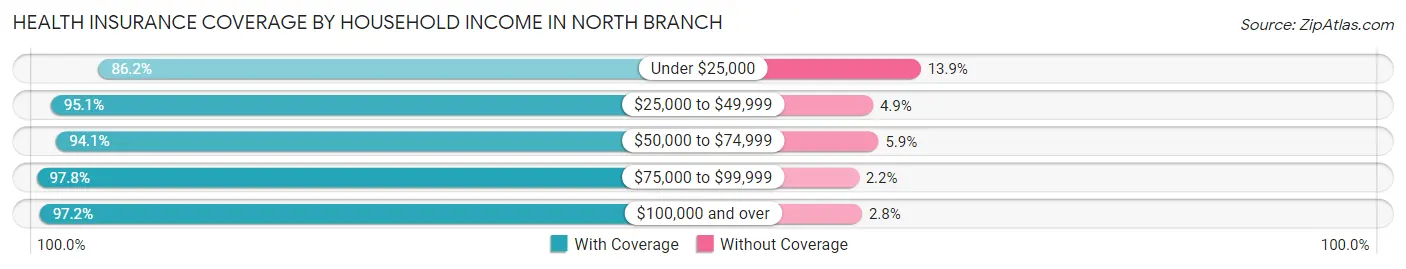
| Household Income | With Coverage | Without Coverage |
| Under $25,000 | 678 (86.2%) | 109 (13.9%) |
| $25,000 to $49,999 | 852 (95.1%) | 44 (4.9%) |
| $50,000 to $74,999 | 1,363 (94.1%) | 86 (5.9%) |
| $75,000 to $99,999 | 1,270 (97.8%) | 29 (2.2%) |
| $100,000 and over | 6,152 (97.2%) | 180 (2.8%) |
Public vs Private Health Insurance Coverage by Age in North Branch
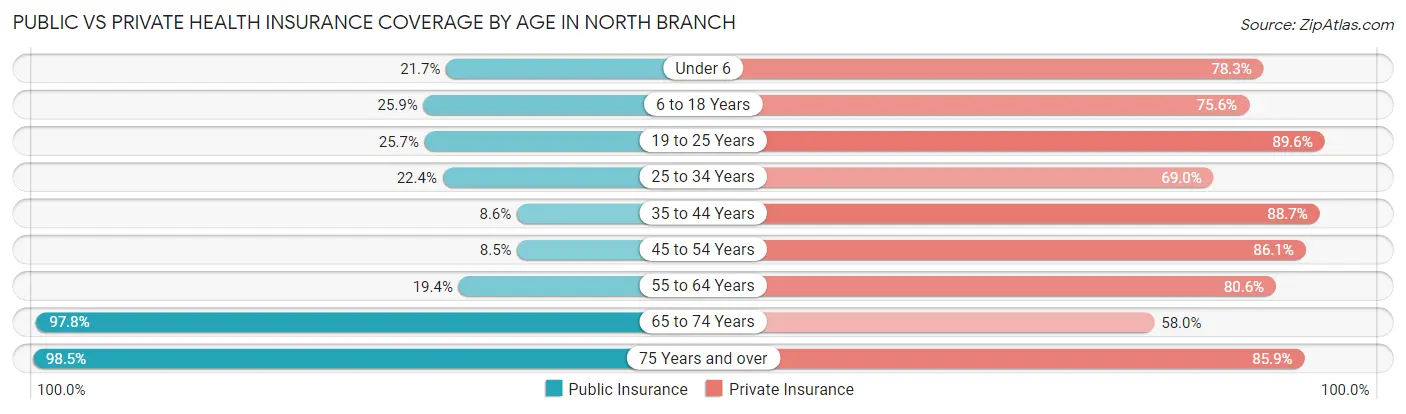
| Age Bracket | Public Insurance | Private Insurance |
| Under 6 | 134 (21.7%) | 483 (78.3%) |
| 6 to 18 Years | 518 (25.9%) | 1,509 (75.6%) |
| 19 to 25 Years | 188 (25.7%) | 655 (89.6%) |
| 25 to 34 Years | 302 (22.4%) | 931 (69.0%) |
| 35 to 44 Years | 144 (8.6%) | 1,489 (88.7%) |
| 45 to 54 Years | 133 (8.5%) | 1,343 (86.1%) |
| 55 to 64 Years | 269 (19.4%) | 1,116 (80.6%) |
| 65 to 74 Years | 764 (97.8%) | 453 (58.0%) |
| 75 Years and over | 766 (98.5%) | 668 (85.9%) |
| Total | 3,218 (29.6%) | 8,647 (79.5%) |
Disability Status by Sex by Age in North Branch
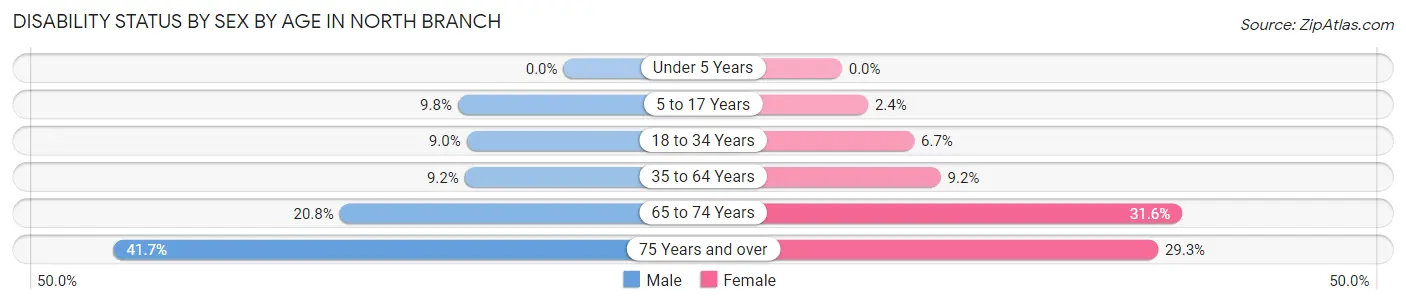
| Age Bracket | Male | Female |
| Under 5 Years | 0 (0.0%) | 0 (0.0%) |
| 5 to 17 Years | 96 (9.8%) | 23 (2.4%) |
| 18 to 34 Years | 101 (9.0%) | 77 (6.7%) |
| 35 to 64 Years | 227 (9.2%) | 197 (9.2%) |
| 65 to 74 Years | 76 (20.8%) | 131 (31.6%) |
| 75 Years and over | 154 (41.7%) | 120 (29.3%) |
Disability Class by Sex by Age in North Branch
Disability Class: Hearing Difficulty
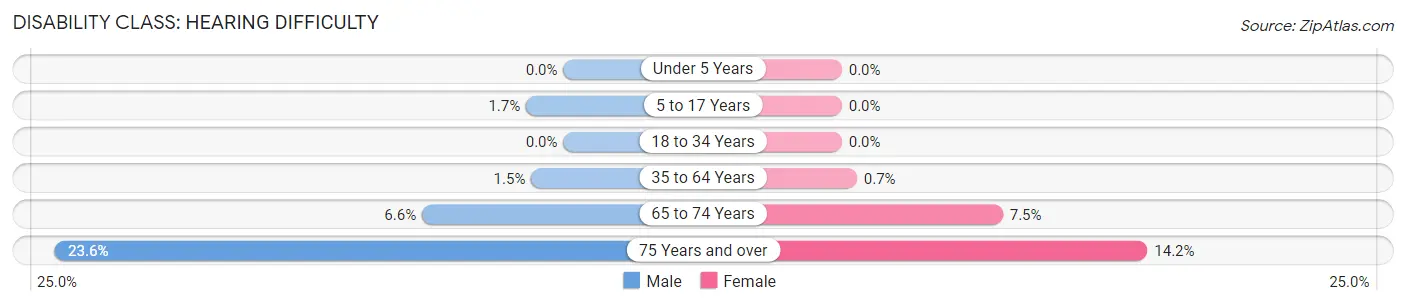
| Age Bracket | Male | Female |
| Under 5 Years | 0 (0.0%) | 0 (0.0%) |
| 5 to 17 Years | 17 (1.7%) | 0 (0.0%) |
| 18 to 34 Years | 0 (0.0%) | 0 (0.0%) |
| 35 to 64 Years | 37 (1.5%) | 15 (0.7%) |
| 65 to 74 Years | 24 (6.6%) | 31 (7.5%) |
| 75 Years and over | 87 (23.6%) | 58 (14.2%) |
Disability Class: Vision Difficulty
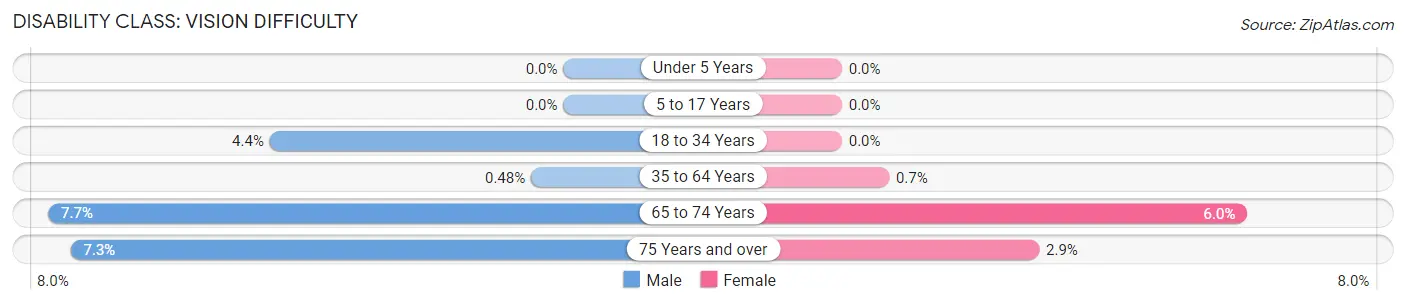
| Age Bracket | Male | Female |
| Under 5 Years | 0 (0.0%) | 0 (0.0%) |
| 5 to 17 Years | 0 (0.0%) | 0 (0.0%) |
| 18 to 34 Years | 49 (4.4%) | 0 (0.0%) |
| 35 to 64 Years | 12 (0.5%) | 15 (0.7%) |
| 65 to 74 Years | 28 (7.6%) | 25 (6.0%) |
| 75 Years and over | 27 (7.3%) | 12 (2.9%) |
Disability Class: Cognitive Difficulty
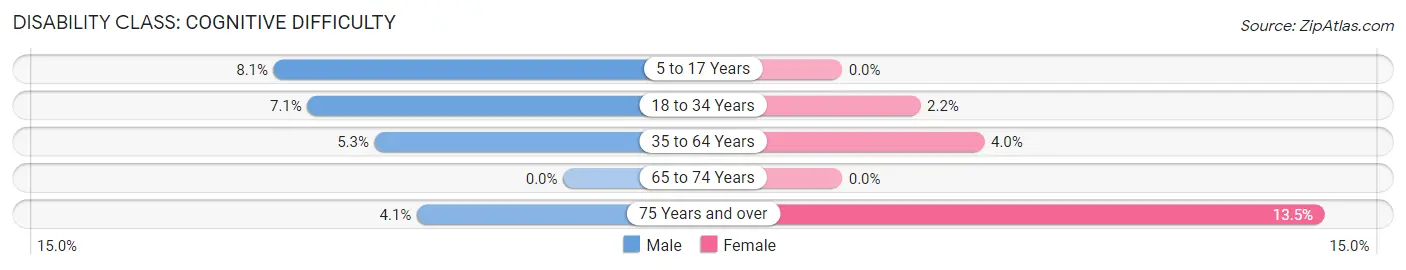
| Age Bracket | Male | Female |
| 5 to 17 Years | 79 (8.1%) | 0 (0.0%) |
| 18 to 34 Years | 80 (7.1%) | 25 (2.2%) |
| 35 to 64 Years | 130 (5.2%) | 85 (4.0%) |
| 65 to 74 Years | 0 (0.0%) | 0 (0.0%) |
| 75 Years and over | 15 (4.1%) | 55 (13.5%) |
Disability Class: Ambulatory Difficulty
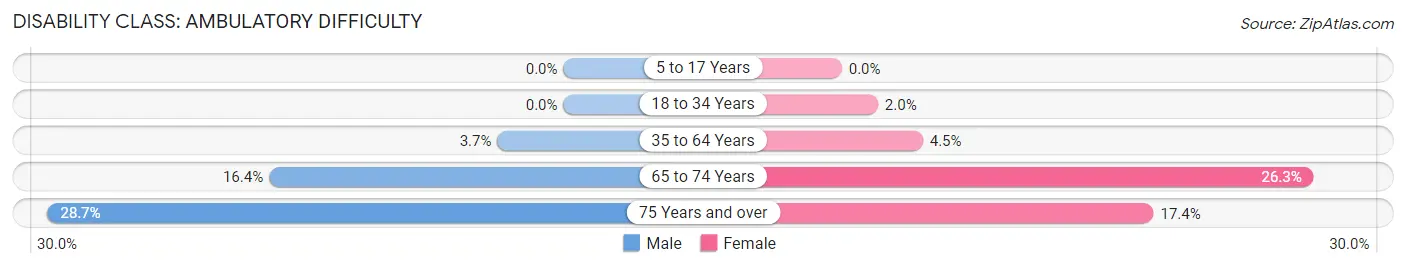
| Age Bracket | Male | Female |
| 5 to 17 Years | 0 (0.0%) | 0 (0.0%) |
| 18 to 34 Years | 0 (0.0%) | 23 (2.0%) |
| 35 to 64 Years | 91 (3.7%) | 97 (4.5%) |
| 65 to 74 Years | 60 (16.4%) | 109 (26.3%) |
| 75 Years and over | 106 (28.7%) | 71 (17.4%) |
Disability Class: Self-Care Difficulty
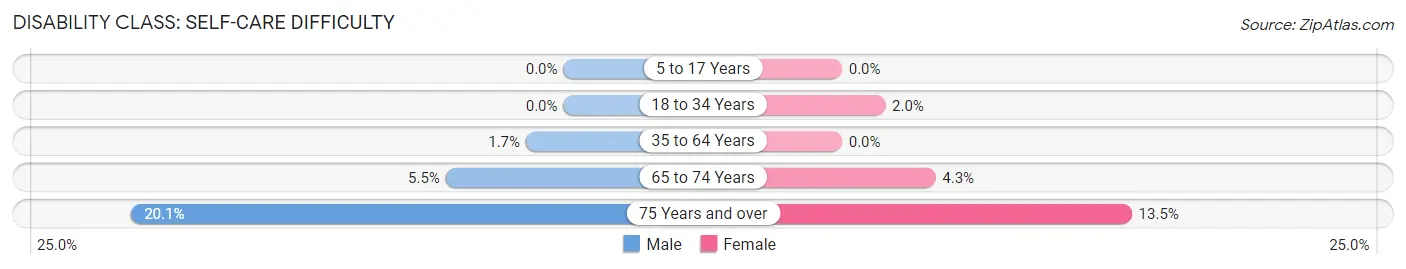
| Age Bracket | Male | Female |
| 5 to 17 Years | 0 (0.0%) | 0 (0.0%) |
| 18 to 34 Years | 0 (0.0%) | 23 (2.0%) |
| 35 to 64 Years | 43 (1.7%) | 0 (0.0%) |
| 65 to 74 Years | 20 (5.5%) | 18 (4.3%) |
| 75 Years and over | 74 (20.1%) | 55 (13.5%) |
Technology Access in North Branch
Computing Device Access in North Branch
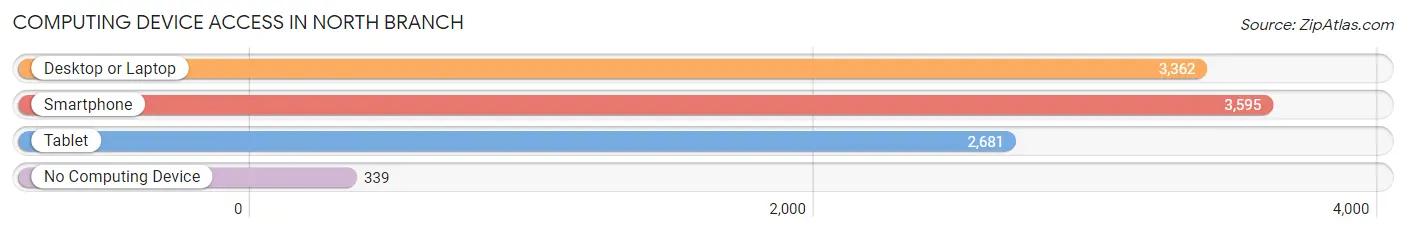
| Device Type | # Households | % Households |
| Desktop or Laptop | 3,362 | 79.6% |
| Smartphone | 3,595 | 85.2% |
| Tablet | 2,681 | 63.5% |
| No Computing Device | 339 | 8.0% |
| Total | 4,221 | 100.0% |
Internet Access in North Branch
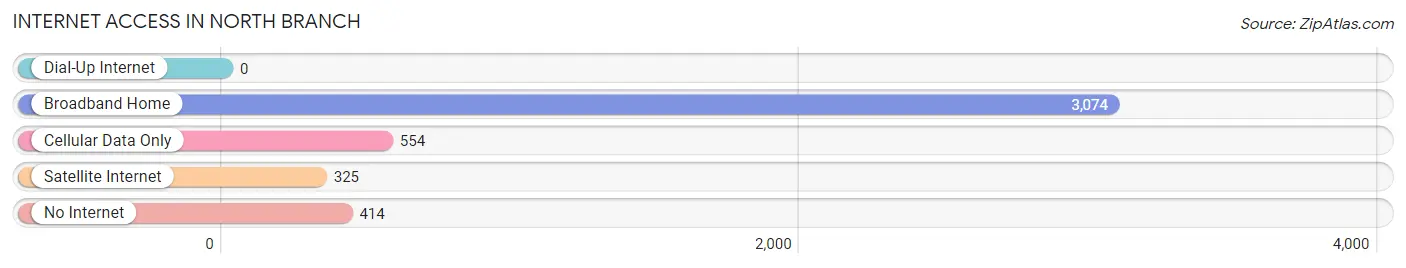
| Internet Type | # Households | % Households |
| Dial-Up Internet | 0 | 0.0% |
| Broadband Home | 3,074 | 72.8% |
| Cellular Data Only | 554 | 13.1% |
| Satellite Internet | 325 | 7.7% |
| No Internet | 414 | 9.8% |
| Total | 4,221 | 100.0% |
North Branch Summary
History
North Branch, Minnesota is a small city located in Chisago County, about 40 miles north of Minneapolis. The city was founded in 1856 by a group of settlers from Sweden, who named it after the North Branch of the Sunrise River. The city was incorporated in 1887 and has since grown to a population of over 10,000 people.
The city has a rich history of Swedish heritage, which is still evident today. The city is home to the Swedish Immigrant Trail, a historic walking tour that highlights the city’s Swedish roots. The city also hosts the annual Swedish Festival, which celebrates the city’s Swedish heritage with traditional music, food, and activities.
Geography
North Branch is located in the northern part of Chisago County, about 40 miles north of Minneapolis. The city is situated on the North Branch of the Sunrise River, which flows through the city and provides a scenic backdrop. The city is surrounded by rolling hills and forests, and is home to several lakes, including Sunrise Lake, North Branch Lake, and Chisago Lake.
The city has a total area of 8.3 square miles, of which 8.2 square miles is land and 0.1 square miles is water. The city has a humid continental climate, with cold winters and warm summers.
Economy
North Branch’s economy is largely based on agriculture and manufacturing. The city is home to several large agricultural operations, including dairy farms, grain farms, and vegetable farms. The city is also home to several manufacturing companies, including a paper mill, a plastics factory, and a furniture factory.
The city is also home to several retail stores, restaurants, and other businesses. The city is home to several large employers, including the North Branch School District, the Chisago County Government, and the North Branch Medical Center.
Demographics
As of the 2010 census, the population of North Branch was 10,125. The racial makeup of the city was 94.3% White, 0.7% African American, 0.3% Native American, 0.7% Asian, 0.1% Pacific Islander, 2.2% from other races, and 1.9% from two or more races. Hispanic or Latino of any race were 4.3% of the population.
The median income for a household in the city was $50,945, and the median income for a family was $60,945. The per capita income for the city was $22,945. About 6.3% of families and 8.3% of the population were below the poverty line, including 10.3% of those under age 18 and 6.3% of those age 65 or over.
North Branch is a small city with a rich history and a diverse economy. The city is home to several large employers, and is a popular destination for tourists looking to explore the city’s Swedish heritage. The city is also home to several lakes and forests, making it a great place to live and visit.
Common Questions
What is Per Capita Income in North Branch?
Per Capita income in North Branch is $44,360.
What is the Median Family Income in North Branch?
Median Family Income in North Branch is $113,060.
What is the Median Household income in North Branch?
Median Household Income in North Branch is $94,564.
What is Income or Wage Gap in North Branch?
Income or Wage Gap in North Branch is 26.7%.
Women in North Branch earn 73.3 cents for every dollar earned by a man.
What is Inequality or Gini Index in North Branch?
Inequality or Gini Index in North Branch is 0.43.
What is the Total Population of North Branch?
Total Population of North Branch is 10,968.
What is the Total Male Population of North Branch?
Total Male Population of North Branch is 5,634.
What is the Total Female Population of North Branch?
Total Female Population of North Branch is 5,334.
What is the Ratio of Males per 100 Females in North Branch?
There are 105.62 Males per 100 Females in North Branch.
What is the Ratio of Females per 100 Males in North Branch?
There are 94.68 Females per 100 Males in North Branch.
What is the Median Population Age in North Branch?
Median Population Age in North Branch is 39.9 Years.
What is the Average Family Size in North Branch
Average Family Size in North Branch is 3.1 People.
What is the Average Household Size in North Branch
Average Household Size in North Branch is 2.5 People.
How Large is the Labor Force in North Branch?
There are 6,208 People in the Labor Forcein in North Branch.
What is the Percentage of People in the Labor Force in North Branch?
70.5% of People are in the Labor Force in North Branch.
What is the Unemployment Rate in North Branch?
Unemployment Rate in North Branch is 3.7%.