Rushford, MN Map & Demographics
Rushford Map
Rushford Overview
$32,936
PER CAPITA INCOME
$104,028
AVG FAMILY INCOME
$70,543
AVG HOUSEHOLD INCOME
20.7%
WAGE / INCOME GAP [ % ]
79.3¢/ $1
WAGE / INCOME GAP [ $ ]
$16,317
FAMILY INCOME DEFICIT
0.37
INEQUALITY / GINI INDEX
1,816
TOTAL POPULATION
861
MALE POPULATION
955
FEMALE POPULATION
90.16
MALES / 100 FEMALES
110.92
FEMALES / 100 MALES
41.8
MEDIAN AGE
2.9
AVG FAMILY SIZE
2.4
AVG HOUSEHOLD SIZE
909
LABOR FORCE [ PEOPLE ]
65.1%
PERCENT IN LABOR FORCE
3.6%
UNEMPLOYMENT RATE
Rushford Zip Codes
Rushford Area Codes
Income in Rushford
Income Overview in Rushford
Per Capita Income in Rushford is $32,936, while median incomes of families and households are $104,028 and $70,543 respectively.
| Characteristic | Number | Measure |
| Per Capita Income | 1,816 | $32,936 |
| Median Family Income | 491 | $104,028 |
| Mean Family Income | 491 | $95,313 |
| Median Household Income | 728 | $70,543 |
| Mean Household Income | 728 | $80,358 |
| Income Deficit | 491 | $16,317 |
| Wage / Income Gap (%) | 1,816 | 20.68% |
| Wage / Income Gap ($) | 1,816 | 79.32¢ per $1 |
| Gini / Inequality Index | 1,816 | 0.37 |
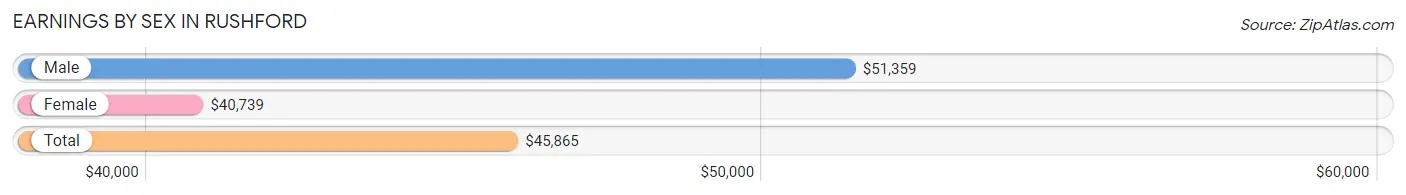
Earnings by Sex in Rushford
Average Earnings in Rushford are $45,865, $51,359 for men and $40,739 for women, a difference of 20.7%.
| Sex | Number | Average Earnings |
| Male | 457 (48.9%) | $51,359 |
| Female | 478 (51.1%) | $40,739 |
| Total | 935 (100.0%) | $45,865 |
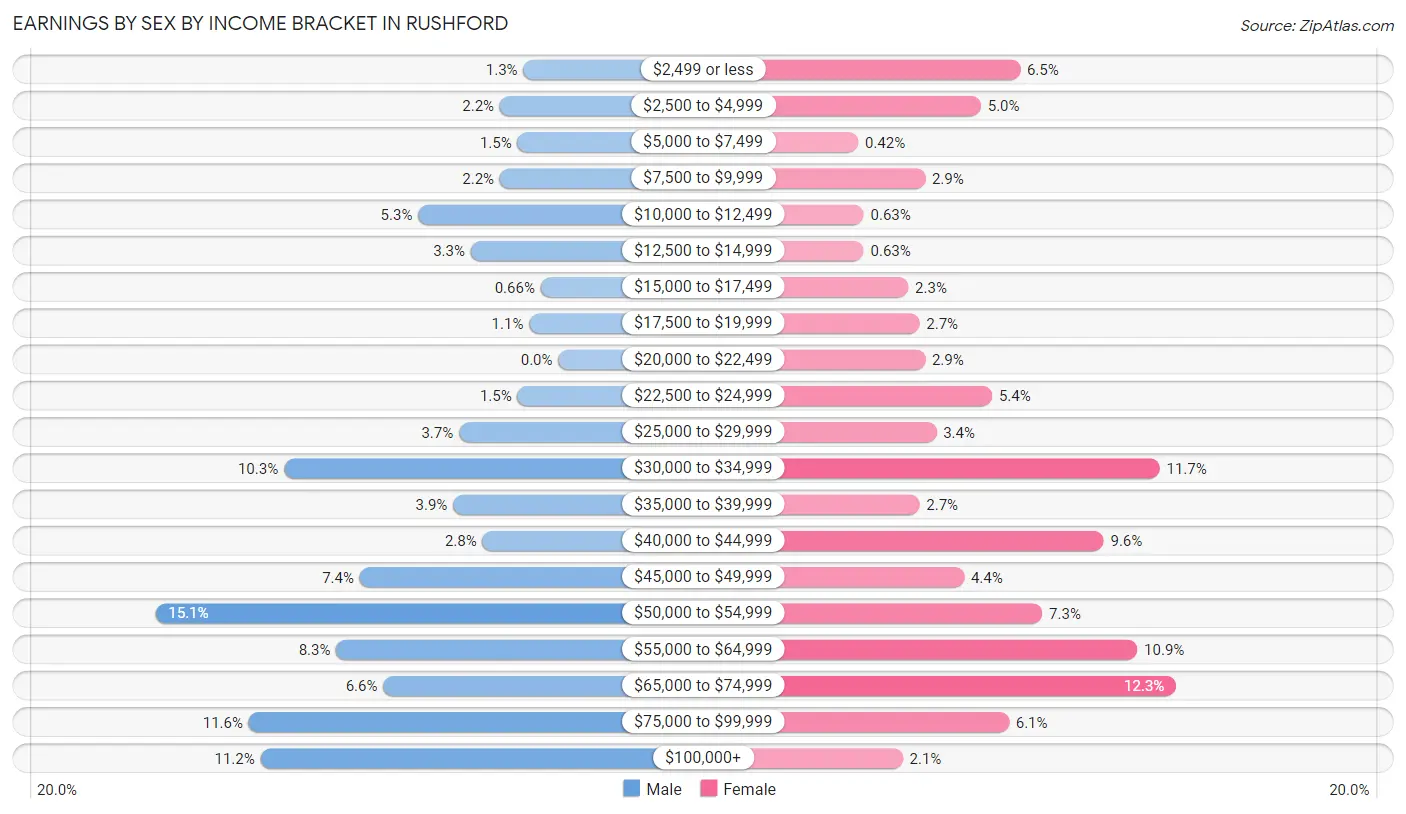
Earnings by Sex by Income Bracket in Rushford
The most common earnings brackets in Rushford are $50,000 to $54,999 for men (69 | 15.1%) and $65,000 to $74,999 for women (59 | 12.3%).
| Income | Male | Female |
| $2,499 or less | 6 (1.3%) | 31 (6.5%) |
| $2,500 to $4,999 | 10 (2.2%) | 24 (5.0%) |
| $5,000 to $7,499 | 7 (1.5%) | 2 (0.4%) |
| $7,500 to $9,999 | 10 (2.2%) | 14 (2.9%) |
| $10,000 to $12,499 | 24 (5.2%) | 3 (0.6%) |
| $12,500 to $14,999 | 15 (3.3%) | 3 (0.6%) |
| $15,000 to $17,499 | 3 (0.7%) | 11 (2.3%) |
| $17,500 to $19,999 | 5 (1.1%) | 13 (2.7%) |
| $20,000 to $22,499 | 0 (0.0%) | 14 (2.9%) |
| $22,500 to $24,999 | 7 (1.5%) | 26 (5.4%) |
| $25,000 to $29,999 | 17 (3.7%) | 16 (3.4%) |
| $30,000 to $34,999 | 47 (10.3%) | 56 (11.7%) |
| $35,000 to $39,999 | 18 (3.9%) | 13 (2.7%) |
| $40,000 to $44,999 | 13 (2.8%) | 46 (9.6%) |
| $45,000 to $49,999 | 34 (7.4%) | 21 (4.4%) |
| $50,000 to $54,999 | 69 (15.1%) | 35 (7.3%) |
| $55,000 to $64,999 | 38 (8.3%) | 52 (10.9%) |
| $65,000 to $74,999 | 30 (6.6%) | 59 (12.3%) |
| $75,000 to $99,999 | 53 (11.6%) | 29 (6.1%) |
| $100,000+ | 51 (11.2%) | 10 (2.1%) |
| Total | 457 (100.0%) | 478 (100.0%) |
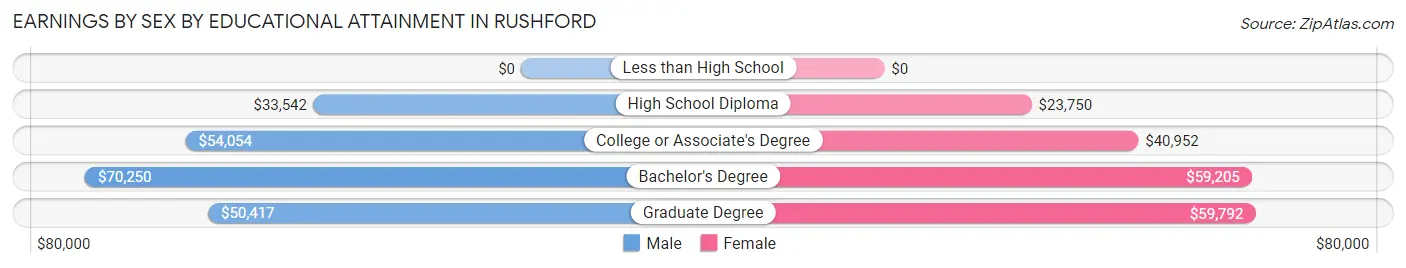
Earnings by Sex by Educational Attainment in Rushford
Average earnings in Rushford are $52,663 for men and $42,045 for women, a difference of 20.2%. Men with an educational attainment of bachelor's degree enjoy the highest average annual earnings of $70,250, while those with high school diploma education earn the least with $33,542. Women with an educational attainment of graduate degree earn the most with the average annual earnings of $59,792, while those with high school diploma education have the smallest earnings of $23,750.
| Educational Attainment | Male Income | Female Income |
| Less than High School | - | - |
| High School Diploma | $33,542 | $23,750 |
| College or Associate's Degree | $54,054 | $40,952 |
| Bachelor's Degree | $70,250 | $59,205 |
| Graduate Degree | $50,417 | $59,792 |
| Total | $52,663 | $42,045 |
Family Income in Rushford
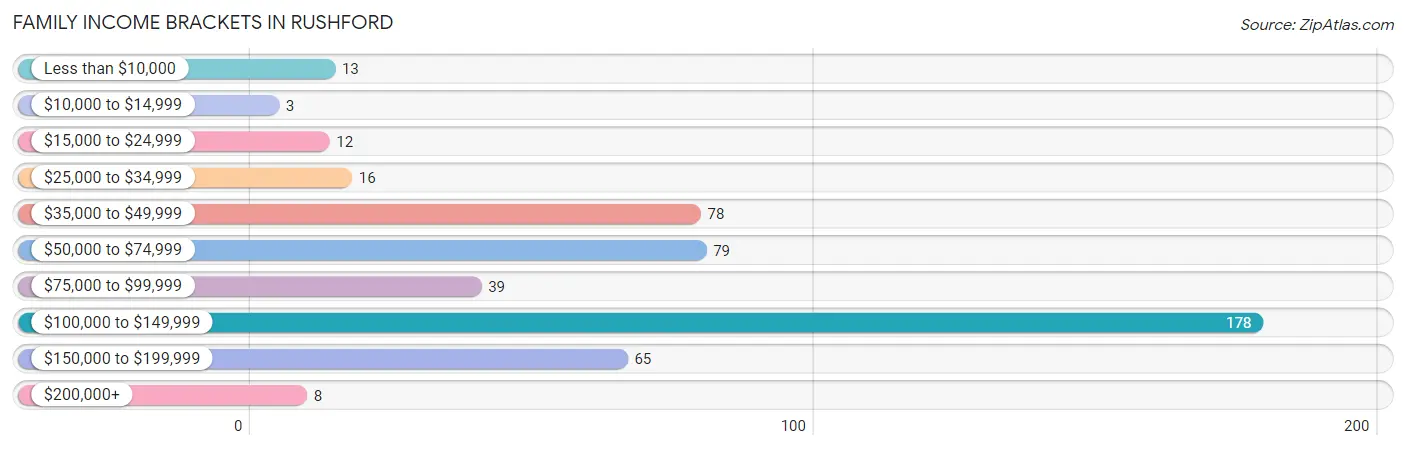
Family Income Brackets in Rushford
According to the Rushford family income data, there are 178 families falling into the $100,000 to $149,999 income range, which is the most common income bracket and makes up 36.2% of all families. Conversely, the $10,000 to $14,999 income bracket is the least frequent group with only 3 families (0.6%) belonging to this category.
| Income Bracket | # Families | % Families |
| Less than $10,000 | 13 | 2.6% |
| $10,000 to $14,999 | 3 | 0.6% |
| $15,000 to $24,999 | 12 | 2.4% |
| $25,000 to $34,999 | 16 | 3.3% |
| $35,000 to $49,999 | 78 | 15.9% |
| $50,000 to $74,999 | 79 | 16.1% |
| $75,000 to $99,999 | 39 | 7.9% |
| $100,000 to $149,999 | 178 | 36.3% |
| $150,000 to $199,999 | 65 | 13.2% |
| $200,000+ | 8 | 1.6% |
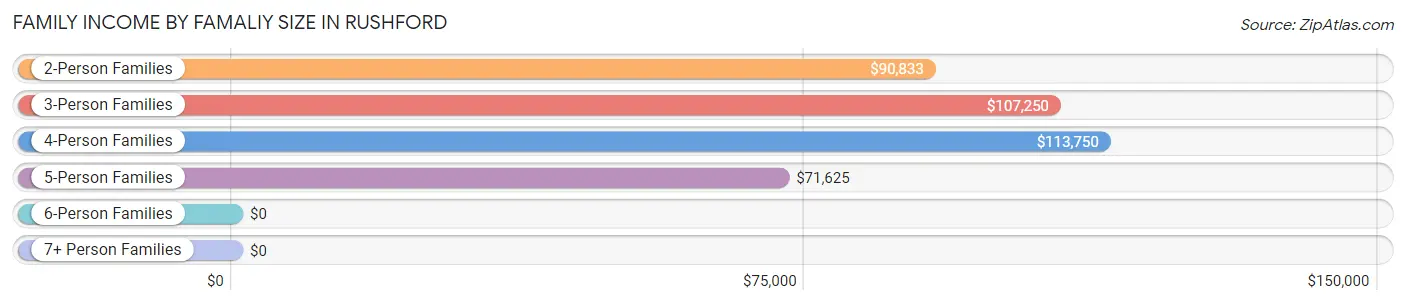
Family Income by Famaliy Size in Rushford
4-person families (69 | 14.1%) account for the highest median family income in Rushford with $113,750 per family, while 2-person families (242 | 49.3%) have the highest median income of $45,416 per family member.
| Income Bracket | # Families | Median Income |
| 2-Person Families | 242 (49.3%) | $90,833 |
| 3-Person Families | 112 (22.8%) | $107,250 |
| 4-Person Families | 69 (14.1%) | $113,750 |
| 5-Person Families | 43 (8.8%) | $71,625 |
| 6-Person Families | 19 (3.9%) | $0 |
| 7+ Person Families | 6 (1.2%) | $0 |
| Total | 491 (100.0%) | $104,028 |
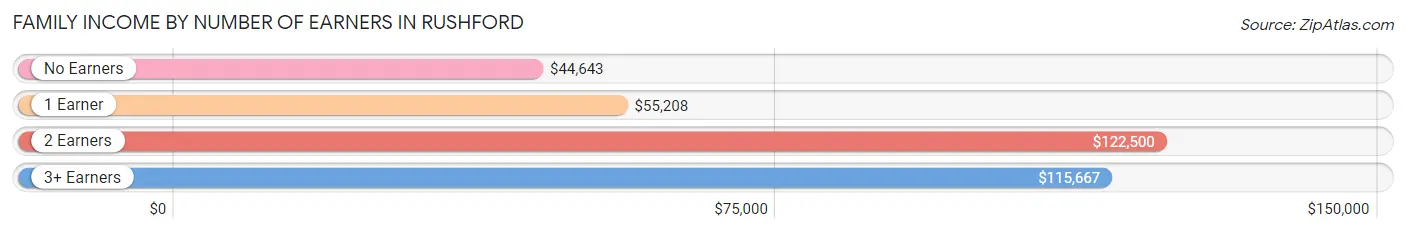
Family Income by Number of Earners in Rushford
The median family income in Rushford is $104,028, with families comprising 2 earners (236) having the highest median family income of $122,500, while families with no earners (76) have the lowest median family income of $44,643, accounting for 48.1% and 15.5% of families, respectively.
| Number of Earners | # Families | Median Income |
| No Earners | 76 (15.5%) | $44,643 |
| 1 Earner | 113 (23.0%) | $55,208 |
| 2 Earners | 236 (48.1%) | $122,500 |
| 3+ Earners | 66 (13.4%) | $115,667 |
| Total | 491 (100.0%) | $104,028 |
Household Income in Rushford
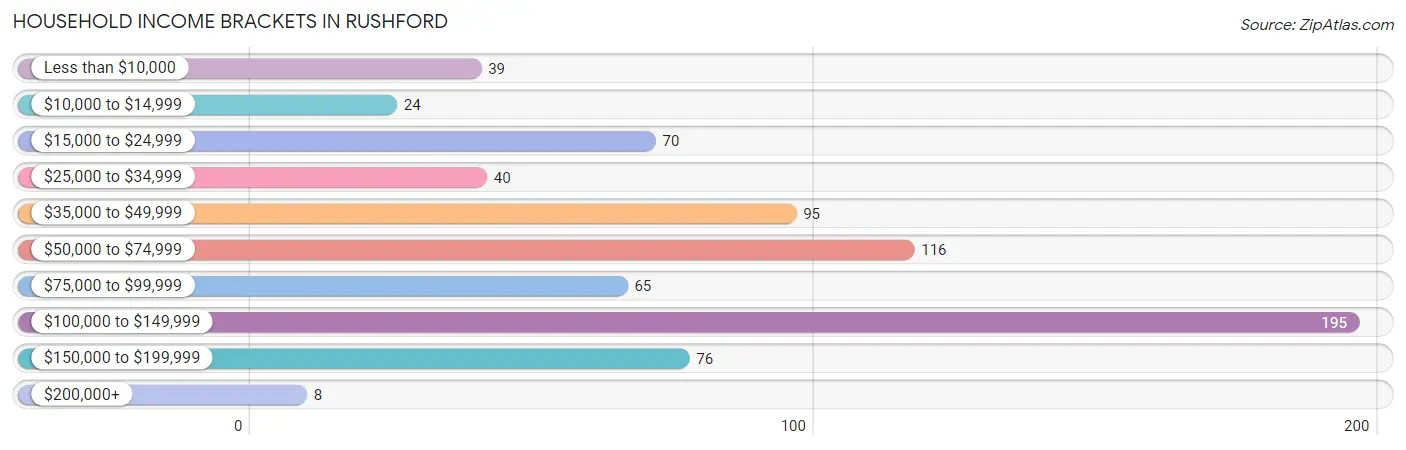
Household Income Brackets in Rushford
With 195 households falling in the category, the $100,000 to $149,999 income range is the most frequent in Rushford, accounting for 26.8% of all households. In contrast, only 8 households (1.1%) fall into the $200,000+ income bracket, making it the least populous group.
| Income Bracket | # Households | % Households |
| Less than $10,000 | 39 | 5.4% |
| $10,000 to $14,999 | 24 | 3.3% |
| $15,000 to $24,999 | 70 | 9.6% |
| $25,000 to $34,999 | 40 | 5.5% |
| $35,000 to $49,999 | 95 | 13.0% |
| $50,000 to $74,999 | 116 | 15.9% |
| $75,000 to $99,999 | 65 | 8.9% |
| $100,000 to $149,999 | 195 | 26.8% |
| $150,000 to $199,999 | 76 | 10.4% |
| $200,000+ | 8 | 1.1% |
Household Income by Householder Age in Rushford
The median household income in Rushford is $70,543, with the highest median household income of $105,192 found in the 25 to 44 years age bracket for the primary householder. A total of 210 households (28.8%) fall into this category. Meanwhile, the 15 to 24 years age bracket for the primary householder has the lowest median household income of $0, with 41 households (5.6%) in this group.
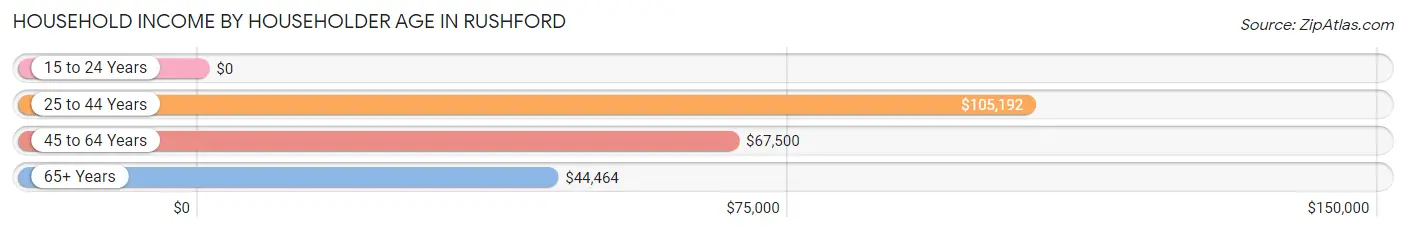
| Income Bracket | # Households | Median Income |
| 15 to 24 Years | 41 (5.6%) | $0 |
| 25 to 44 Years | 210 (28.8%) | $105,192 |
| 45 to 64 Years | 254 (34.9%) | $67,500 |
| 65+ Years | 223 (30.6%) | $44,464 |
| Total | 728 (100.0%) | $70,543 |
Poverty in Rushford
Income Below Poverty by Sex and Age in Rushford
With 6.5% poverty level for males and 10.9% for females among the residents of Rushford, 5 year old males and 5 year old females are the most vulnerable to poverty, with 2 males (28.6%) and 7 females (41.2%) in their respective age groups living below the poverty level.
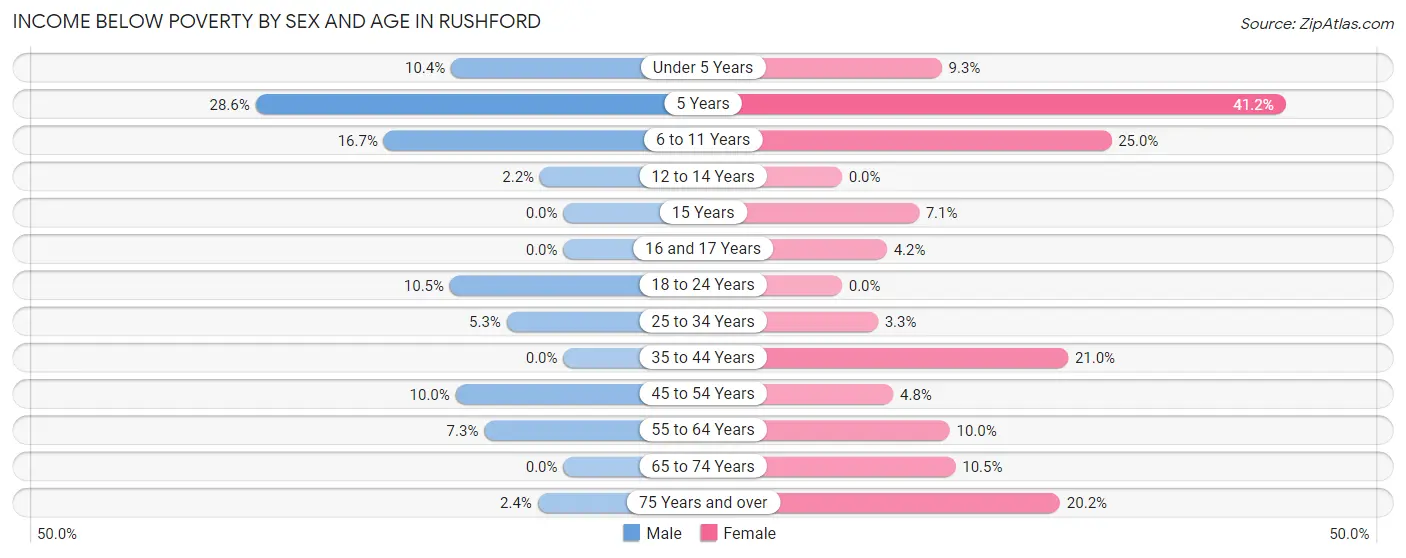
| Age Bracket | Male | Female |
| Under 5 Years | 10 (10.4%) | 5 (9.3%) |
| 5 Years | 2 (28.6%) | 7 (41.2%) |
| 6 to 11 Years | 14 (16.7%) | 15 (25.0%) |
| 12 to 14 Years | 1 (2.2%) | 0 (0.0%) |
| 15 Years | 0 (0.0%) | 1 (7.1%) |
| 16 and 17 Years | 0 (0.0%) | 1 (4.2%) |
| 18 to 24 Years | 4 (10.5%) | 0 (0.0%) |
| 25 to 34 Years | 5 (5.3%) | 4 (3.3%) |
| 35 to 44 Years | 0 (0.0%) | 17 (21.0%) |
| 45 to 54 Years | 10 (10.0%) | 5 (4.8%) |
| 55 to 64 Years | 8 (7.3%) | 9 (10.0%) |
| 65 to 74 Years | 0 (0.0%) | 14 (10.5%) |
| 75 Years and over | 1 (2.4%) | 17 (20.2%) |
| Total | 55 (6.5%) | 95 (10.9%) |
Income Above Poverty by Sex and Age in Rushford
According to the poverty statistics in Rushford, males aged 15 years and females aged 12 to 14 years are the age groups that are most secure financially, with 100.0% of males and 100.0% of females in these age groups living above the poverty line.
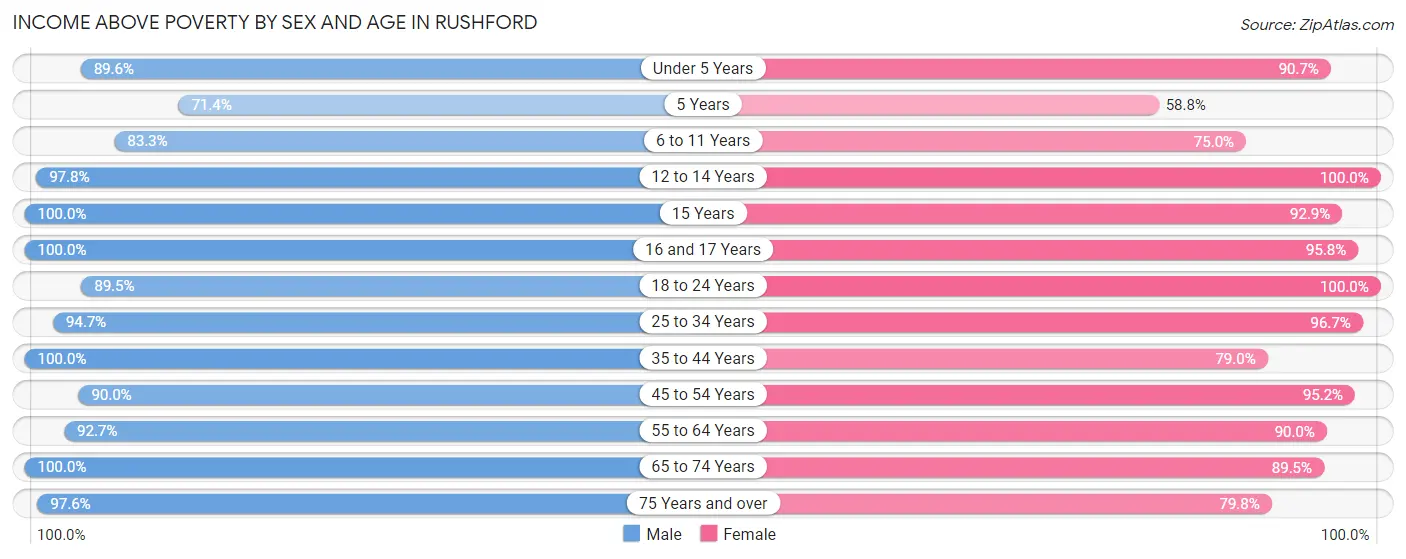
| Age Bracket | Male | Female |
| Under 5 Years | 86 (89.6%) | 49 (90.7%) |
| 5 Years | 5 (71.4%) | 10 (58.8%) |
| 6 to 11 Years | 70 (83.3%) | 45 (75.0%) |
| 12 to 14 Years | 45 (97.8%) | 26 (100.0%) |
| 15 Years | 9 (100.0%) | 13 (92.9%) |
| 16 and 17 Years | 8 (100.0%) | 23 (95.8%) |
| 18 to 24 Years | 34 (89.5%) | 67 (100.0%) |
| 25 to 34 Years | 90 (94.7%) | 116 (96.7%) |
| 35 to 44 Years | 110 (100.0%) | 64 (79.0%) |
| 45 to 54 Years | 90 (90.0%) | 100 (95.2%) |
| 55 to 64 Years | 101 (92.7%) | 81 (90.0%) |
| 65 to 74 Years | 103 (100.0%) | 119 (89.5%) |
| 75 Years and over | 41 (97.6%) | 67 (79.8%) |
| Total | 792 (93.5%) | 780 (89.1%) |
Income Below Poverty Among Married-Couple Families in Rushford
The poverty statistics for married-couple families in Rushford show that 3.3% or 13 of the total 391 families live below the poverty line. Families with 3 or 4 children have the highest poverty rate of 15.2%, comprising of 9 families. On the other hand, families with 1 or 2 children have the lowest poverty rate of 0.0%, which includes 0 families.
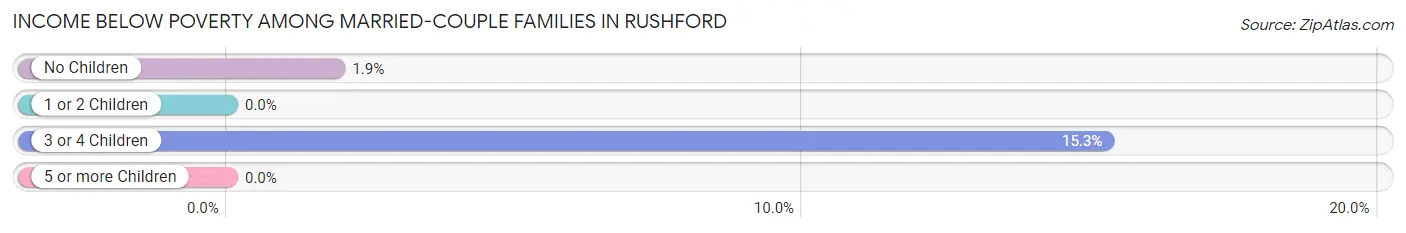
| Children | Above Poverty | Below Poverty |
| No Children | 210 (98.1%) | 4 (1.9%) |
| 1 or 2 Children | 116 (100.0%) | 0 (0.0%) |
| 3 or 4 Children | 50 (84.8%) | 9 (15.2%) |
| 5 or more Children | 2 (100.0%) | 0 (0.0%) |
| Total | 378 (96.7%) | 13 (3.3%) |
Income Below Poverty Among Single-Parent Households in Rushford
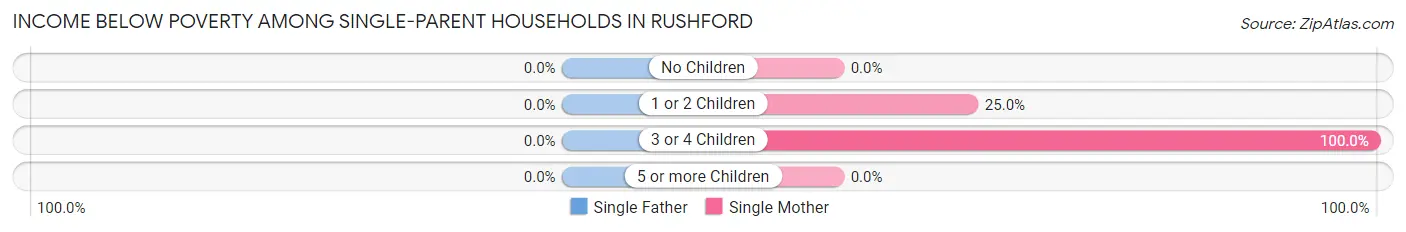
| Children | Single Father | Single Mother |
| No Children | 0 (0.0%) | 0 (0.0%) |
| 1 or 2 Children | 0 (0.0%) | 8 (25.0%) |
| 3 or 4 Children | 0 (0.0%) | 2 (100.0%) |
| 5 or more Children | 0 (0.0%) | 0 (0.0%) |
| Total | 0 (0.0%) | 10 (13.2%) |
Income Below Poverty Among Married-Couple vs Single-Parent Households in Rushford
The poverty data for Rushford shows that 13 of the married-couple family households (3.3%) and 10 of the single-parent households (10.0%) are living below the poverty level. Within the married-couple family households, those with 3 or 4 children have the highest poverty rate, with 9 households (15.2%) falling below the poverty line. Among the single-parent households, those with 3 or 4 children have the highest poverty rate, with 2 household (100.0%) living below poverty.
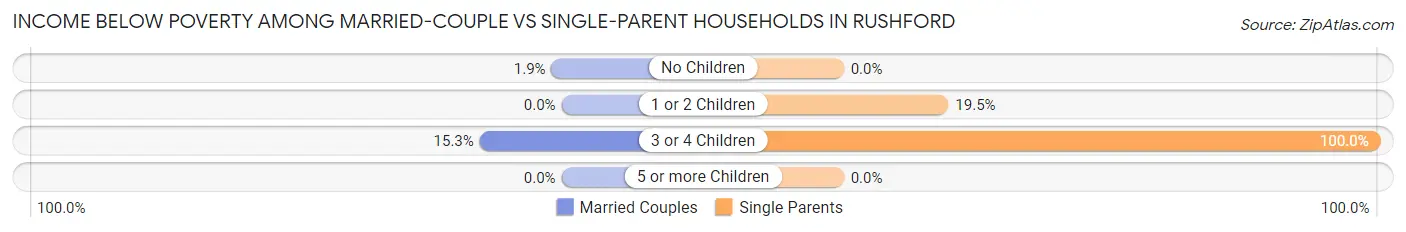
| Children | Married-Couple Families | Single-Parent Households |
| No Children | 4 (1.9%) | 0 (0.0%) |
| 1 or 2 Children | 0 (0.0%) | 8 (19.5%) |
| 3 or 4 Children | 9 (15.2%) | 2 (100.0%) |
| 5 or more Children | 0 (0.0%) | 0 (0.0%) |
| Total | 13 (3.3%) | 10 (10.0%) |
Race in Rushford
The most populous races in Rushford are White / Caucasian (1,747 | 96.2%), Hispanic or Latino (41 | 2.3%), and Asian (30 | 1.7%).
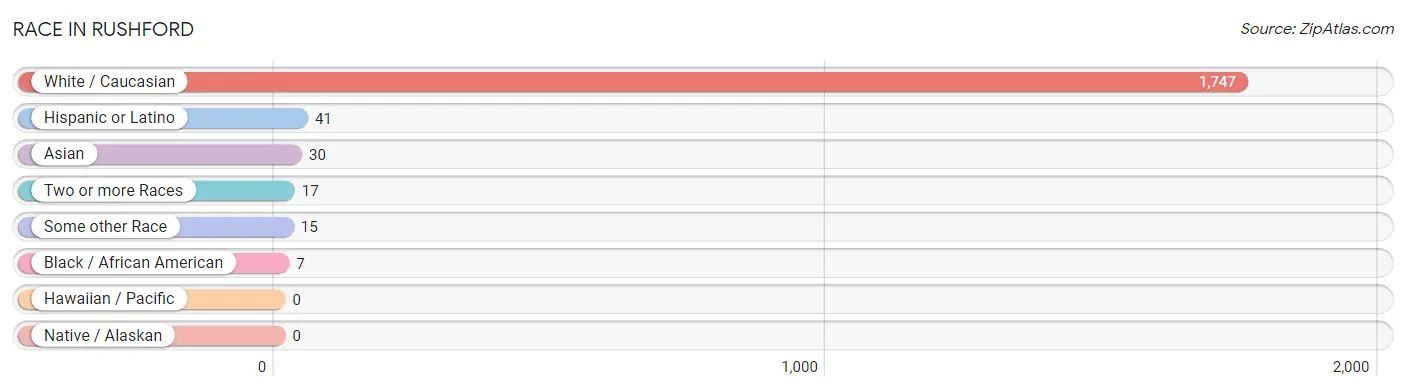
| Race | # Population | % Population |
| Asian | 30 | 1.7% |
| Black / African American | 7 | 0.4% |
| Hawaiian / Pacific | 0 | 0.0% |
| Hispanic or Latino | 41 | 2.3% |
| Native / Alaskan | 0 | 0.0% |
| White / Caucasian | 1,747 | 96.2% |
| Two or more Races | 17 | 0.9% |
| Some other Race | 15 | 0.8% |
| Total | 1,816 | 100.0% |
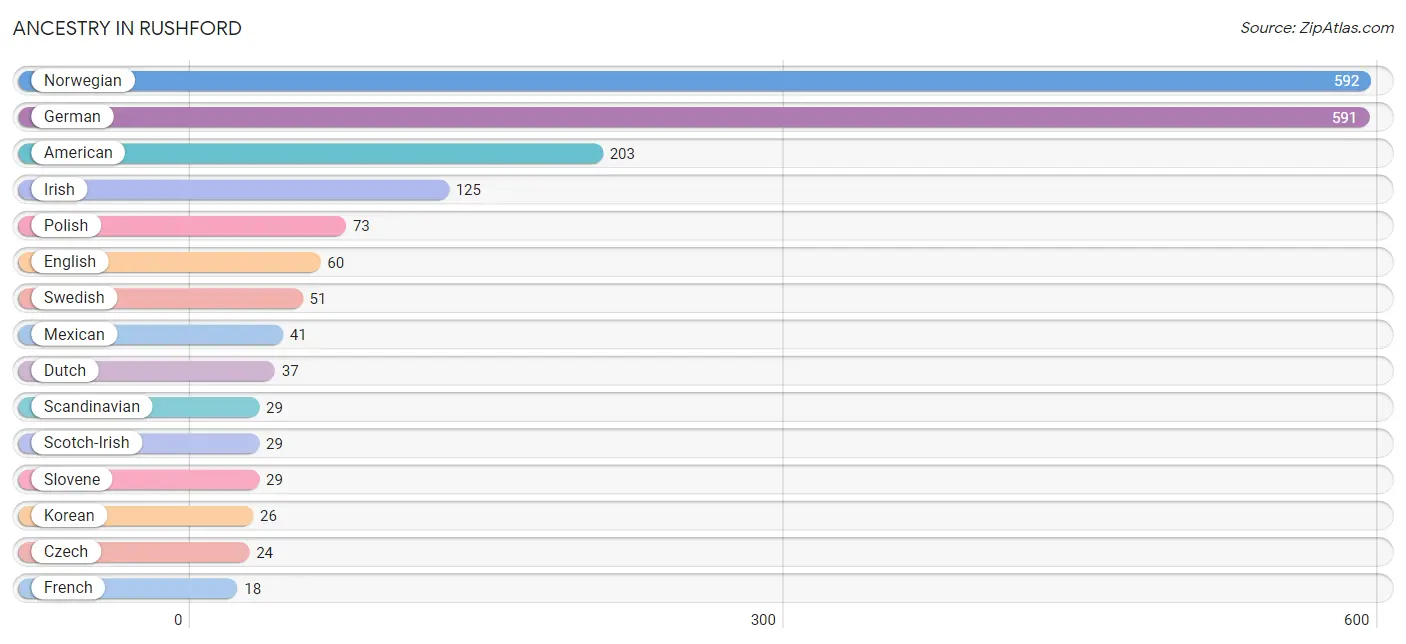
Ancestry in Rushford
The most populous ancestries reported in Rushford are Norwegian (592 | 32.6%), German (591 | 32.5%), American (203 | 11.2%), Irish (125 | 6.9%), and Polish (73 | 4.0%), together accounting for 87.2% of all Rushford residents.
| Ancestry | # Population | % Population |
| American | 203 | 11.2% |
| Burmese | 4 | 0.2% |
| Chippewa | 7 | 0.4% |
| Czech | 24 | 1.3% |
| Danish | 5 | 0.3% |
| Dutch | 37 | 2.0% |
| English | 60 | 3.3% |
| European | 8 | 0.4% |
| Finnish | 3 | 0.2% |
| French | 18 | 1.0% |
| German | 591 | 32.5% |
| Hungarian | 10 | 0.5% |
| Irish | 125 | 6.9% |
| Korean | 26 | 1.4% |
| Luxembourger | 8 | 0.4% |
| Mexican | 41 | 2.3% |
| Norwegian | 592 | 32.6% |
| Polish | 73 | 4.0% |
| Scandinavian | 29 | 1.6% |
| Scotch-Irish | 29 | 1.6% |
| Scottish | 6 | 0.3% |
| Slovene | 29 | 1.6% |
| Subsaharan African | 6 | 0.3% |
| Sudanese | 6 | 0.3% |
| Swedish | 51 | 2.8% | View All 25 Rows |
Immigrants in Rushford
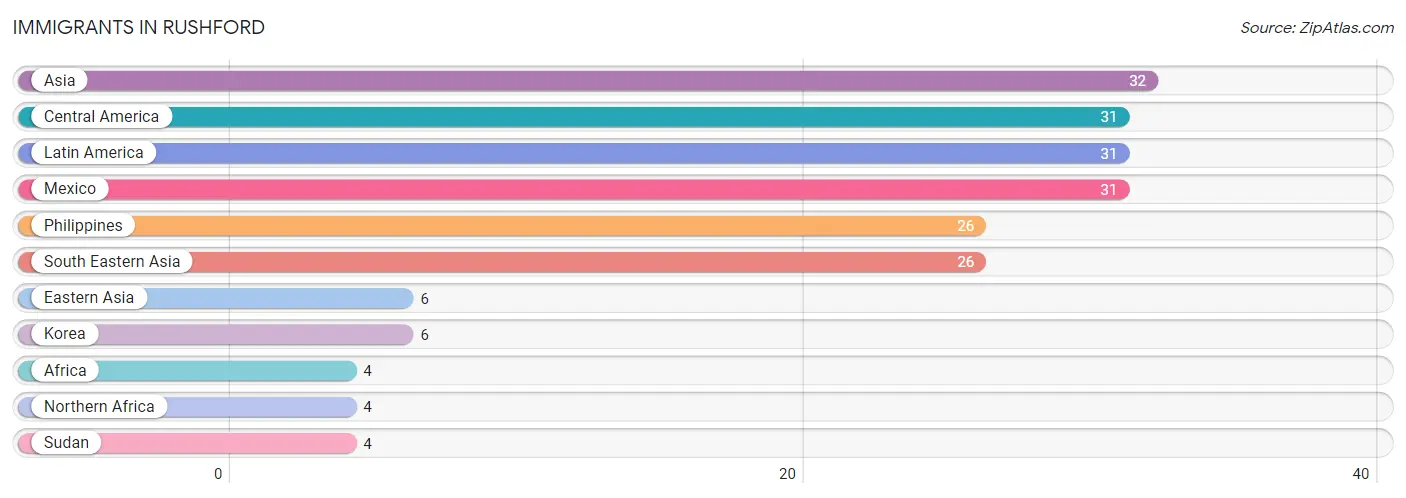
The most numerous immigrant groups reported in Rushford came from Asia (32 | 1.8%), Central America (31 | 1.7%), Latin America (31 | 1.7%), Mexico (31 | 1.7%), and Philippines (26 | 1.4%), together accounting for 8.3% of all Rushford residents.
| Immigration Origin | # Population | % Population |
| Africa | 4 | 0.2% |
| Asia | 32 | 1.8% |
| Central America | 31 | 1.7% |
| Eastern Asia | 6 | 0.3% |
| Korea | 6 | 0.3% |
| Latin America | 31 | 1.7% |
| Mexico | 31 | 1.7% |
| Northern Africa | 4 | 0.2% |
| Philippines | 26 | 1.4% |
| South Eastern Asia | 26 | 1.4% |
| Sudan | 4 | 0.2% | View All 11 Rows |
Sex and Age in Rushford
Sex and Age in Rushford
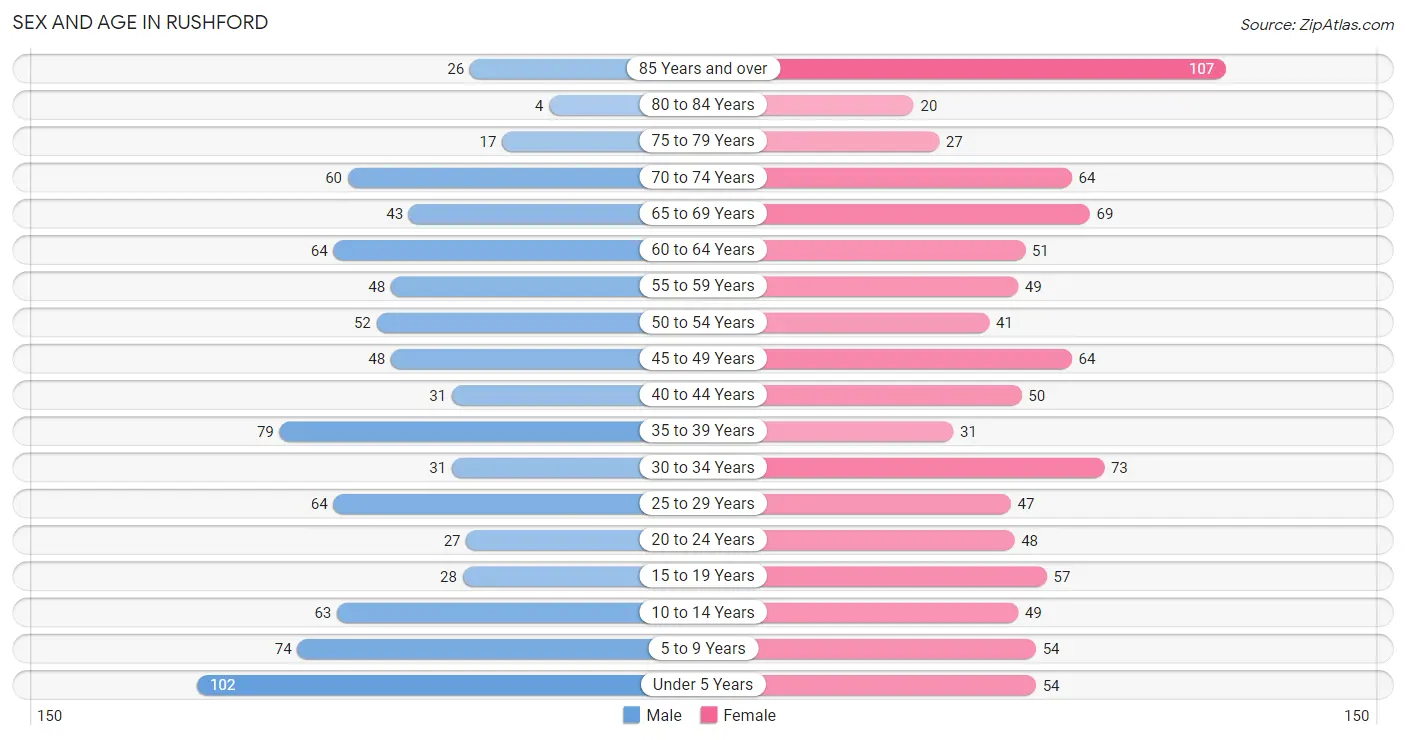
The most populous age groups in Rushford are Under 5 Years (102 | 11.8%) for men and 85 Years and over (107 | 11.2%) for women.
| Age Bracket | Male | Female |
| Under 5 Years | 102 (11.8%) | 54 (5.7%) |
| 5 to 9 Years | 74 (8.6%) | 54 (5.7%) |
| 10 to 14 Years | 63 (7.3%) | 49 (5.1%) |
| 15 to 19 Years | 28 (3.3%) | 57 (6.0%) |
| 20 to 24 Years | 27 (3.1%) | 48 (5.0%) |
| 25 to 29 Years | 64 (7.4%) | 47 (4.9%) |
| 30 to 34 Years | 31 (3.6%) | 73 (7.6%) |
| 35 to 39 Years | 79 (9.2%) | 31 (3.3%) |
| 40 to 44 Years | 31 (3.6%) | 50 (5.2%) |
| 45 to 49 Years | 48 (5.6%) | 64 (6.7%) |
| 50 to 54 Years | 52 (6.0%) | 41 (4.3%) |
| 55 to 59 Years | 48 (5.6%) | 49 (5.1%) |
| 60 to 64 Years | 64 (7.4%) | 51 (5.3%) |
| 65 to 69 Years | 43 (5.0%) | 69 (7.2%) |
| 70 to 74 Years | 60 (7.0%) | 64 (6.7%) |
| 75 to 79 Years | 17 (2.0%) | 27 (2.8%) |
| 80 to 84 Years | 4 (0.5%) | 20 (2.1%) |
| 85 Years and over | 26 (3.0%) | 107 (11.2%) |
| Total | 861 (100.0%) | 955 (100.0%) |
Families and Households in Rushford
Median Family Size in Rushford
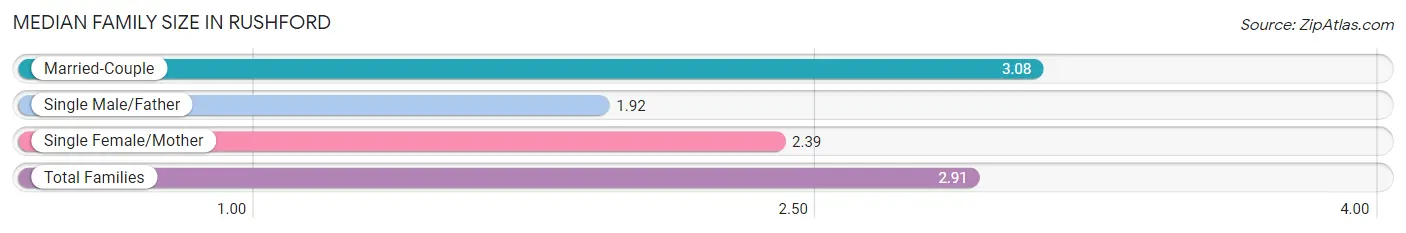
The median family size in Rushford is 2.91 persons per family, with married-couple families (391 | 79.6%) accounting for the largest median family size of 3.08 persons per family. On the other hand, single male/father families (24 | 4.9%) represent the smallest median family size with 1.92 persons per family.
| Family Type | # Families | Family Size |
| Married-Couple | 391 (79.6%) | 3.08 |
| Single Male/Father | 24 (4.9%) | 1.92 |
| Single Female/Mother | 76 (15.5%) | 2.39 |
| Total Families | 491 (100.0%) | 2.91 |
Median Household Size in Rushford
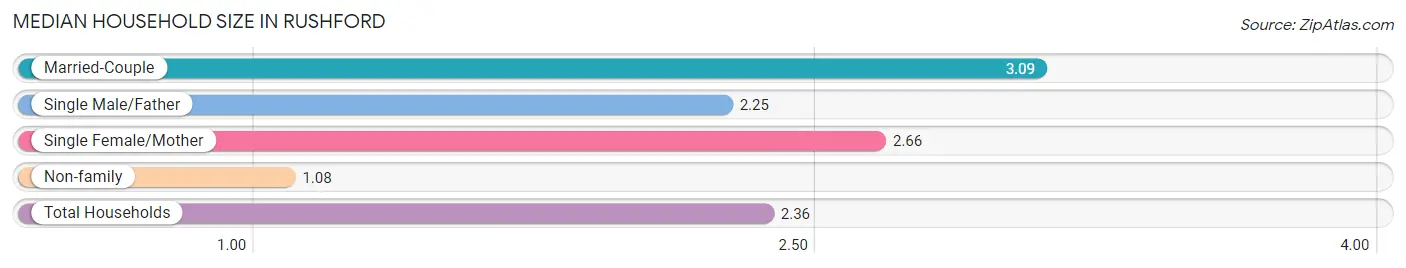
The median household size in Rushford is 2.36 persons per household, with married-couple households (391 | 53.7%) accounting for the largest median household size of 3.09 persons per household. non-family households (237 | 32.6%) represent the smallest median household size with 1.08 persons per household.
| Household Type | # Households | Household Size |
| Married-Couple | 391 (53.7%) | 3.09 |
| Single Male/Father | 24 (3.3%) | 2.25 |
| Single Female/Mother | 76 (10.4%) | 2.66 |
| Non-family | 237 (32.6%) | 1.08 |
| Total Households | 728 (100.0%) | 2.36 |
Household Size by Marriage Status in Rushford
Out of a total of 728 households in Rushford, 491 (67.4%) are family households, while 237 (32.6%) are nonfamily households. The most numerous type of family households are 2-person households, comprising 232, and the most common type of nonfamily households are 1-person households, comprising 216.
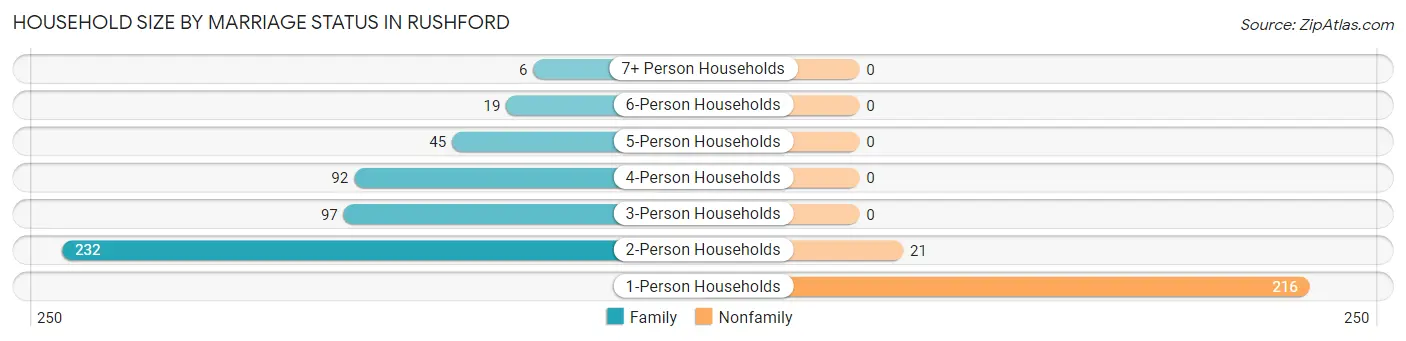
| Household Size | Family Households | Nonfamily Households |
| 1-Person Households | - | 216 (29.7%) |
| 2-Person Households | 232 (31.9%) | 21 (2.9%) |
| 3-Person Households | 97 (13.3%) | 0 (0.0%) |
| 4-Person Households | 92 (12.6%) | 0 (0.0%) |
| 5-Person Households | 45 (6.2%) | 0 (0.0%) |
| 6-Person Households | 19 (2.6%) | 0 (0.0%) |
| 7+ Person Households | 6 (0.8%) | 0 (0.0%) |
| Total | 491 (67.4%) | 237 (32.6%) |
Female Fertility in Rushford
Fertility by Age in Rushford
Average fertility rate in Rushford is 59.0 births per 1,000 women. Women in the age bracket of 20 to 34 years have the highest fertility rate with 95.0 births per 1,000 women. Women in the age bracket of 20 to 34 years acount for 69.6% of all women with births.
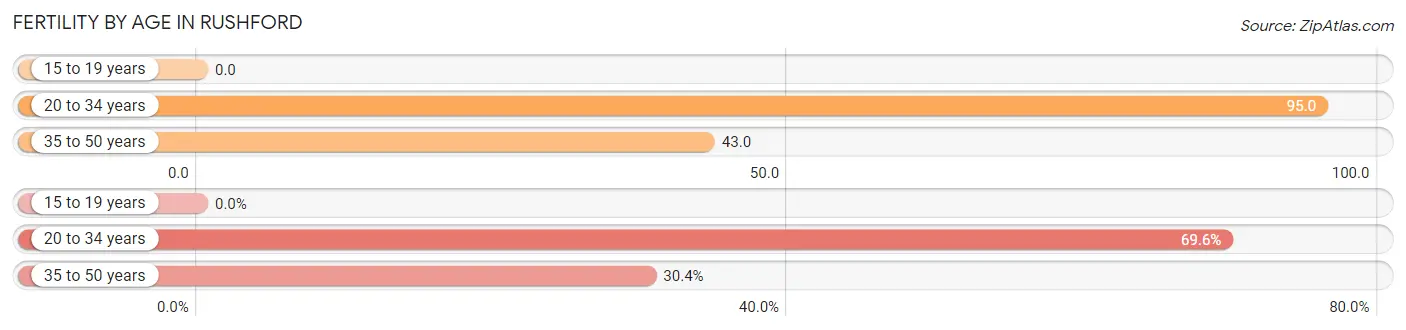
| Age Bracket | Women with Births | Births / 1,000 Women |
| 15 to 19 years | 0 (0.0%) | 0.0 |
| 20 to 34 years | 16 (69.6%) | 95.0 |
| 35 to 50 years | 7 (30.4%) | 43.0 |
| Total | 23 (100.0%) | 59.0 |
Fertility by Age by Marriage Status in Rushford
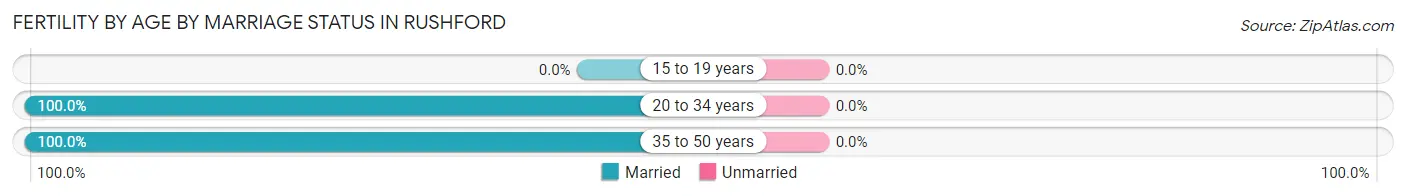
| Age Bracket | Married | Unmarried |
| 15 to 19 years | 0 (0.0%) | 0 (0.0%) |
| 20 to 34 years | 16 (100.0%) | 0 (0.0%) |
| 35 to 50 years | 7 (100.0%) | 0 (0.0%) |
| Total | 23 (100.0%) | 0 (0.0%) |
Fertility by Education in Rushford
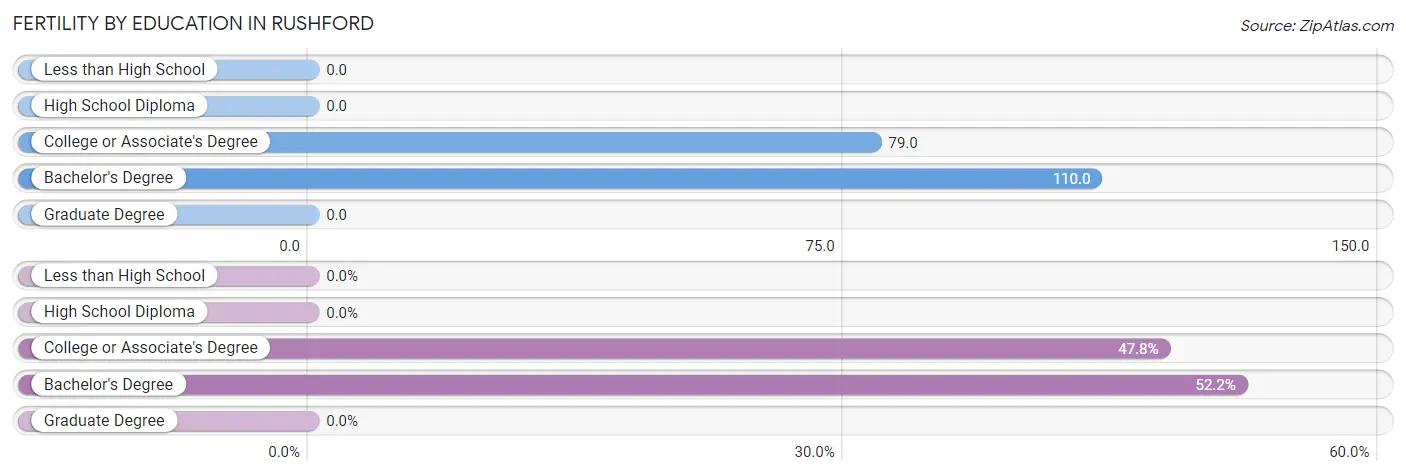
| Educational Attainment | Women with Births | Births / 1,000 Women |
| Less than High School | 0 (0.0%) | 0.0 |
| High School Diploma | 0 (0.0%) | 0.0 |
| College or Associate's Degree | 11 (47.8%) | 79.0 |
| Bachelor's Degree | 12 (52.2%) | 110.0 |
| Graduate Degree | 0 (0.0%) | 0.0 |
| Total | 23 (100.0%) | 59.0 |
Fertility by Education by Marriage Status in Rushford
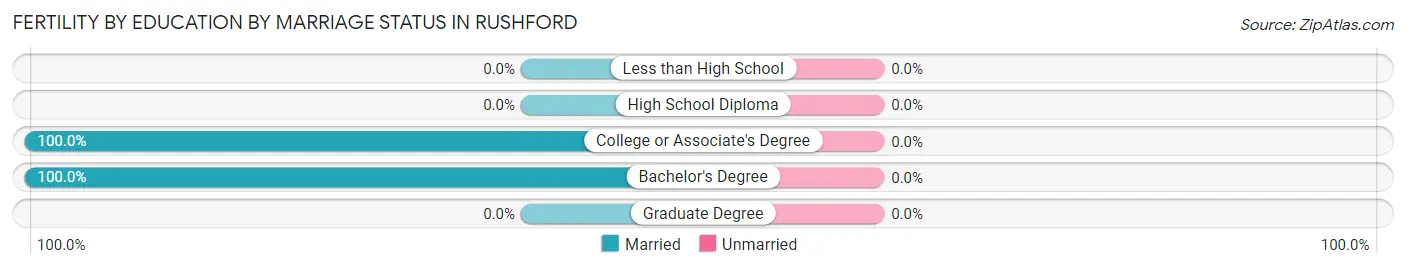
| Educational Attainment | Married | Unmarried |
| Less than High School | 0 (0.0%) | 0 (0.0%) |
| High School Diploma | 0 (0.0%) | 0 (0.0%) |
| College or Associate's Degree | 11 (100.0%) | 0 (0.0%) |
| Bachelor's Degree | 12 (100.0%) | 0 (0.0%) |
| Graduate Degree | 0 (0.0%) | 0 (0.0%) |
| Total | 23 (100.0%) | 0 (0.0%) |
Employment Characteristics in Rushford
Employment by Class of Employer in Rushford
Among the 850 employed individuals in Rushford, private company employees (526 | 61.9%), not-for-profit organizations (129 | 15.2%), and local government employees (68 | 8.0%) make up the most common classes of employment.
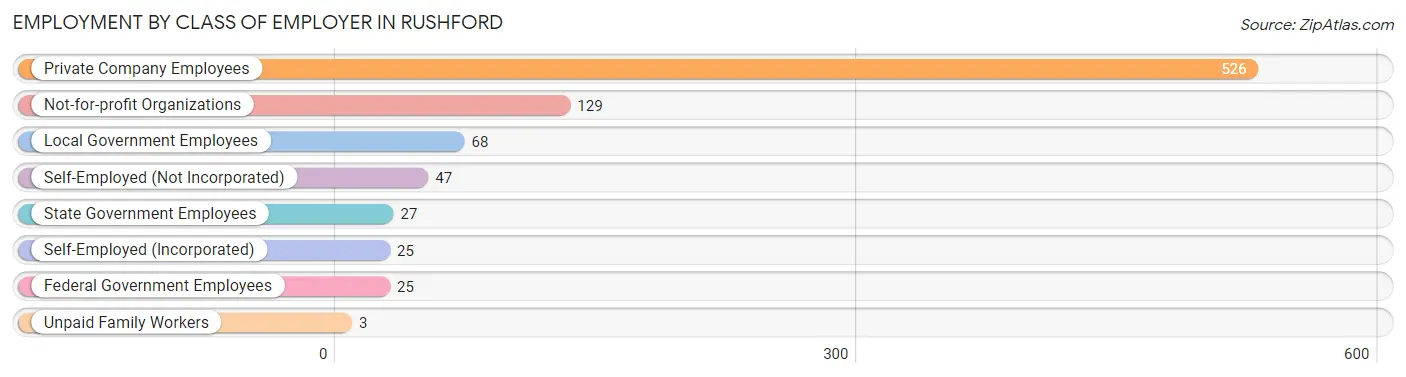
| Employer Class | # Employees | % Employees |
| Private Company Employees | 526 | 61.9% |
| Self-Employed (Incorporated) | 25 | 2.9% |
| Self-Employed (Not Incorporated) | 47 | 5.5% |
| Not-for-profit Organizations | 129 | 15.2% |
| Local Government Employees | 68 | 8.0% |
| State Government Employees | 27 | 3.2% |
| Federal Government Employees | 25 | 2.9% |
| Unpaid Family Workers | 3 | 0.4% |
| Total | 850 | 100.0% |
Employment Status by Age in Rushford
According to the labor force statistics for Rushford, out of the total population over 16 years of age (1,397), 65.1% or 909 individuals are in the labor force, with 3.6% or 33 of them unemployed. The age group with the highest labor force participation rate is 25 to 29 years, with 96.4% or 107 individuals in the labor force. Within the labor force, the 60 to 64 years age range has the highest percentage of unemployed individuals, with 20.8% or 15 of them being unemployed.
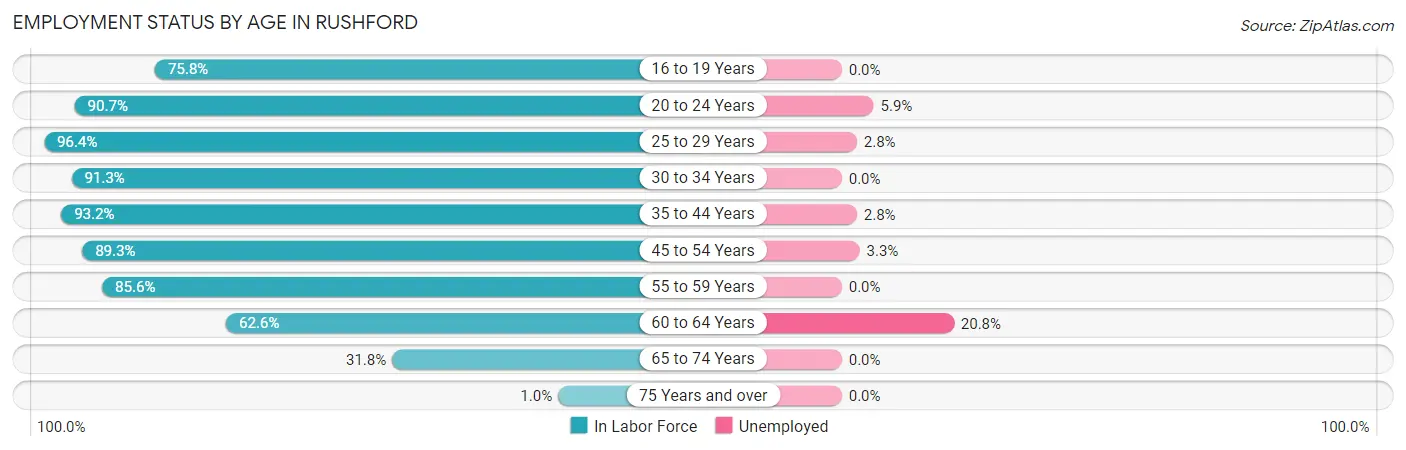
| Age Bracket | In Labor Force | Unemployed |
| 16 to 19 Years | 47 (75.8%) | 0 (0.0%) |
| 20 to 24 Years | 68 (90.7%) | 4 (5.9%) |
| 25 to 29 Years | 107 (96.4%) | 3 (2.8%) |
| 30 to 34 Years | 95 (91.3%) | 0 (0.0%) |
| 35 to 44 Years | 178 (93.2%) | 5 (2.8%) |
| 45 to 54 Years | 183 (89.3%) | 6 (3.3%) |
| 55 to 59 Years | 83 (85.6%) | 0 (0.0%) |
| 60 to 64 Years | 72 (62.6%) | 15 (20.8%) |
| 65 to 74 Years | 75 (31.8%) | 0 (0.0%) |
| 75 Years and over | 2 (1.0%) | 0 (0.0%) |
| Total | 909 (65.1%) | 33 (3.6%) |
Employment Status by Educational Attainment in Rushford
According to labor force statistics for Rushford, 87.2% of individuals (718) out of the total population between 25 and 64 years of age (823) are in the labor force, with 4.0% or 29 of them being unemployed. The group with the highest labor force participation rate are those with the educational attainment of college / associate degree, with 93.0% or 319 individuals in the labor force. Within the labor force, individuals with less than high school education have the highest percentage of unemployment, with 18.5% or 5 of them being unemployed.
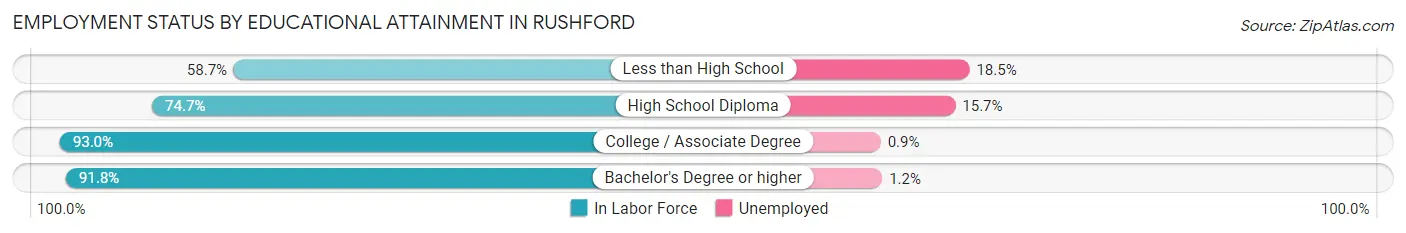
| Educational Attainment | In Labor Force | Unemployed |
| Less than High School | 27 (58.7%) | 9 (18.5%) |
| High School Diploma | 115 (74.7%) | 24 (15.7%) |
| College / Associate Degree | 319 (93.0%) | 3 (0.9%) |
| Bachelor's Degree or higher | 257 (91.8%) | 3 (1.2%) |
| Total | 718 (87.2%) | 33 (4.0%) |
Employment Occupations by Sex in Rushford
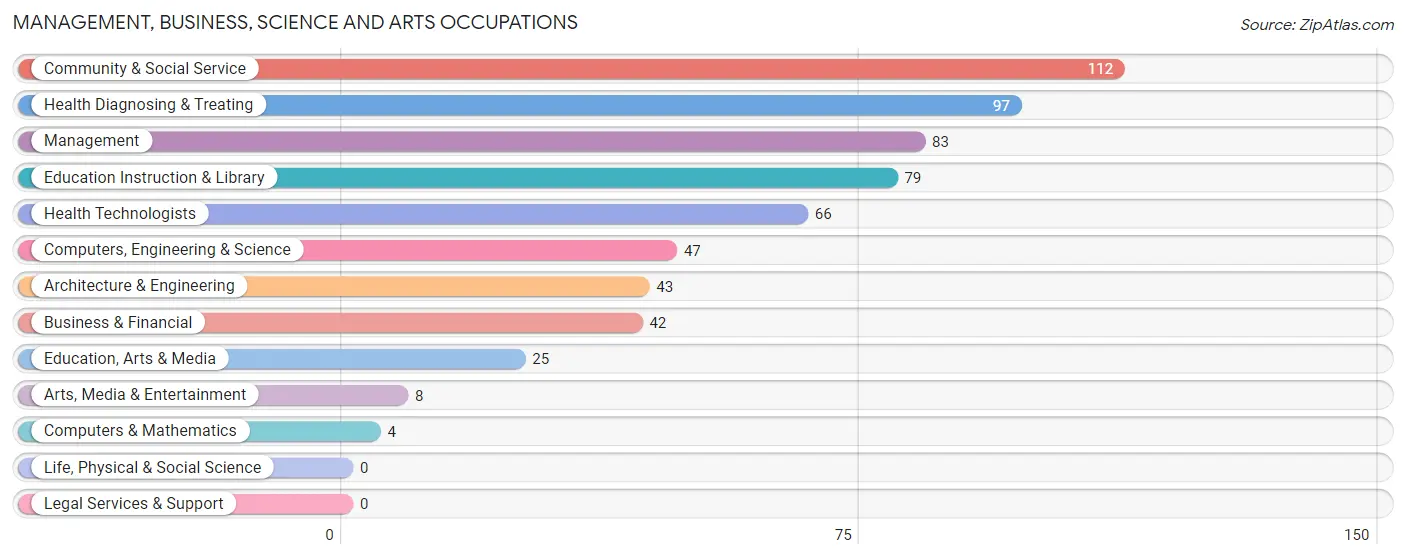
Management, Business, Science and Arts Occupations
The most common Management, Business, Science and Arts occupations in Rushford are Community & Social Service (112 | 12.8%), Health Diagnosing & Treating (97 | 11.1%), Management (83 | 9.5%), Education Instruction & Library (79 | 9.0%), and Health Technologists (66 | 7.5%).
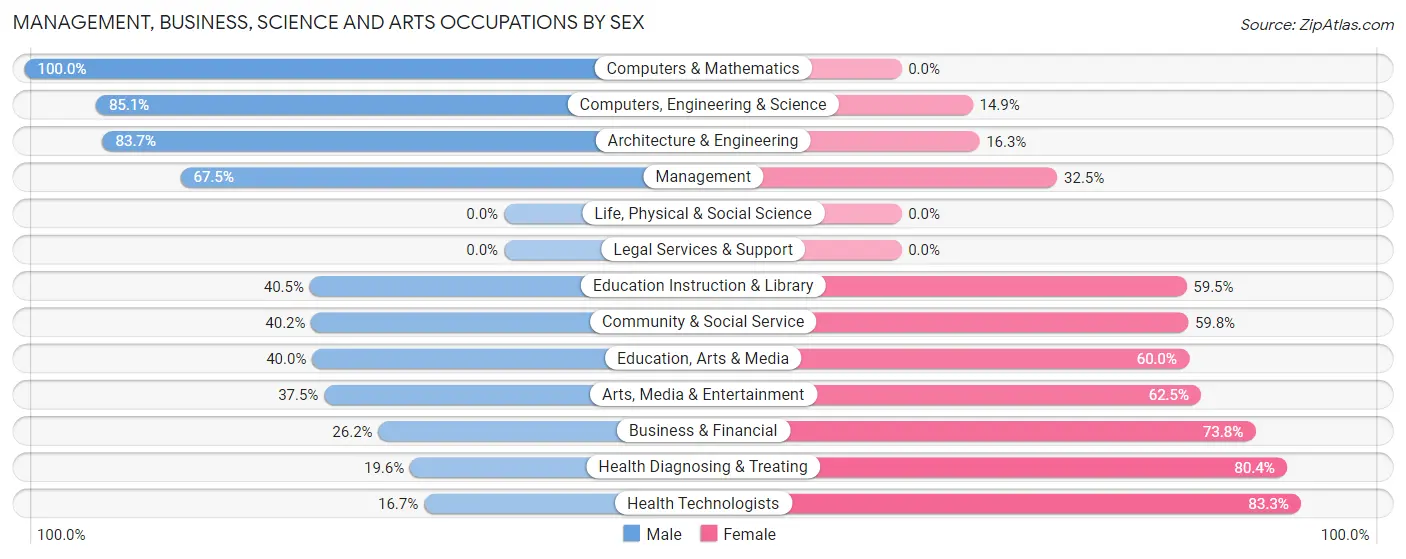
Management, Business, Science and Arts Occupations by Sex
Within the Management, Business, Science and Arts occupations in Rushford, the most male-oriented occupations are Computers & Mathematics (100.0%), Computers, Engineering & Science (85.1%), and Architecture & Engineering (83.7%), while the most female-oriented occupations are Health Technologists (83.3%), Health Diagnosing & Treating (80.4%), and Business & Financial (73.8%).
| Occupation | Male | Female |
| Management | 56 (67.5%) | 27 (32.5%) |
| Business & Financial | 11 (26.2%) | 31 (73.8%) |
| Computers, Engineering & Science | 40 (85.1%) | 7 (14.9%) |
| Computers & Mathematics | 4 (100.0%) | 0 (0.0%) |
| Architecture & Engineering | 36 (83.7%) | 7 (16.3%) |
| Life, Physical & Social Science | 0 (0.0%) | 0 (0.0%) |
| Community & Social Service | 45 (40.2%) | 67 (59.8%) |
| Education, Arts & Media | 10 (40.0%) | 15 (60.0%) |
| Legal Services & Support | 0 (0.0%) | 0 (0.0%) |
| Education Instruction & Library | 32 (40.5%) | 47 (59.5%) |
| Arts, Media & Entertainment | 3 (37.5%) | 5 (62.5%) |
| Health Diagnosing & Treating | 19 (19.6%) | 78 (80.4%) |
| Health Technologists | 11 (16.7%) | 55 (83.3%) |
| Total (Category) | 171 (44.9%) | 210 (55.1%) |
| Total (Overall) | 416 (47.4%) | 461 (52.6%) |
Services Occupations
The most common Services occupations in Rushford are Personal Care & Service (50 | 5.7%), Security & Protection (28 | 3.2%), Law Enforcement (28 | 3.2%), Food Preparation & Serving (16 | 1.8%), and Healthcare Support (15 | 1.7%).

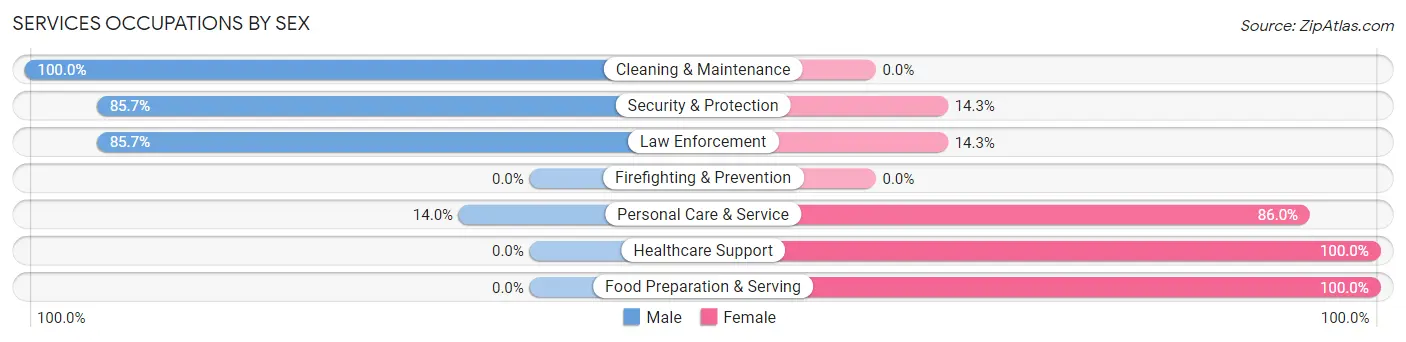
Services Occupations by Sex
Within the Services occupations in Rushford, the most male-oriented occupations are Cleaning & Maintenance (100.0%), Security & Protection (85.7%), and Law Enforcement (85.7%), while the most female-oriented occupations are Healthcare Support (100.0%), Food Preparation & Serving (100.0%), and Personal Care & Service (86.0%).
| Occupation | Male | Female |
| Healthcare Support | 0 (0.0%) | 15 (100.0%) |
| Security & Protection | 24 (85.7%) | 4 (14.3%) |
| Firefighting & Prevention | 0 (0.0%) | 0 (0.0%) |
| Law Enforcement | 24 (85.7%) | 4 (14.3%) |
| Food Preparation & Serving | 0 (0.0%) | 16 (100.0%) |
| Cleaning & Maintenance | 3 (100.0%) | 0 (0.0%) |
| Personal Care & Service | 7 (14.0%) | 43 (86.0%) |
| Total (Category) | 34 (30.4%) | 78 (69.6%) |
| Total (Overall) | 416 (47.4%) | 461 (52.6%) |
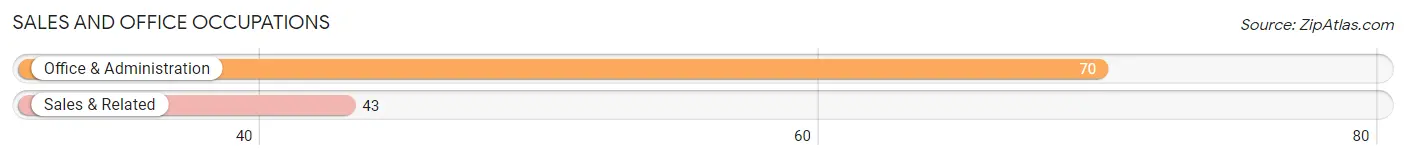
Sales and Office Occupations
The most common Sales and Office occupations in Rushford are Office & Administration (70 | 8.0%), and Sales & Related (43 | 4.9%).
Sales and Office Occupations by Sex
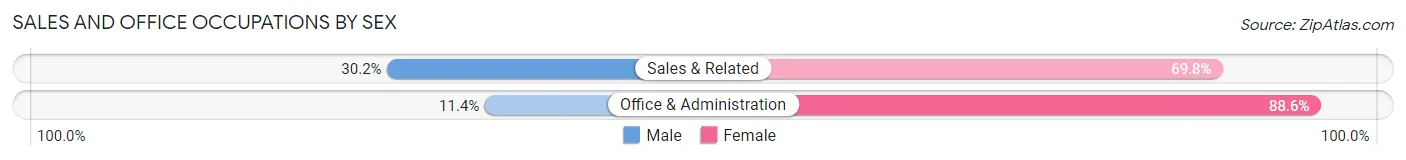
| Occupation | Male | Female |
| Sales & Related | 13 (30.2%) | 30 (69.8%) |
| Office & Administration | 8 (11.4%) | 62 (88.6%) |
| Total (Category) | 21 (18.6%) | 92 (81.4%) |
| Total (Overall) | 416 (47.4%) | 461 (52.6%) |
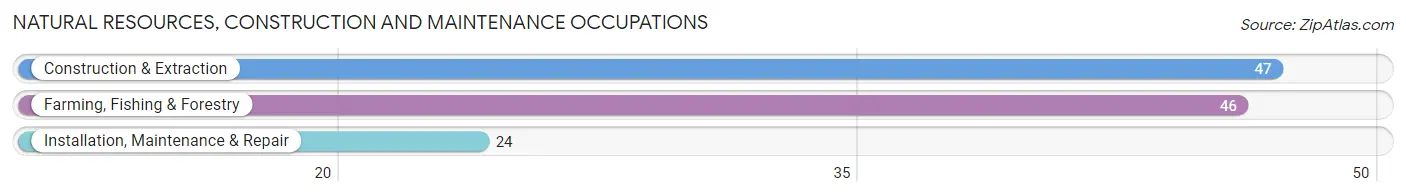
Natural Resources, Construction and Maintenance Occupations
The most common Natural Resources, Construction and Maintenance occupations in Rushford are Construction & Extraction (47 | 5.4%), Farming, Fishing & Forestry (46 | 5.2%), and Installation, Maintenance & Repair (24 | 2.7%).
Natural Resources, Construction and Maintenance Occupations by Sex
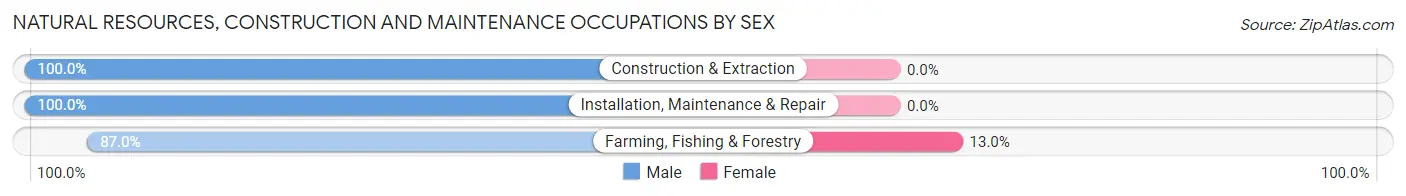
| Occupation | Male | Female |
| Farming, Fishing & Forestry | 40 (87.0%) | 6 (13.0%) |
| Construction & Extraction | 47 (100.0%) | 0 (0.0%) |
| Installation, Maintenance & Repair | 24 (100.0%) | 0 (0.0%) |
| Total (Category) | 111 (94.9%) | 6 (5.1%) |
| Total (Overall) | 416 (47.4%) | 461 (52.6%) |
Production, Transportation and Moving Occupations
The most common Production, Transportation and Moving occupations in Rushford are Production (86 | 9.8%), Material Moving (38 | 4.3%), and Transportation (30 | 3.4%).
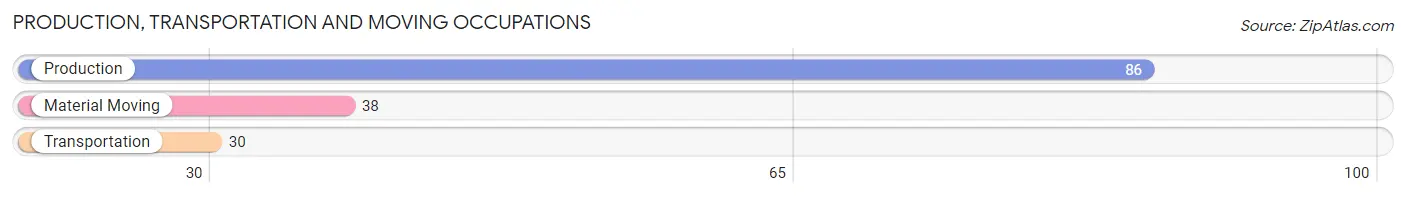
Production, Transportation and Moving Occupations by Sex
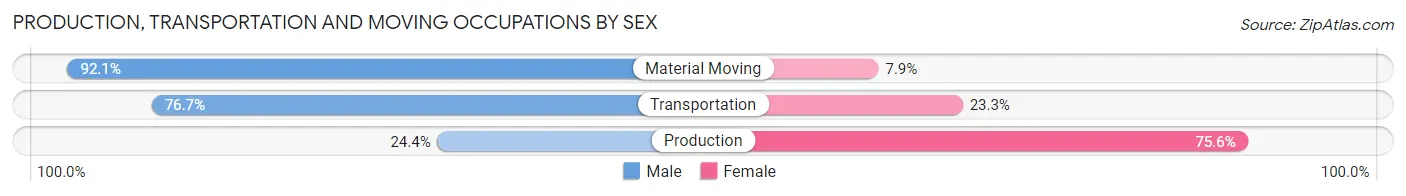
| Occupation | Male | Female |
| Production | 21 (24.4%) | 65 (75.6%) |
| Transportation | 23 (76.7%) | 7 (23.3%) |
| Material Moving | 35 (92.1%) | 3 (7.9%) |
| Total (Category) | 79 (51.3%) | 75 (48.7%) |
| Total (Overall) | 416 (47.4%) | 461 (52.6%) |
Employment Industries by Sex in Rushford
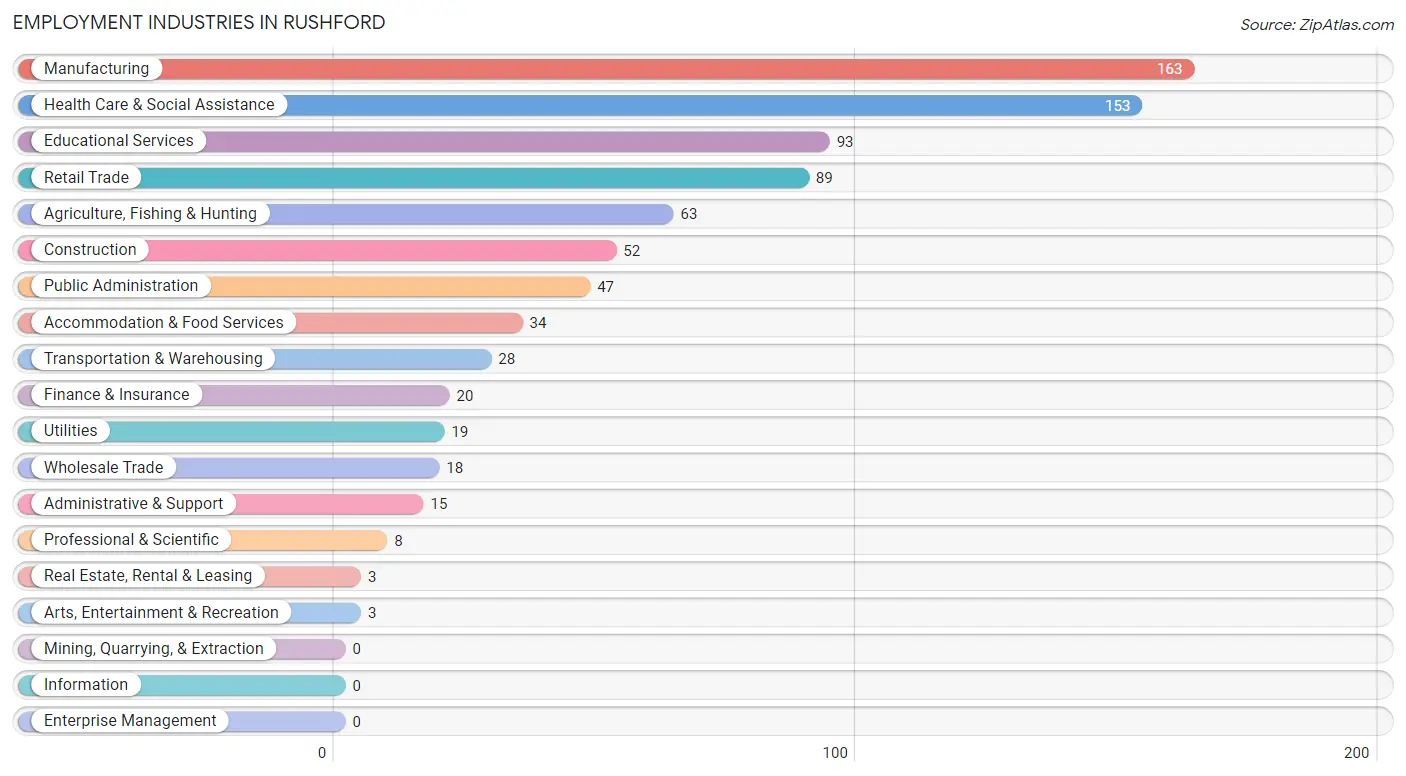
Employment Industries in Rushford
The major employment industries in Rushford include Manufacturing (163 | 18.6%), Health Care & Social Assistance (153 | 17.4%), Educational Services (93 | 10.6%), Retail Trade (89 | 10.2%), and Agriculture, Fishing & Hunting (63 | 7.2%).
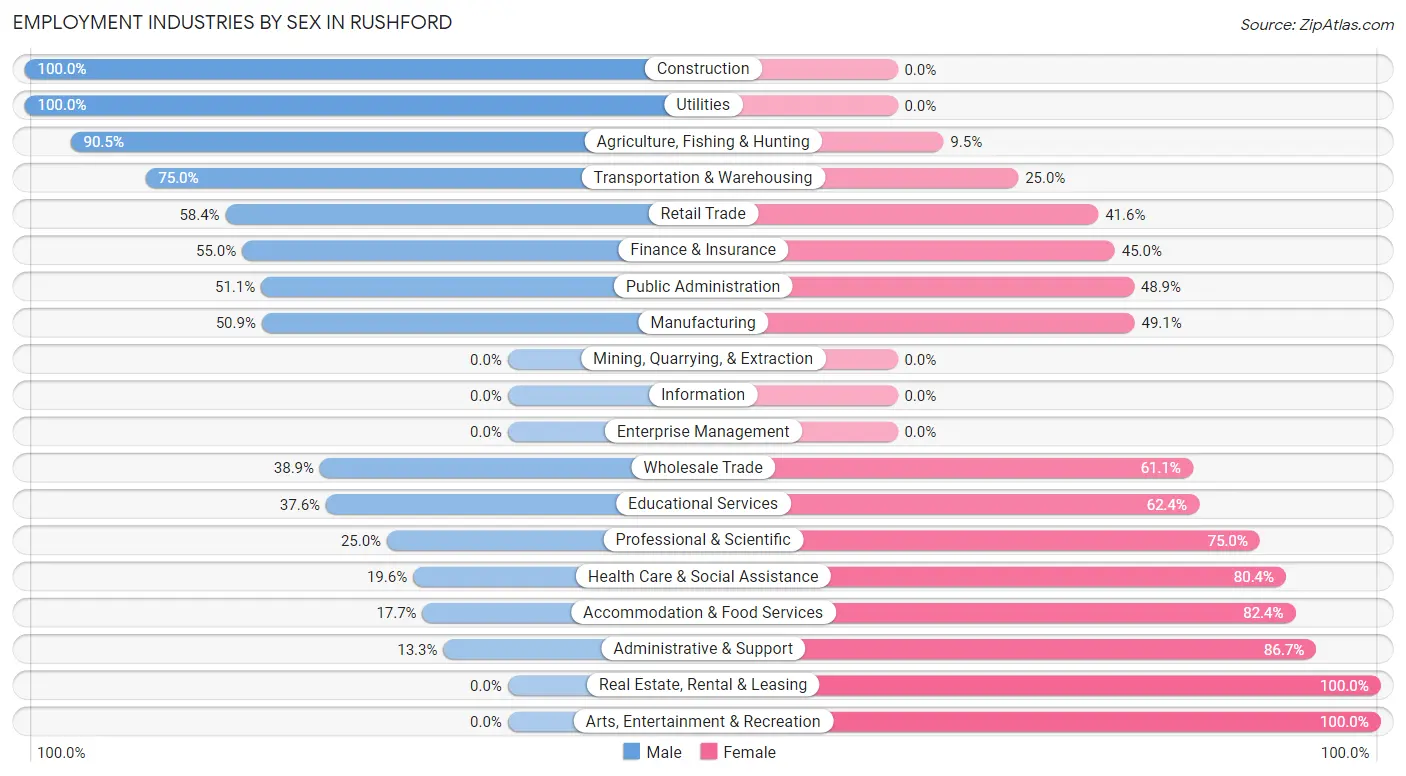
Employment Industries by Sex in Rushford
The Rushford industries that see more men than women are Construction (100.0%), Utilities (100.0%), and Agriculture, Fishing & Hunting (90.5%), whereas the industries that tend to have a higher number of women are Real Estate, Rental & Leasing (100.0%), Arts, Entertainment & Recreation (100.0%), and Administrative & Support (86.7%).
| Industry | Male | Female |
| Agriculture, Fishing & Hunting | 57 (90.5%) | 6 (9.5%) |
| Mining, Quarrying, & Extraction | 0 (0.0%) | 0 (0.0%) |
| Construction | 52 (100.0%) | 0 (0.0%) |
| Manufacturing | 83 (50.9%) | 80 (49.1%) |
| Wholesale Trade | 7 (38.9%) | 11 (61.1%) |
| Retail Trade | 52 (58.4%) | 37 (41.6%) |
| Transportation & Warehousing | 21 (75.0%) | 7 (25.0%) |
| Utilities | 19 (100.0%) | 0 (0.0%) |
| Information | 0 (0.0%) | 0 (0.0%) |
| Finance & Insurance | 11 (55.0%) | 9 (45.0%) |
| Real Estate, Rental & Leasing | 0 (0.0%) | 3 (100.0%) |
| Professional & Scientific | 2 (25.0%) | 6 (75.0%) |
| Enterprise Management | 0 (0.0%) | 0 (0.0%) |
| Administrative & Support | 2 (13.3%) | 13 (86.7%) |
| Educational Services | 35 (37.6%) | 58 (62.4%) |
| Health Care & Social Assistance | 30 (19.6%) | 123 (80.4%) |
| Arts, Entertainment & Recreation | 0 (0.0%) | 3 (100.0%) |
| Accommodation & Food Services | 6 (17.6%) | 28 (82.4%) |
| Public Administration | 24 (51.1%) | 23 (48.9%) |
| Total | 416 (47.4%) | 461 (52.6%) |
Education in Rushford
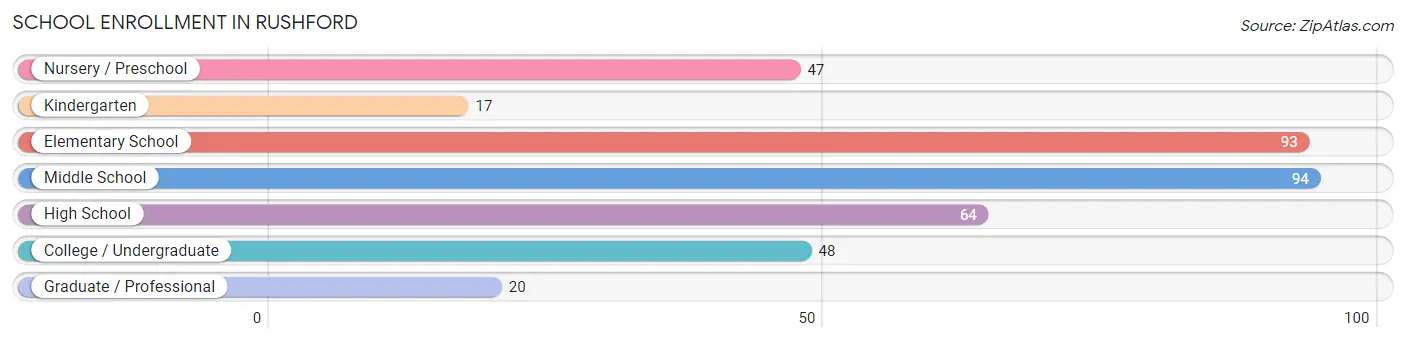
School Enrollment in Rushford
The most common levels of schooling among the 383 students in Rushford are middle school (94 | 24.5%), elementary school (93 | 24.3%), and high school (64 | 16.7%).
| School Level | # Students | % Students |
| Nursery / Preschool | 47 | 12.3% |
| Kindergarten | 17 | 4.4% |
| Elementary School | 93 | 24.3% |
| Middle School | 94 | 24.5% |
| High School | 64 | 16.7% |
| College / Undergraduate | 48 | 12.5% |
| Graduate / Professional | 20 | 5.2% |
| Total | 383 | 100.0% |
School Enrollment by Age by Funding Source in Rushford
Out of a total of 383 students who are enrolled in schools in Rushford, 16 (4.2%) attend a private institution, while the remaining 367 (95.8%) are enrolled in public schools. The age group of 35 years and over has the highest likelihood of being enrolled in private schools, with 7 (70.0% in the age bracket) enrolled. Conversely, the age group of 3 to 4 year olds has the lowest likelihood of being enrolled in a private school, with 32 (100.0% in the age bracket) attending a public institution.
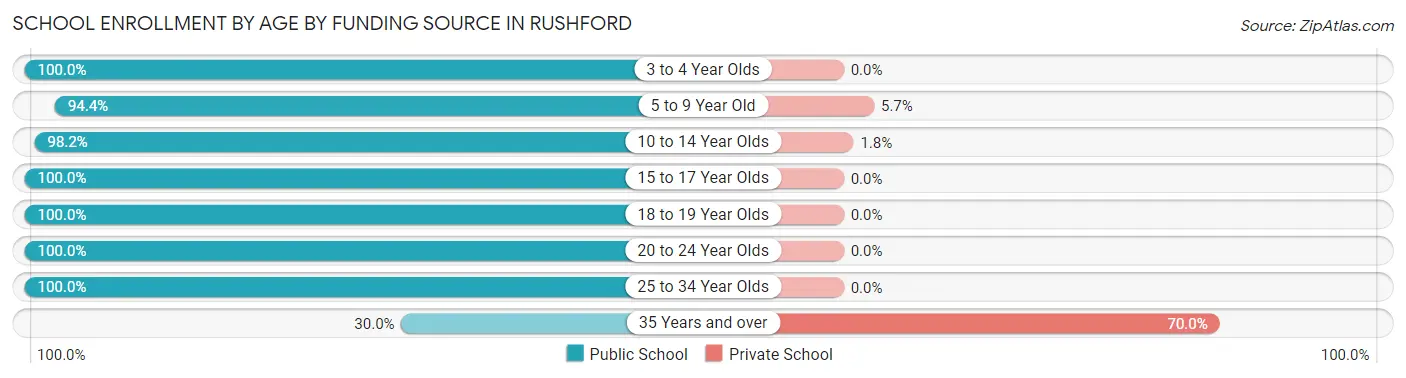
| Age Bracket | Public School | Private School |
| 3 to 4 Year Olds | 32 (100.0%) | 0 (0.0%) |
| 5 to 9 Year Old | 117 (94.4%) | 7 (5.7%) |
| 10 to 14 Year Olds | 107 (98.2%) | 2 (1.8%) |
| 15 to 17 Year Olds | 48 (100.0%) | 0 (0.0%) |
| 18 to 19 Year Olds | 23 (100.0%) | 0 (0.0%) |
| 20 to 24 Year Olds | 10 (100.0%) | 0 (0.0%) |
| 25 to 34 Year Olds | 27 (100.0%) | 0 (0.0%) |
| 35 Years and over | 3 (30.0%) | 7 (70.0%) |
| Total | 367 (95.8%) | 16 (4.2%) |
Educational Attainment by Field of Study in Rushford
Science & technology (85 | 21.5%), education (85 | 21.5%), business (50 | 12.6%), arts & humanities (32 | 8.1%), and liberal arts & history (24 | 6.1%) are the most common fields of study among 396 individuals in Rushford who have obtained a bachelor's degree or higher.
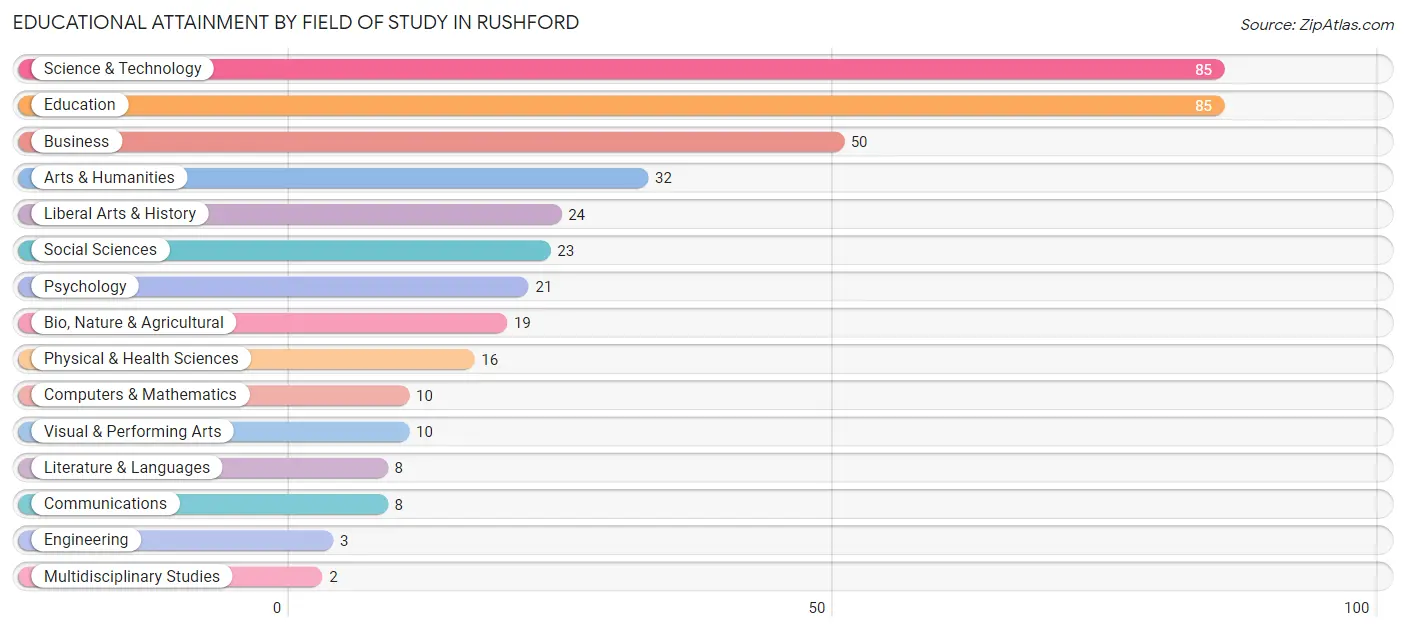
| Field of Study | # Graduates | % Graduates |
| Computers & Mathematics | 10 | 2.5% |
| Bio, Nature & Agricultural | 19 | 4.8% |
| Physical & Health Sciences | 16 | 4.0% |
| Psychology | 21 | 5.3% |
| Social Sciences | 23 | 5.8% |
| Engineering | 3 | 0.8% |
| Multidisciplinary Studies | 2 | 0.5% |
| Science & Technology | 85 | 21.5% |
| Business | 50 | 12.6% |
| Education | 85 | 21.5% |
| Literature & Languages | 8 | 2.0% |
| Liberal Arts & History | 24 | 6.1% |
| Visual & Performing Arts | 10 | 2.5% |
| Communications | 8 | 2.0% |
| Arts & Humanities | 32 | 8.1% |
| Total | 396 | 100.0% |
Transportation & Commute in Rushford
Vehicle Availability by Sex in Rushford
The most prevalent vehicle ownership categories in Rushford are males with 2 vehicles (188, accounting for 45.5%) and females with 2 vehicles (185, making up 43.0%).
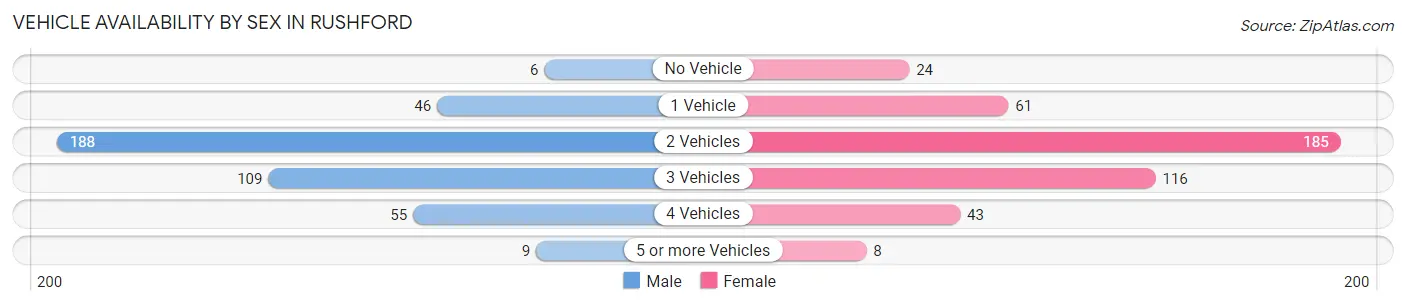
| Vehicles Available | Male | Female |
| No Vehicle | 6 (1.5%) | 24 (5.5%) |
| 1 Vehicle | 46 (11.1%) | 61 (14.0%) |
| 2 Vehicles | 188 (45.5%) | 185 (42.3%) |
| 3 Vehicles | 109 (26.4%) | 116 (26.5%) |
| 4 Vehicles | 55 (13.3%) | 43 (9.8%) |
| 5 or more Vehicles | 9 (2.2%) | 8 (1.8%) |
| Total | 413 (100.0%) | 437 (100.0%) |
Commute Time in Rushford
The most frequently occuring commute durations in Rushford are 30 to 34 minutes (202 commuters, 25.3%), 5 to 9 minutes (110 commuters, 13.8%), and 45 to 59 minutes (105 commuters, 13.2%).
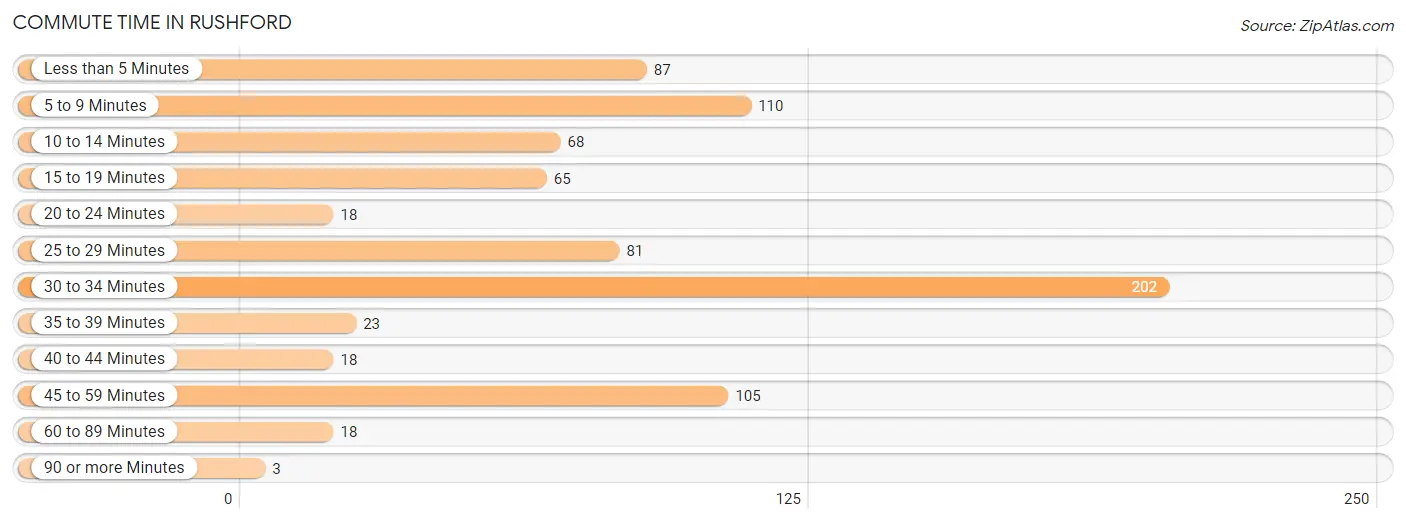
| Commute Time | # Commuters | % Commuters |
| Less than 5 Minutes | 87 | 10.9% |
| 5 to 9 Minutes | 110 | 13.8% |
| 10 to 14 Minutes | 68 | 8.5% |
| 15 to 19 Minutes | 65 | 8.2% |
| 20 to 24 Minutes | 18 | 2.3% |
| 25 to 29 Minutes | 81 | 10.2% |
| 30 to 34 Minutes | 202 | 25.3% |
| 35 to 39 Minutes | 23 | 2.9% |
| 40 to 44 Minutes | 18 | 2.3% |
| 45 to 59 Minutes | 105 | 13.2% |
| 60 to 89 Minutes | 18 | 2.3% |
| 90 or more Minutes | 3 | 0.4% |
Commute Time by Sex in Rushford
The most common commute times in Rushford are 30 to 34 minutes (89 commuters, 22.8%) for males and 30 to 34 minutes (113 commuters, 27.7%) for females.
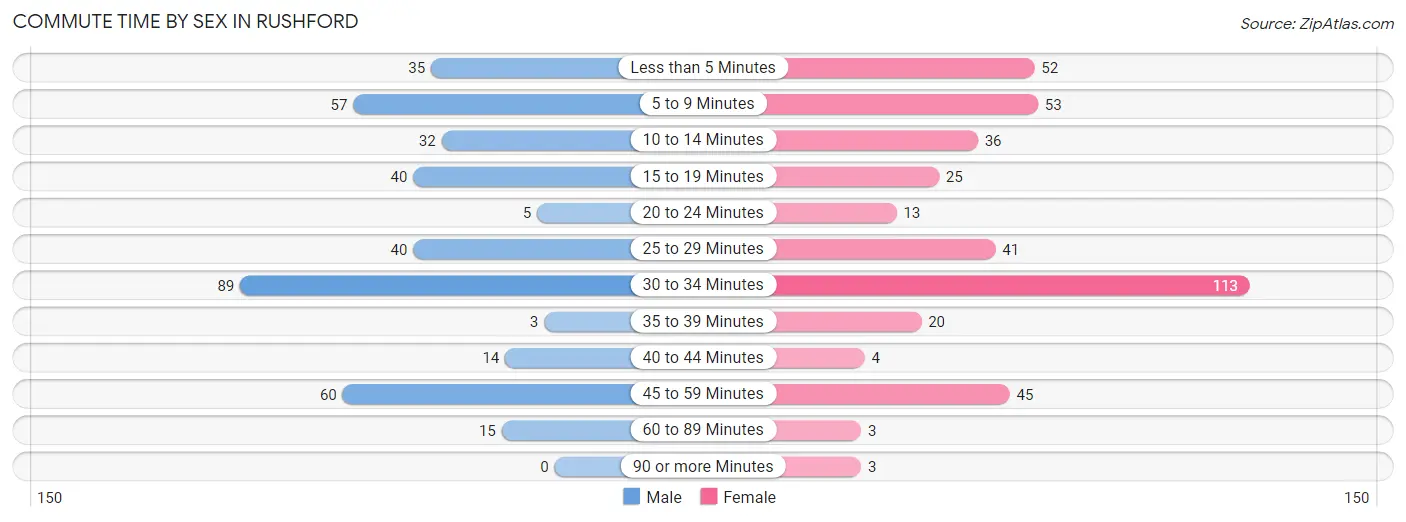
| Commute Time | Male | Female |
| Less than 5 Minutes | 35 (9.0%) | 52 (12.8%) |
| 5 to 9 Minutes | 57 (14.6%) | 53 (13.0%) |
| 10 to 14 Minutes | 32 (8.2%) | 36 (8.8%) |
| 15 to 19 Minutes | 40 (10.3%) | 25 (6.1%) |
| 20 to 24 Minutes | 5 (1.3%) | 13 (3.2%) |
| 25 to 29 Minutes | 40 (10.3%) | 41 (10.1%) |
| 30 to 34 Minutes | 89 (22.8%) | 113 (27.7%) |
| 35 to 39 Minutes | 3 (0.8%) | 20 (4.9%) |
| 40 to 44 Minutes | 14 (3.6%) | 4 (1.0%) |
| 45 to 59 Minutes | 60 (15.4%) | 45 (11.0%) |
| 60 to 89 Minutes | 15 (3.8%) | 3 (0.7%) |
| 90 or more Minutes | 0 (0.0%) | 3 (0.7%) |
Time of Departure to Work by Sex in Rushford
The most frequent times of departure to work in Rushford are 7:00 AM to 7:29 AM (97, 24.9%) for males and 12:00 PM to 3:59 PM (84, 20.6%) for females.
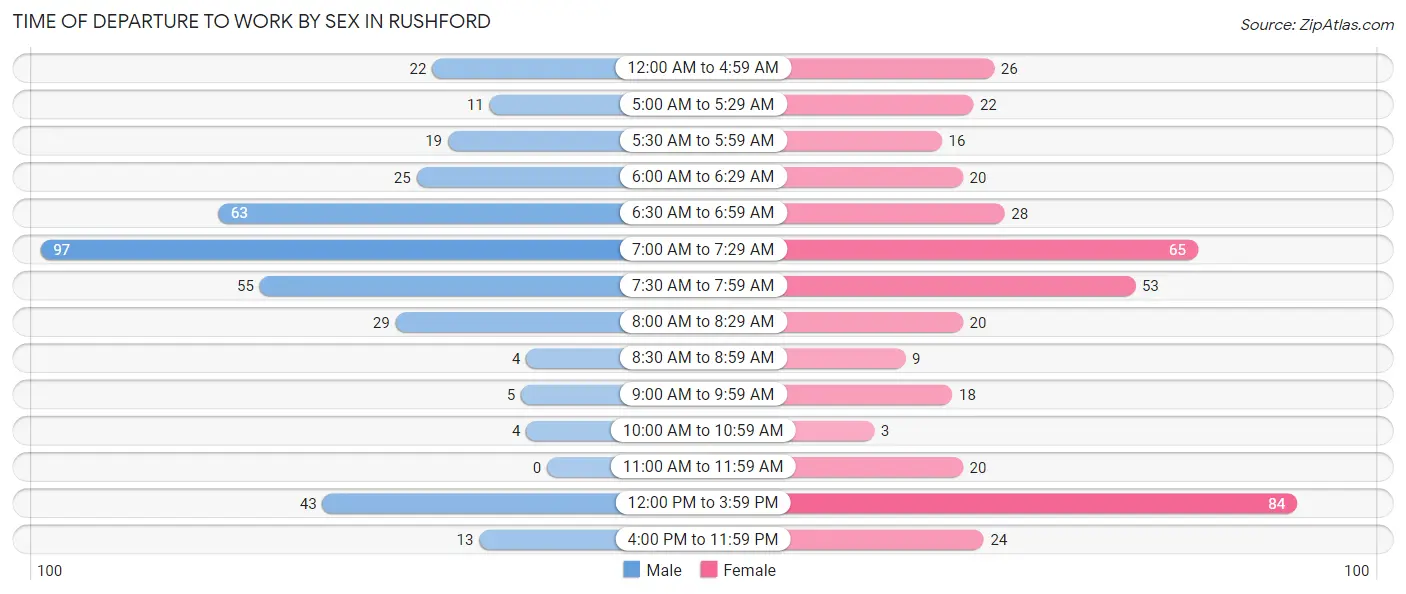
| Time of Departure | Male | Female |
| 12:00 AM to 4:59 AM | 22 (5.6%) | 26 (6.4%) |
| 5:00 AM to 5:29 AM | 11 (2.8%) | 22 (5.4%) |
| 5:30 AM to 5:59 AM | 19 (4.9%) | 16 (3.9%) |
| 6:00 AM to 6:29 AM | 25 (6.4%) | 20 (4.9%) |
| 6:30 AM to 6:59 AM | 63 (16.2%) | 28 (6.9%) |
| 7:00 AM to 7:29 AM | 97 (24.9%) | 65 (15.9%) |
| 7:30 AM to 7:59 AM | 55 (14.1%) | 53 (13.0%) |
| 8:00 AM to 8:29 AM | 29 (7.4%) | 20 (4.9%) |
| 8:30 AM to 8:59 AM | 4 (1.0%) | 9 (2.2%) |
| 9:00 AM to 9:59 AM | 5 (1.3%) | 18 (4.4%) |
| 10:00 AM to 10:59 AM | 4 (1.0%) | 3 (0.7%) |
| 11:00 AM to 11:59 AM | 0 (0.0%) | 20 (4.9%) |
| 12:00 PM to 3:59 PM | 43 (11.0%) | 84 (20.6%) |
| 4:00 PM to 11:59 PM | 13 (3.3%) | 24 (5.9%) |
| Total | 390 (100.0%) | 408 (100.0%) |
Housing Occupancy in Rushford
Occupancy by Ownership in Rushford
Of the total 728 dwellings in Rushford, owner-occupied units account for 536 (73.6%), while renter-occupied units make up 192 (26.4%).
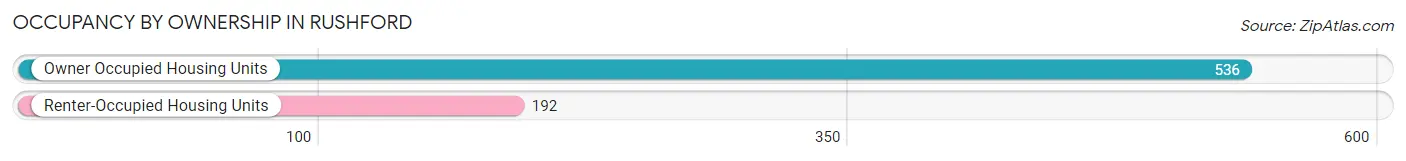
| Occupancy | # Housing Units | % Housing Units |
| Owner Occupied Housing Units | 536 | 73.6% |
| Renter-Occupied Housing Units | 192 | 26.4% |
| Total Occupied Housing Units | 728 | 100.0% |
Occupancy by Household Size in Rushford
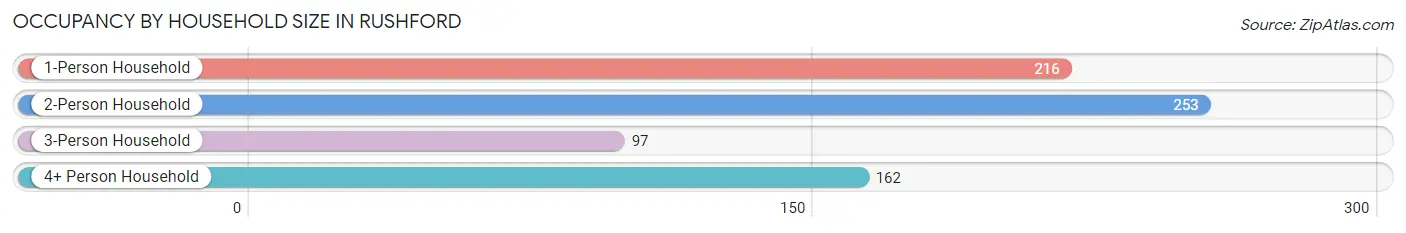
| Household Size | # Housing Units | % Housing Units |
| 1-Person Household | 216 | 29.7% |
| 2-Person Household | 253 | 34.7% |
| 3-Person Household | 97 | 13.3% |
| 4+ Person Household | 162 | 22.3% |
| Total Housing Units | 728 | 100.0% |
Occupancy by Ownership by Household Size in Rushford
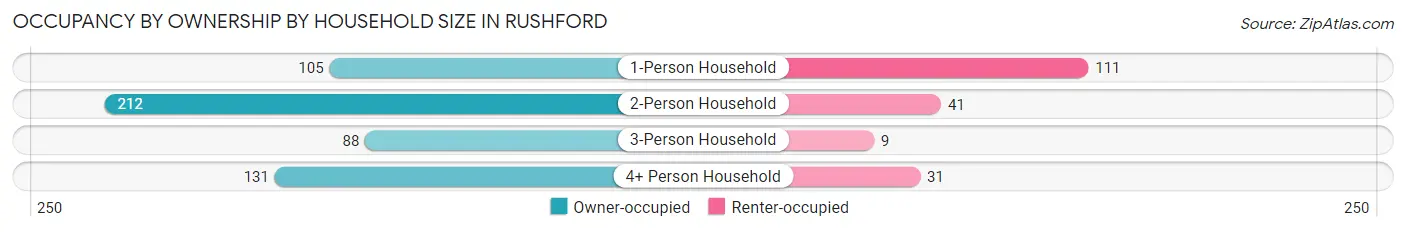
| Household Size | Owner-occupied | Renter-occupied |
| 1-Person Household | 105 (48.6%) | 111 (51.4%) |
| 2-Person Household | 212 (83.8%) | 41 (16.2%) |
| 3-Person Household | 88 (90.7%) | 9 (9.3%) |
| 4+ Person Household | 131 (80.9%) | 31 (19.1%) |
| Total Housing Units | 536 (73.6%) | 192 (26.4%) |
Occupancy by Educational Attainment in Rushford
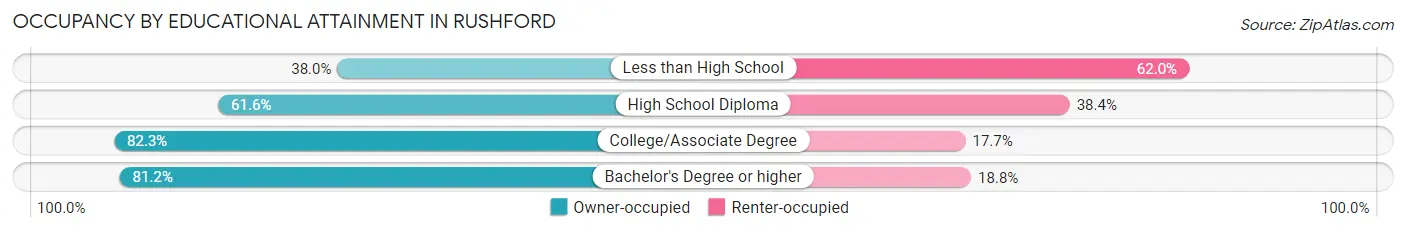
| Household Size | Owner-occupied | Renter-occupied |
| Less than High School | 19 (38.0%) | 31 (62.0%) |
| High School Diploma | 114 (61.6%) | 71 (38.4%) |
| College/Associate Degree | 209 (82.3%) | 45 (17.7%) |
| Bachelor's Degree or higher | 194 (81.2%) | 45 (18.8%) |
Occupancy by Age of Householder in Rushford
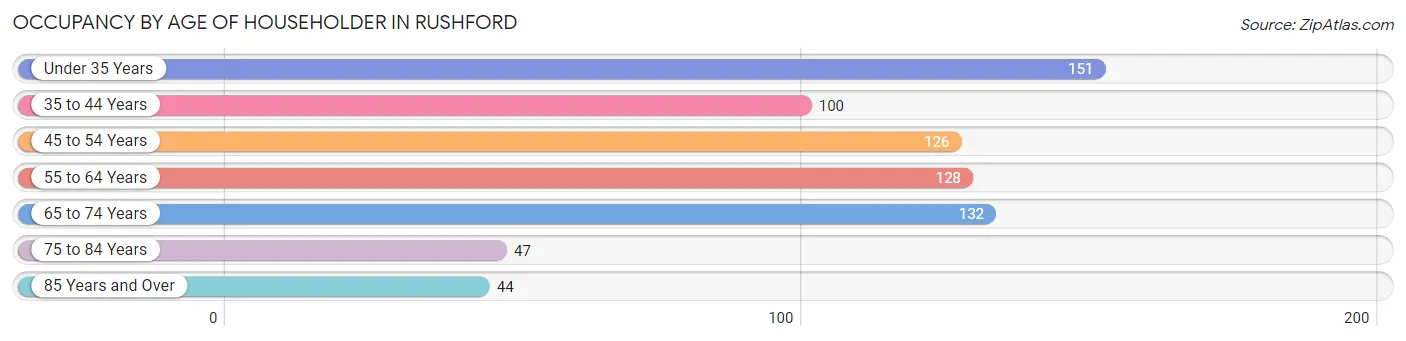
| Age Bracket | # Households | % Households |
| Under 35 Years | 151 | 20.7% |
| 35 to 44 Years | 100 | 13.7% |
| 45 to 54 Years | 126 | 17.3% |
| 55 to 64 Years | 128 | 17.6% |
| 65 to 74 Years | 132 | 18.1% |
| 75 to 84 Years | 47 | 6.5% |
| 85 Years and Over | 44 | 6.0% |
| Total | 728 | 100.0% |
Housing Finances in Rushford
Median Income by Occupancy in Rushford
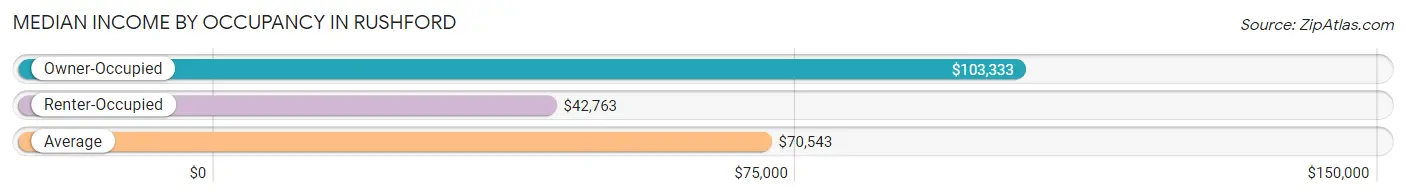
| Occupancy Type | # Households | Median Income |
| Owner-Occupied | 536 (73.6%) | $103,333 |
| Renter-Occupied | 192 (26.4%) | $42,763 |
| Average | 728 (100.0%) | $70,543 |
Occupancy by Householder Income Bracket in Rushford
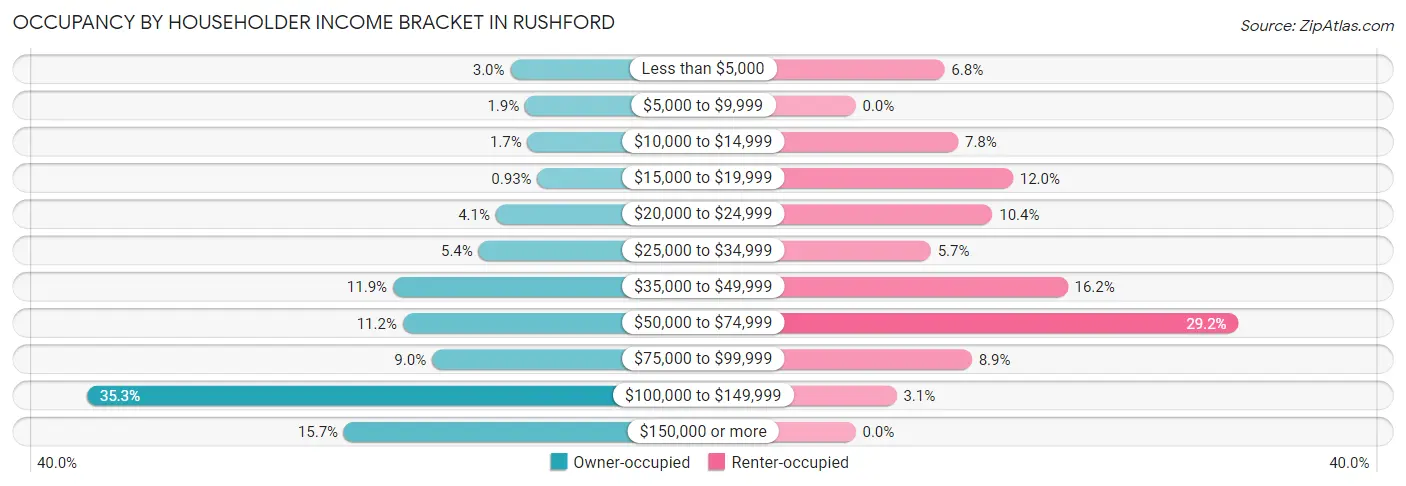
| Income Bracket | Owner-occupied | Renter-occupied |
| Less than $5,000 | 16 (3.0%) | 13 (6.8%) |
| $5,000 to $9,999 | 10 (1.9%) | 0 (0.0%) |
| $10,000 to $14,999 | 9 (1.7%) | 15 (7.8%) |
| $15,000 to $19,999 | 5 (0.9%) | 23 (12.0%) |
| $20,000 to $24,999 | 22 (4.1%) | 20 (10.4%) |
| $25,000 to $34,999 | 29 (5.4%) | 11 (5.7%) |
| $35,000 to $49,999 | 64 (11.9%) | 31 (16.2%) |
| $50,000 to $74,999 | 60 (11.2%) | 56 (29.2%) |
| $75,000 to $99,999 | 48 (9.0%) | 17 (8.8%) |
| $100,000 to $149,999 | 189 (35.3%) | 6 (3.1%) |
| $150,000 or more | 84 (15.7%) | 0 (0.0%) |
| Total | 536 (100.0%) | 192 (100.0%) |
Monthly Housing Cost Tiers in Rushford
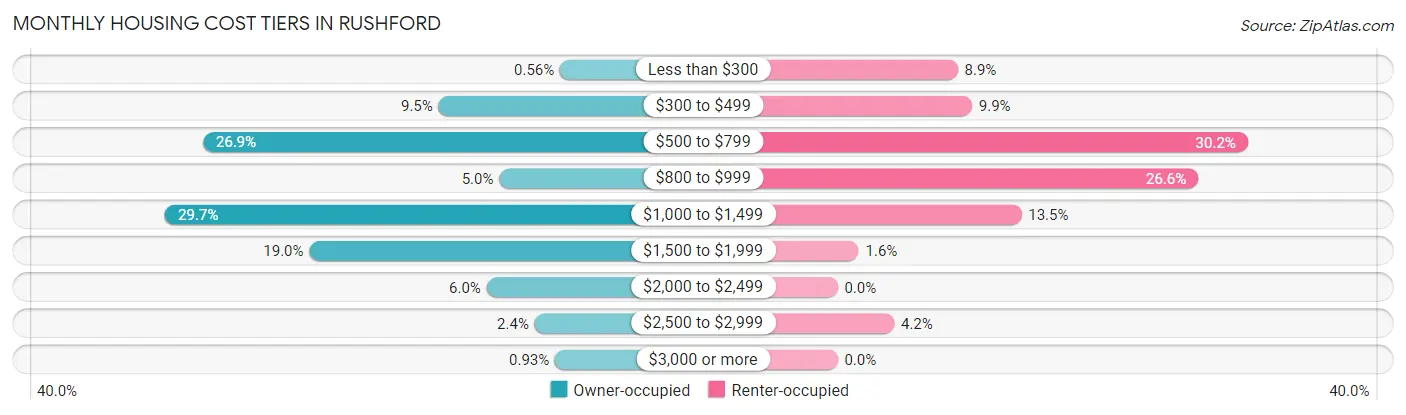
| Monthly Cost | Owner-occupied | Renter-occupied |
| Less than $300 | 3 (0.6%) | 17 (8.8%) |
| $300 to $499 | 51 (9.5%) | 19 (9.9%) |
| $500 to $799 | 144 (26.9%) | 58 (30.2%) |
| $800 to $999 | 27 (5.0%) | 51 (26.6%) |
| $1,000 to $1,499 | 159 (29.7%) | 26 (13.5%) |
| $1,500 to $1,999 | 102 (19.0%) | 3 (1.6%) |
| $2,000 to $2,499 | 32 (6.0%) | 0 (0.0%) |
| $2,500 to $2,999 | 13 (2.4%) | 8 (4.2%) |
| $3,000 or more | 5 (0.9%) | 0 (0.0%) |
| Total | 536 (100.0%) | 192 (100.0%) |
Physical Housing Characteristics in Rushford
Housing Structures in Rushford
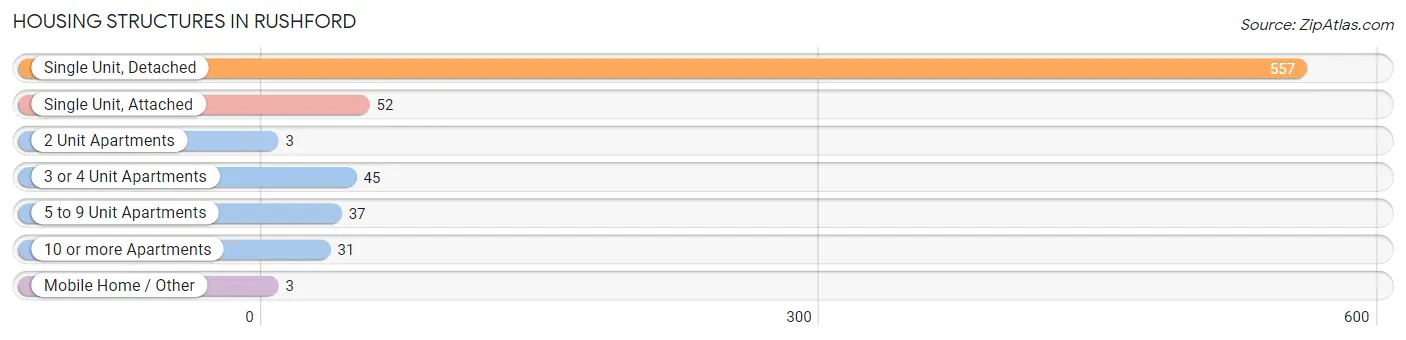
| Structure Type | # Housing Units | % Housing Units |
| Single Unit, Detached | 557 | 76.5% |
| Single Unit, Attached | 52 | 7.1% |
| 2 Unit Apartments | 3 | 0.4% |
| 3 or 4 Unit Apartments | 45 | 6.2% |
| 5 to 9 Unit Apartments | 37 | 5.1% |
| 10 or more Apartments | 31 | 4.3% |
| Mobile Home / Other | 3 | 0.4% |
| Total | 728 | 100.0% |
Housing Structures by Occupancy in Rushford
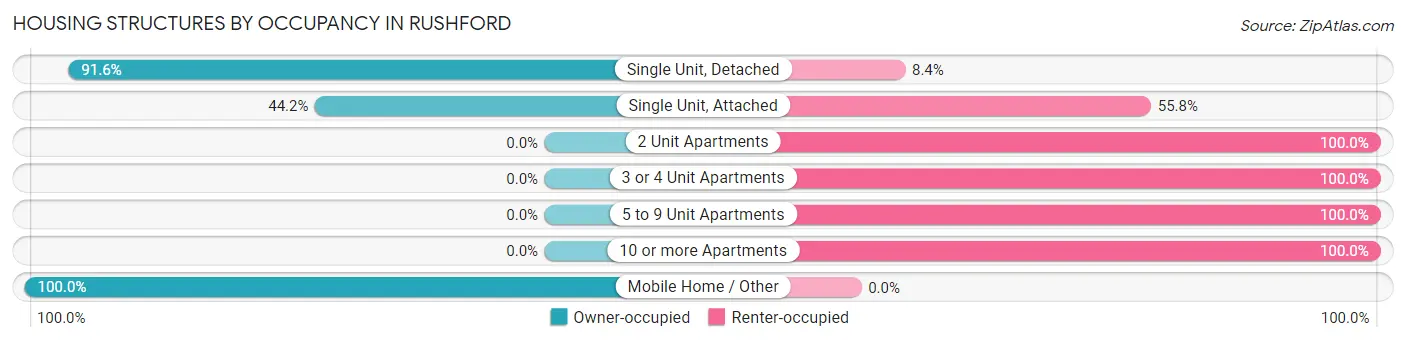
| Structure Type | Owner-occupied | Renter-occupied |
| Single Unit, Detached | 510 (91.6%) | 47 (8.4%) |
| Single Unit, Attached | 23 (44.2%) | 29 (55.8%) |
| 2 Unit Apartments | 0 (0.0%) | 3 (100.0%) |
| 3 or 4 Unit Apartments | 0 (0.0%) | 45 (100.0%) |
| 5 to 9 Unit Apartments | 0 (0.0%) | 37 (100.0%) |
| 10 or more Apartments | 0 (0.0%) | 31 (100.0%) |
| Mobile Home / Other | 3 (100.0%) | 0 (0.0%) |
| Total | 536 (73.6%) | 192 (26.4%) |
Housing Structures by Number of Rooms in Rushford
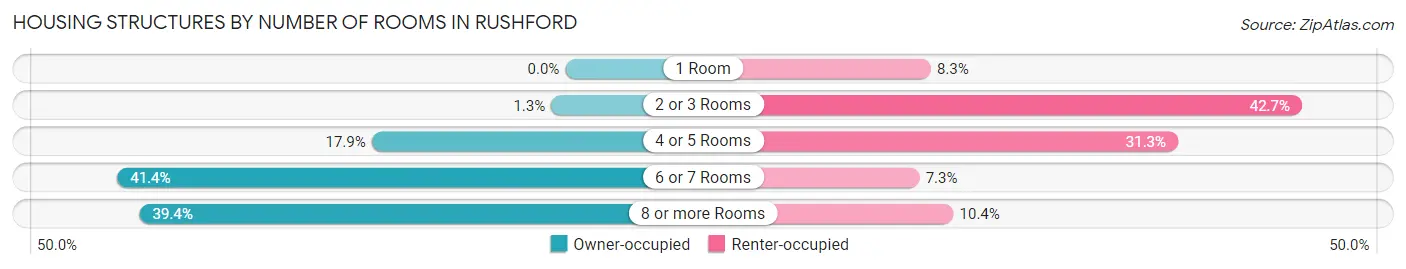
| Number of Rooms | Owner-occupied | Renter-occupied |
| 1 Room | 0 (0.0%) | 16 (8.3%) |
| 2 or 3 Rooms | 7 (1.3%) | 82 (42.7%) |
| 4 or 5 Rooms | 96 (17.9%) | 60 (31.2%) |
| 6 or 7 Rooms | 222 (41.4%) | 14 (7.3%) |
| 8 or more Rooms | 211 (39.4%) | 20 (10.4%) |
| Total | 536 (100.0%) | 192 (100.0%) |
Housing Structure by Heating Type in Rushford
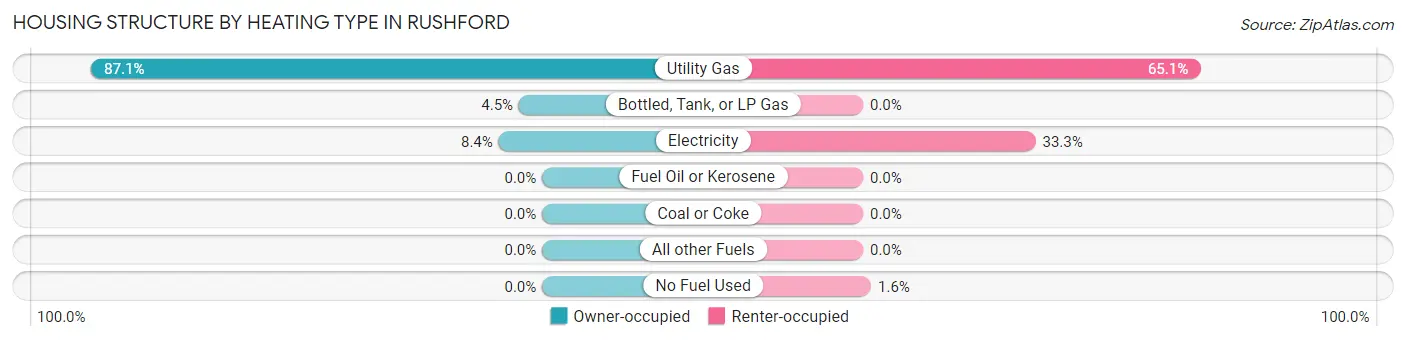
| Heating Type | Owner-occupied | Renter-occupied |
| Utility Gas | 467 (87.1%) | 125 (65.1%) |
| Bottled, Tank, or LP Gas | 24 (4.5%) | 0 (0.0%) |
| Electricity | 45 (8.4%) | 64 (33.3%) |
| Fuel Oil or Kerosene | 0 (0.0%) | 0 (0.0%) |
| Coal or Coke | 0 (0.0%) | 0 (0.0%) |
| All other Fuels | 0 (0.0%) | 0 (0.0%) |
| No Fuel Used | 0 (0.0%) | 3 (1.6%) |
| Total | 536 (100.0%) | 192 (100.0%) |
Household Vehicle Usage in Rushford
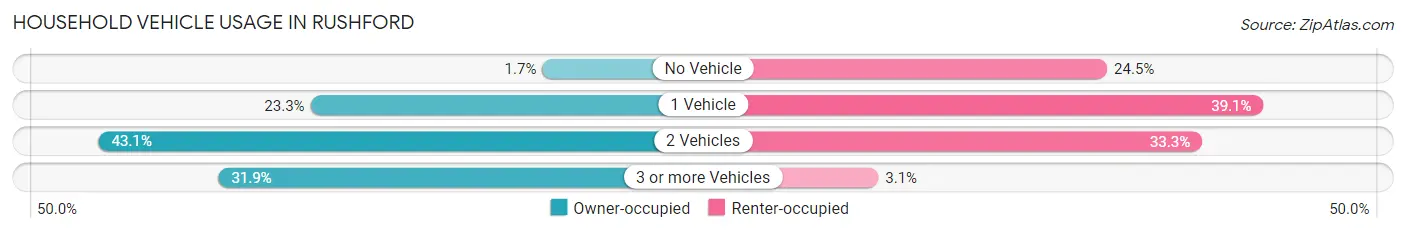
| Vehicles per Household | Owner-occupied | Renter-occupied |
| No Vehicle | 9 (1.7%) | 47 (24.5%) |
| 1 Vehicle | 125 (23.3%) | 75 (39.1%) |
| 2 Vehicles | 231 (43.1%) | 64 (33.3%) |
| 3 or more Vehicles | 171 (31.9%) | 6 (3.1%) |
| Total | 536 (100.0%) | 192 (100.0%) |
Real Estate & Mortgages in Rushford
Real Estate and Mortgage Overview in Rushford
| Characteristic | Without Mortgage | With Mortgage |
| Housing Units | 192 | 344 |
| Median Property Value | $196,700 | $195,900 |
| Median Household Income | $48,750 | $58 |
| Monthly Housing Costs | $573 | $5 |
| Real Estate Taxes | $2,360 | $17 |
Property Value by Mortgage Status in Rushford
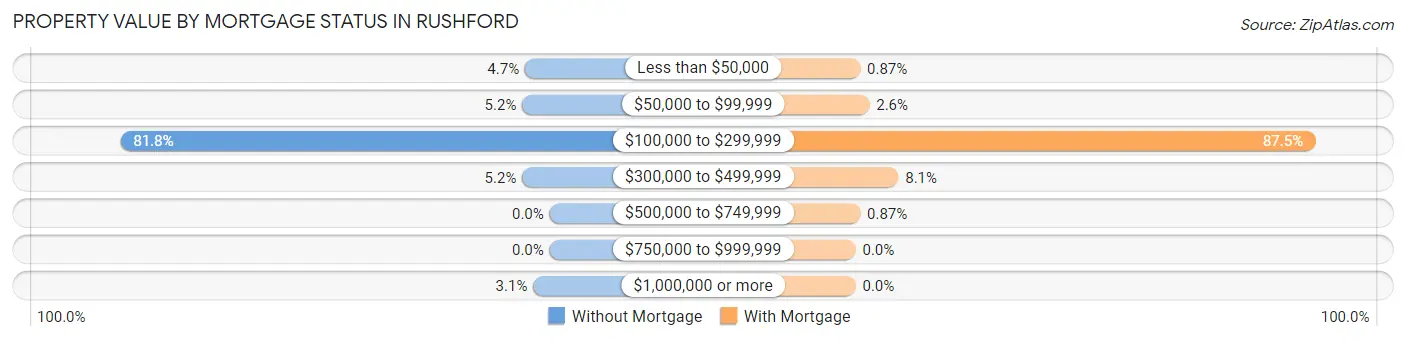
| Property Value | Without Mortgage | With Mortgage |
| Less than $50,000 | 9 (4.7%) | 3 (0.9%) |
| $50,000 to $99,999 | 10 (5.2%) | 9 (2.6%) |
| $100,000 to $299,999 | 157 (81.8%) | 301 (87.5%) |
| $300,000 to $499,999 | 10 (5.2%) | 28 (8.1%) |
| $500,000 to $749,999 | 0 (0.0%) | 3 (0.9%) |
| $750,000 to $999,999 | 0 (0.0%) | 0 (0.0%) |
| $1,000,000 or more | 6 (3.1%) | 0 (0.0%) |
| Total | 192 (100.0%) | 344 (100.0%) |
Household Income by Mortgage Status in Rushford
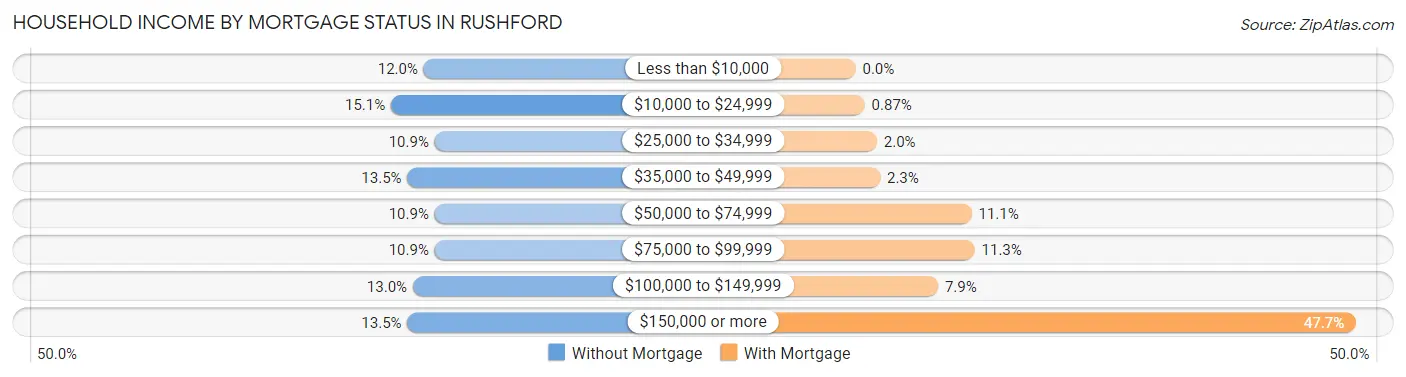
| Household Income | Without Mortgage | With Mortgage |
| Less than $10,000 | 23 (12.0%) | 0 (0.0%) |
| $10,000 to $24,999 | 29 (15.1%) | 3 (0.9%) |
| $25,000 to $34,999 | 21 (10.9%) | 7 (2.0%) |
| $35,000 to $49,999 | 26 (13.5%) | 8 (2.3%) |
| $50,000 to $74,999 | 21 (10.9%) | 38 (11.1%) |
| $75,000 to $99,999 | 21 (10.9%) | 39 (11.3%) |
| $100,000 to $149,999 | 25 (13.0%) | 27 (7.9%) |
| $150,000 or more | 26 (13.5%) | 164 (47.7%) |
| Total | 192 (100.0%) | 344 (100.0%) |
Property Value to Household Income Ratio in Rushford
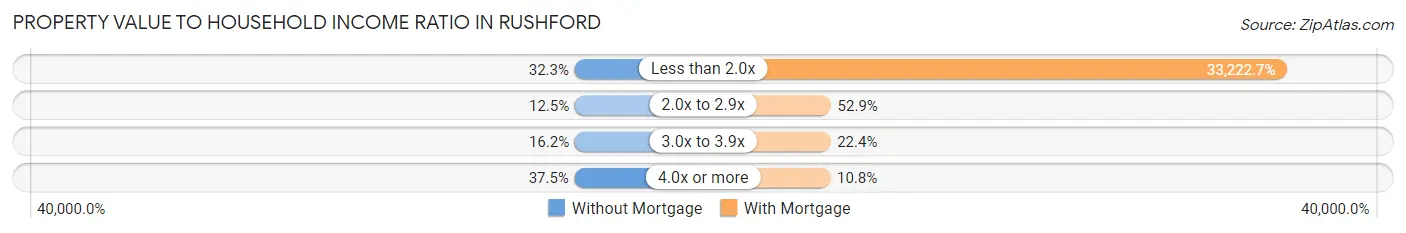
| Value-to-Income Ratio | Without Mortgage | With Mortgage |
| Less than 2.0x | 62 (32.3%) | 114,286 (33,222.7%) |
| 2.0x to 2.9x | 24 (12.5%) | 182 (52.9%) |
| 3.0x to 3.9x | 31 (16.2%) | 77 (22.4%) |
| 4.0x or more | 72 (37.5%) | 37 (10.8%) |
| Total | 192 (100.0%) | 344 (100.0%) |
Real Estate Taxes by Mortgage Status in Rushford
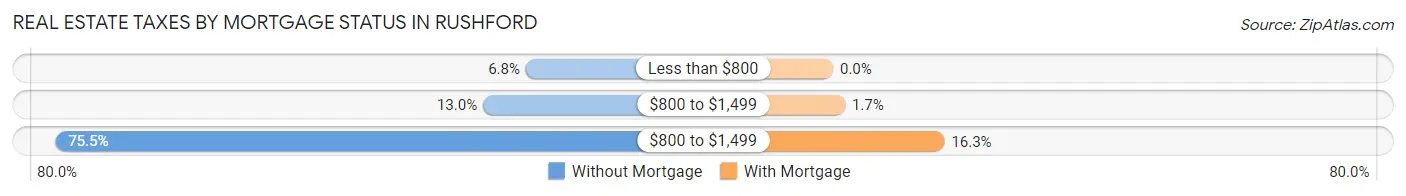
| Property Taxes | Without Mortgage | With Mortgage |
| Less than $800 | 13 (6.8%) | 0 (0.0%) |
| $800 to $1,499 | 25 (13.0%) | 6 (1.7%) |
| $800 to $1,499 | 145 (75.5%) | 56 (16.3%) |
| Total | 192 (100.0%) | 344 (100.0%) |
Health & Disability in Rushford
Health Insurance Coverage by Age in Rushford
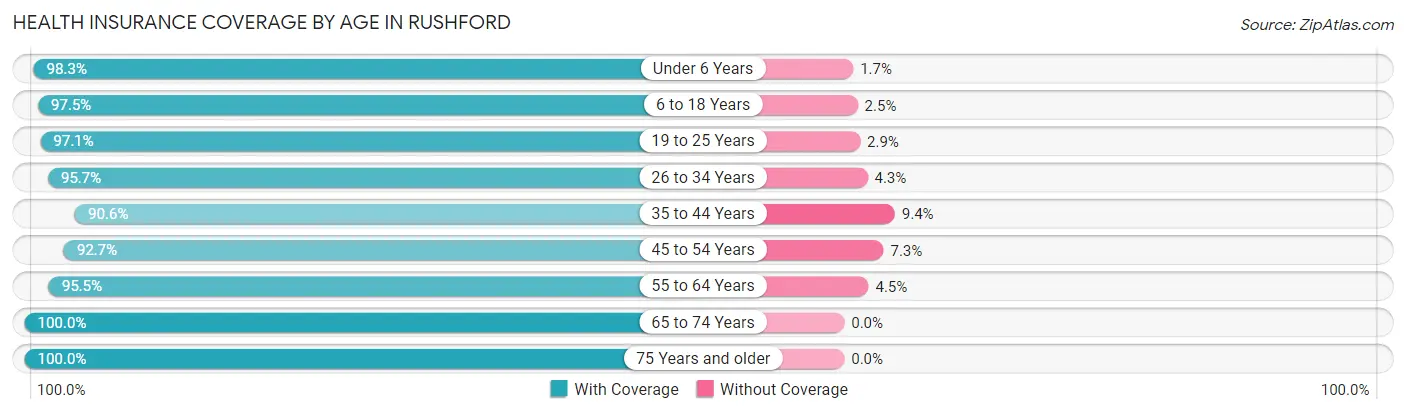
| Age Bracket | With Coverage | Without Coverage |
| Under 6 Years | 177 (98.3%) | 3 (1.7%) |
| 6 to 18 Years | 274 (97.5%) | 7 (2.5%) |
| 19 to 25 Years | 99 (97.1%) | 3 (2.9%) |
| 26 to 34 Years | 199 (95.7%) | 9 (4.3%) |
| 35 to 44 Years | 173 (90.6%) | 18 (9.4%) |
| 45 to 54 Years | 190 (92.7%) | 15 (7.3%) |
| 55 to 64 Years | 190 (95.5%) | 9 (4.5%) |
| 65 to 74 Years | 236 (100.0%) | 0 (0.0%) |
| 75 Years and older | 126 (100.0%) | 0 (0.0%) |
| Total | 1,664 (96.3%) | 64 (3.7%) |
Health Insurance Coverage by Citizenship Status in Rushford
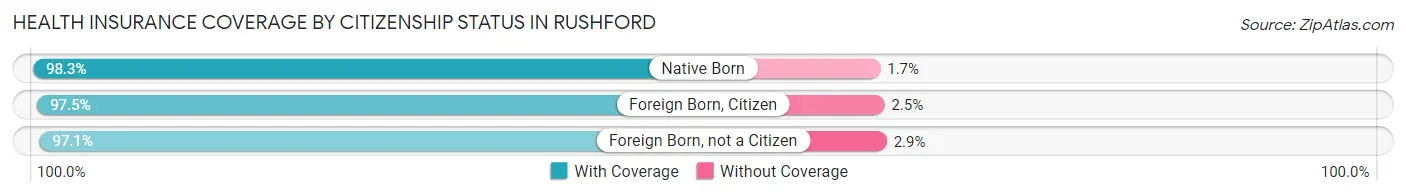
| Citizenship Status | With Coverage | Without Coverage |
| Native Born | 177 (98.3%) | 3 (1.7%) |
| Foreign Born, Citizen | 274 (97.5%) | 7 (2.5%) |
| Foreign Born, not a Citizen | 99 (97.1%) | 3 (2.9%) |
Health Insurance Coverage by Household Income in Rushford
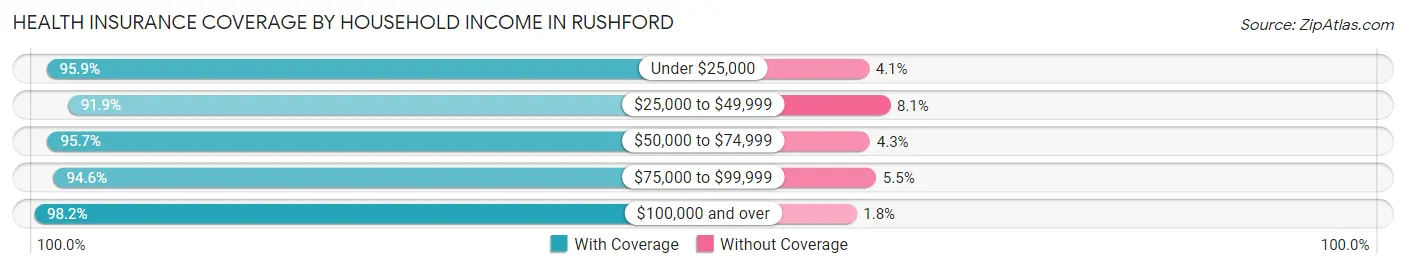
| Household Income | With Coverage | Without Coverage |
| Under $25,000 | 186 (95.9%) | 8 (4.1%) |
| $25,000 to $49,999 | 227 (91.9%) | 20 (8.1%) |
| $50,000 to $74,999 | 266 (95.7%) | 12 (4.3%) |
| $75,000 to $99,999 | 156 (94.6%) | 9 (5.4%) |
| $100,000 and over | 821 (98.2%) | 15 (1.8%) |
Public vs Private Health Insurance Coverage by Age in Rushford
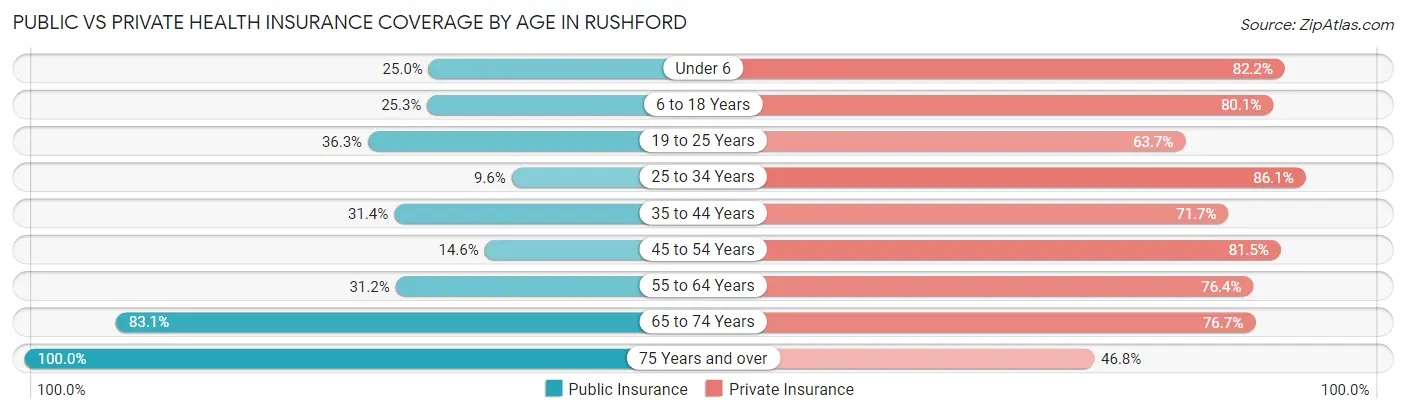
| Age Bracket | Public Insurance | Private Insurance |
| Under 6 | 45 (25.0%) | 148 (82.2%) |
| 6 to 18 Years | 71 (25.3%) | 225 (80.1%) |
| 19 to 25 Years | 37 (36.3%) | 65 (63.7%) |
| 25 to 34 Years | 20 (9.6%) | 179 (86.1%) |
| 35 to 44 Years | 60 (31.4%) | 137 (71.7%) |
| 45 to 54 Years | 30 (14.6%) | 167 (81.5%) |
| 55 to 64 Years | 62 (31.2%) | 152 (76.4%) |
| 65 to 74 Years | 196 (83.1%) | 181 (76.7%) |
| 75 Years and over | 126 (100.0%) | 59 (46.8%) |
| Total | 647 (37.4%) | 1,313 (76.0%) |
Disability Status by Sex by Age in Rushford
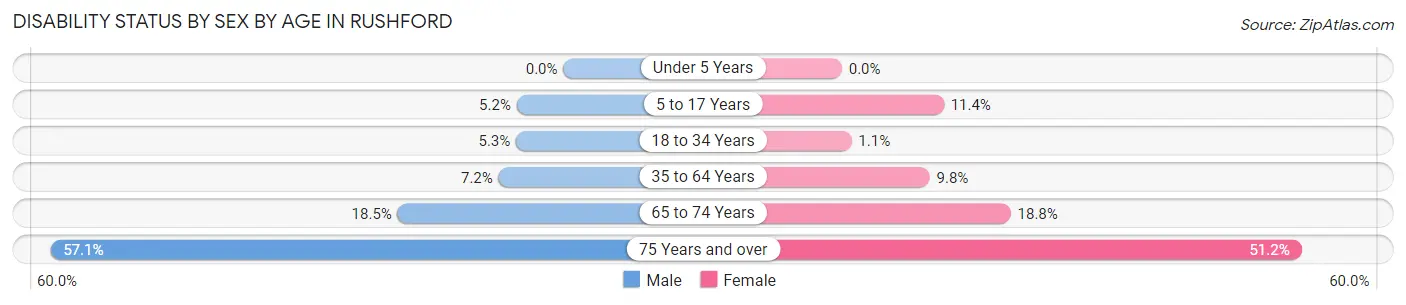
| Age Bracket | Male | Female |
| Under 5 Years | 0 (0.0%) | 0 (0.0%) |
| 5 to 17 Years | 8 (5.2%) | 16 (11.4%) |
| 18 to 34 Years | 7 (5.3%) | 2 (1.1%) |
| 35 to 64 Years | 23 (7.2%) | 27 (9.8%) |
| 65 to 74 Years | 19 (18.4%) | 25 (18.8%) |
| 75 Years and over | 24 (57.1%) | 43 (51.2%) |
Disability Class by Sex by Age in Rushford
Disability Class: Hearing Difficulty
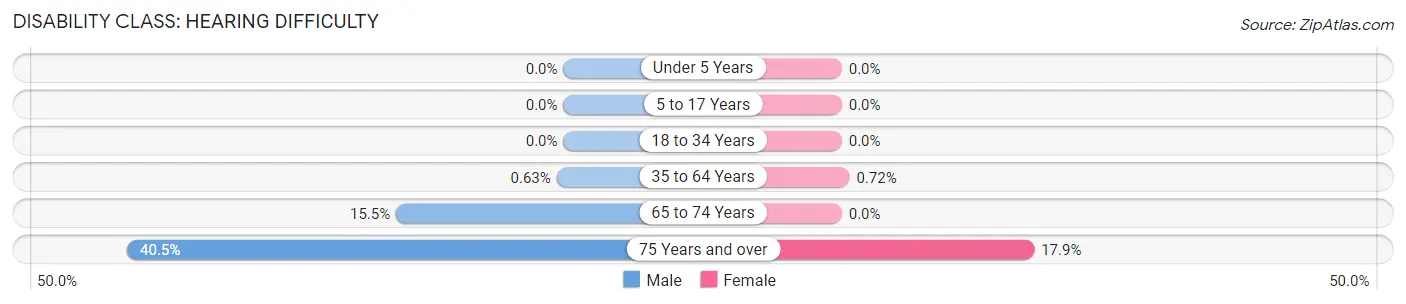
| Age Bracket | Male | Female |
| Under 5 Years | 0 (0.0%) | 0 (0.0%) |
| 5 to 17 Years | 0 (0.0%) | 0 (0.0%) |
| 18 to 34 Years | 0 (0.0%) | 0 (0.0%) |
| 35 to 64 Years | 2 (0.6%) | 2 (0.7%) |
| 65 to 74 Years | 16 (15.5%) | 0 (0.0%) |
| 75 Years and over | 17 (40.5%) | 15 (17.9%) |
Disability Class: Vision Difficulty
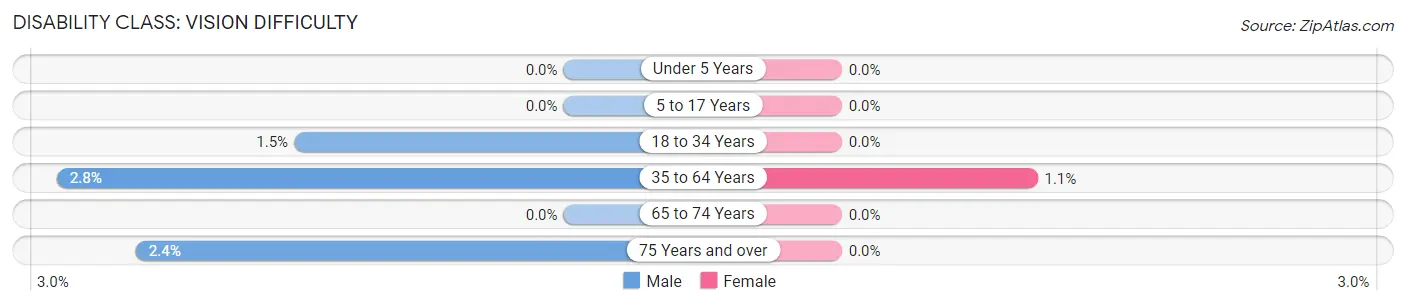
| Age Bracket | Male | Female |
| Under 5 Years | 0 (0.0%) | 0 (0.0%) |
| 5 to 17 Years | 0 (0.0%) | 0 (0.0%) |
| 18 to 34 Years | 2 (1.5%) | 0 (0.0%) |
| 35 to 64 Years | 9 (2.8%) | 3 (1.1%) |
| 65 to 74 Years | 0 (0.0%) | 0 (0.0%) |
| 75 Years and over | 1 (2.4%) | 0 (0.0%) |
Disability Class: Cognitive Difficulty
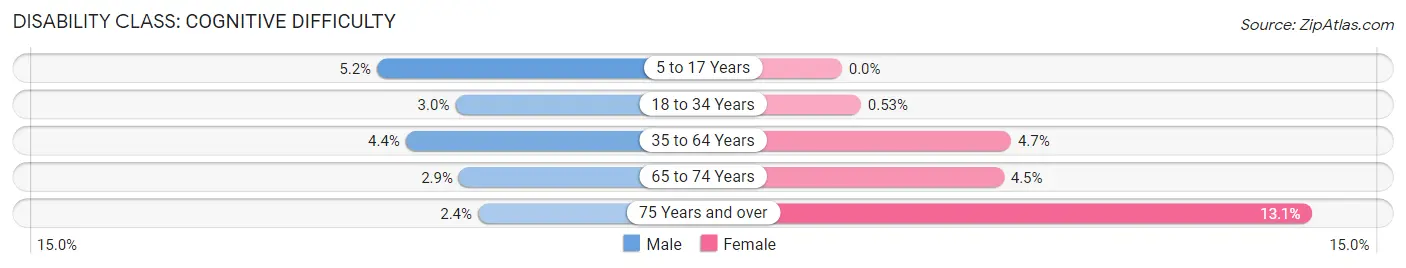
| Age Bracket | Male | Female |
| 5 to 17 Years | 8 (5.2%) | 0 (0.0%) |
| 18 to 34 Years | 4 (3.0%) | 1 (0.5%) |
| 35 to 64 Years | 14 (4.4%) | 13 (4.7%) |
| 65 to 74 Years | 3 (2.9%) | 6 (4.5%) |
| 75 Years and over | 1 (2.4%) | 11 (13.1%) |
Disability Class: Ambulatory Difficulty
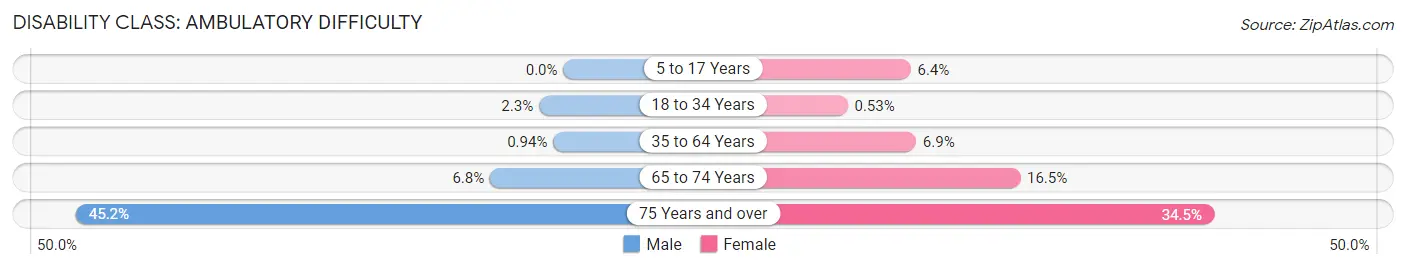
| Age Bracket | Male | Female |
| 5 to 17 Years | 0 (0.0%) | 9 (6.4%) |
| 18 to 34 Years | 3 (2.3%) | 1 (0.5%) |
| 35 to 64 Years | 3 (0.9%) | 19 (6.9%) |
| 65 to 74 Years | 7 (6.8%) | 22 (16.5%) |
| 75 Years and over | 19 (45.2%) | 29 (34.5%) |
Disability Class: Self-Care Difficulty
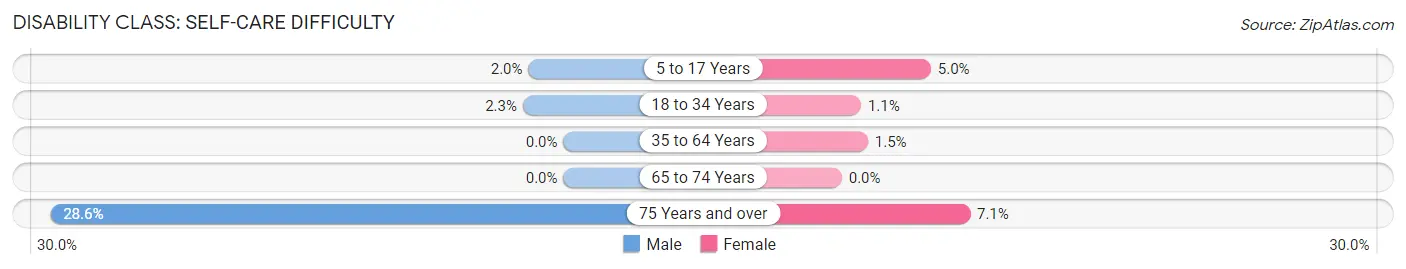
| Age Bracket | Male | Female |
| 5 to 17 Years | 3 (1.9%) | 7 (5.0%) |
| 18 to 34 Years | 3 (2.3%) | 2 (1.1%) |
| 35 to 64 Years | 0 (0.0%) | 4 (1.5%) |
| 65 to 74 Years | 0 (0.0%) | 0 (0.0%) |
| 75 Years and over | 12 (28.6%) | 6 (7.1%) |
Technology Access in Rushford
Computing Device Access in Rushford
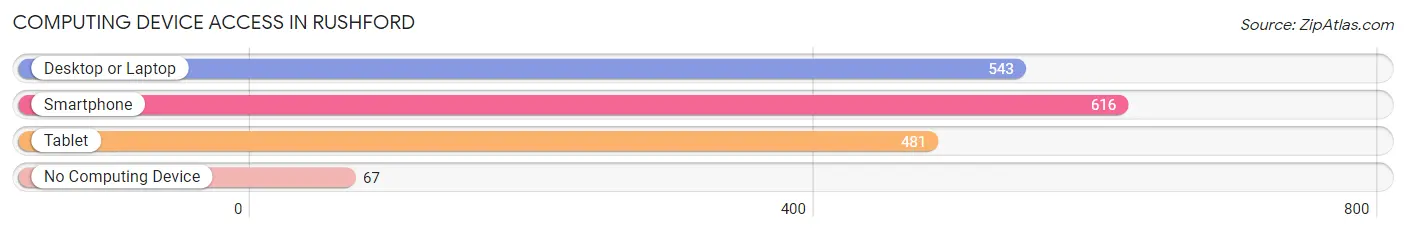
| Device Type | # Households | % Households |
| Desktop or Laptop | 543 | 74.6% |
| Smartphone | 616 | 84.6% |
| Tablet | 481 | 66.1% |
| No Computing Device | 67 | 9.2% |
| Total | 728 | 100.0% |
Internet Access in Rushford
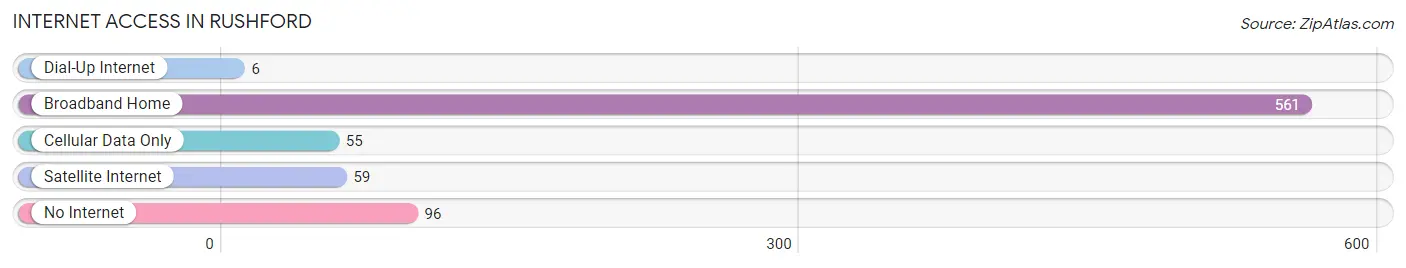
| Internet Type | # Households | % Households |
| Dial-Up Internet | 6 | 0.8% |
| Broadband Home | 561 | 77.1% |
| Cellular Data Only | 55 | 7.5% |
| Satellite Internet | 59 | 8.1% |
| No Internet | 96 | 13.2% |
| Total | 728 | 100.0% |
Rushford Summary
History
Rushford, Minnesota is a small city located in Fillmore County, in the southeastern part of the state. It is situated along the Root River, and is the county seat of Fillmore County. The city was founded in 1854, and was named after the nearby Rushford Creek. The city was originally a trading post, and was later incorporated in 1858.
The city of Rushford has a long and interesting history. In the late 1800s, the city was a major hub for the lumber industry, and was home to several sawmills. The city was also home to a number of other businesses, including a flour mill, a creamery, and a brickyard.
In the early 1900s, the city experienced a period of growth and prosperity. The city was home to several banks, a hospital, and a number of other businesses. The city was also home to a number of churches, and was a popular destination for tourists.
In the mid-1900s, the city experienced a period of decline. The lumber industry had declined, and the city was no longer a major hub for business. The city was also hit hard by the Great Depression, and many of the businesses in the city closed.
In the late 1900s, the city experienced a period of revitalization. The city was home to a number of new businesses, and the city was once again a popular destination for tourists. The city was also home to a number of festivals and events, and was a popular destination for outdoor recreation.
Geography
Rushford is located in southeastern Minnesota, in Fillmore County. The city is situated along the Root River, and is surrounded by rolling hills and farmland. The city is located approximately 50 miles south of Rochester, and is about a two-hour drive from the Twin Cities.
The city of Rushford has a total area of 1.7 square miles, all of which is land. The city is located at an elevation of 1,068 feet above sea level. The climate in Rushford is classified as humid continental, with cold winters and warm summers.
Economy
The economy of Rushford is largely based on agriculture and tourism. The city is home to a number of farms, and is a popular destination for outdoor recreation. The city is also home to a number of businesses, including a number of restaurants, retail stores, and service providers.
The city is also home to a number of manufacturing businesses, including a number of food processing plants. The city is also home to a number of healthcare providers, including a hospital and a number of clinics.
Demographics
As of the 2010 census, the city of Rushford had a population of 1,717. The population is largely white, with a small percentage of African Americans, Hispanics, and Asians. The median household income in the city is $41,944, and the median age is 43.
The city of Rushford is served by the Rushford-Peterson School District. The district is home to two elementary schools, one middle school, and one high school. The city is also home to a number of private schools, including a number of religious schools.
Common Questions
What is Per Capita Income in Rushford?
Per Capita income in Rushford is $32,936.
What is the Median Family Income in Rushford?
Median Family Income in Rushford is $104,028.
What is the Median Household income in Rushford?
Median Household Income in Rushford is $70,543.
What is Income or Wage Gap in Rushford?
Income or Wage Gap in Rushford is 20.7%.
Women in Rushford earn 79.3 cents for every dollar earned by a man.
What is Family Income Deficit in Rushford?
Family Income Deficit in Rushford is $16,317.
Families that are below poverty line in Rushford earn $16,317 less on average than the poverty threshold level.
What is Inequality or Gini Index in Rushford?
Inequality or Gini Index in Rushford is 0.37.
What is the Total Population of Rushford?
Total Population of Rushford is 1,816.
What is the Total Male Population of Rushford?
Total Male Population of Rushford is 861.
What is the Total Female Population of Rushford?
Total Female Population of Rushford is 955.
What is the Ratio of Males per 100 Females in Rushford?
There are 90.16 Males per 100 Females in Rushford.
What is the Ratio of Females per 100 Males in Rushford?
There are 110.92 Females per 100 Males in Rushford.
What is the Median Population Age in Rushford?
Median Population Age in Rushford is 41.8 Years.
What is the Average Family Size in Rushford
Average Family Size in Rushford is 2.9 People.
What is the Average Household Size in Rushford
Average Household Size in Rushford is 2.4 People.
How Large is the Labor Force in Rushford?
There are 909 People in the Labor Forcein in Rushford.
What is the Percentage of People in the Labor Force in Rushford?
65.1% of People are in the Labor Force in Rushford.
What is the Unemployment Rate in Rushford?
Unemployment Rate in Rushford is 3.6%.