Chisago City, MN Map & Demographics
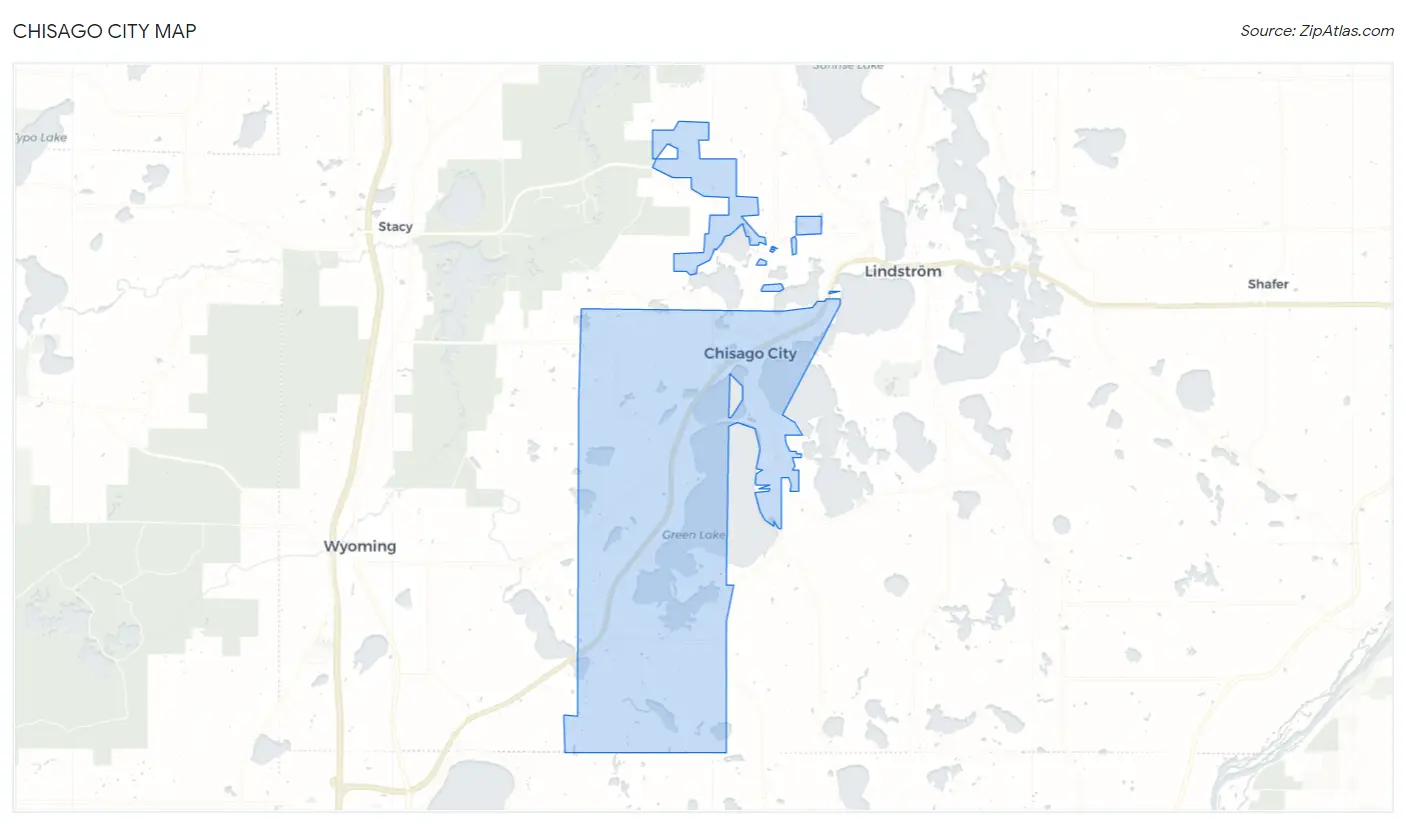
Chisago City Map
Chisago City Overview
$42,356
PER CAPITA INCOME
$111,117
AVG FAMILY INCOME
$92,278
AVG HOUSEHOLD INCOME
20.9%
WAGE / INCOME GAP [ % ]
79.1¢/ $1
WAGE / INCOME GAP [ $ ]
0.40
INEQUALITY / GINI INDEX
5,576
TOTAL POPULATION
2,784
MALE POPULATION
2,792
FEMALE POPULATION
99.71
MALES / 100 FEMALES
100.29
FEMALES / 100 MALES
40.7
MEDIAN AGE
3.0
AVG FAMILY SIZE
2.5
AVG HOUSEHOLD SIZE
2,745
LABOR FORCE [ PEOPLE ]
61.8%
PERCENT IN LABOR FORCE
4.0%
UNEMPLOYMENT RATE
Chisago City Zip Codes
Income in Chisago City
Income Overview in Chisago City
Per Capita Income in Chisago City is $42,356, while median incomes of families and households are $111,117 and $92,278 respectively.
| Characteristic | Number | Measure |
| Per Capita Income | 5,576 | $42,356 |
| Median Family Income | 1,540 | $111,117 |
| Mean Family Income | 1,540 | $128,366 |
| Median Household Income | 2,152 | $92,278 |
| Mean Household Income | 2,152 | $107,196 |
| Income Deficit | 1,540 | $0 |
| Wage / Income Gap (%) | 5,576 | 20.86% |
| Wage / Income Gap ($) | 5,576 | 79.14¢ per $1 |
| Gini / Inequality Index | 5,576 | 0.40 |
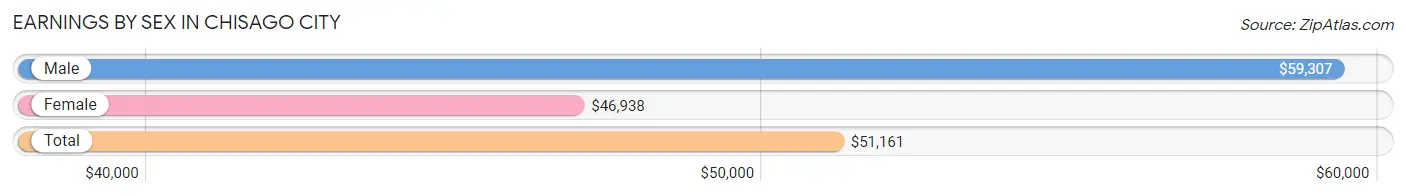
Earnings by Sex in Chisago City
Average Earnings in Chisago City are $51,161, $59,307 for men and $46,938 for women, a difference of 20.9%.
| Sex | Number | Average Earnings |
| Male | 1,612 (55.7%) | $59,307 |
| Female | 1,280 (44.3%) | $46,938 |
| Total | 2,892 (100.0%) | $51,161 |
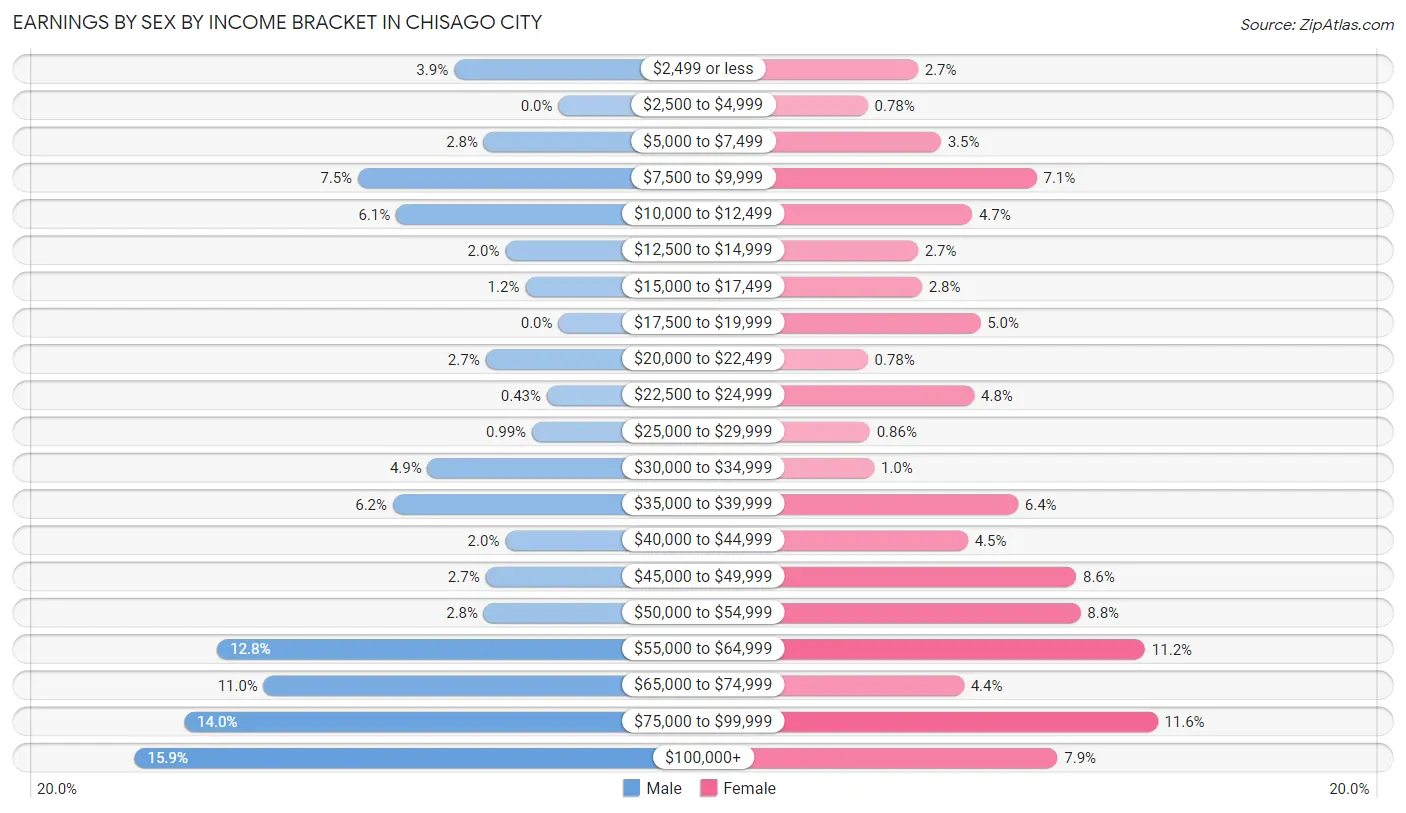
Earnings by Sex by Income Bracket in Chisago City
The most common earnings brackets in Chisago City are $100,000+ for men (256 | 15.9%) and $75,000 to $99,999 for women (149 | 11.6%).
| Income | Male | Female |
| $2,499 or less | 63 (3.9%) | 34 (2.7%) |
| $2,500 to $4,999 | 0 (0.0%) | 10 (0.8%) |
| $5,000 to $7,499 | 45 (2.8%) | 45 (3.5%) |
| $7,500 to $9,999 | 121 (7.5%) | 91 (7.1%) |
| $10,000 to $12,499 | 98 (6.1%) | 60 (4.7%) |
| $12,500 to $14,999 | 32 (2.0%) | 34 (2.7%) |
| $15,000 to $17,499 | 20 (1.2%) | 36 (2.8%) |
| $17,500 to $19,999 | 0 (0.0%) | 64 (5.0%) |
| $20,000 to $22,499 | 44 (2.7%) | 10 (0.8%) |
| $22,500 to $24,999 | 7 (0.4%) | 61 (4.8%) |
| $25,000 to $29,999 | 16 (1.0%) | 11 (0.9%) |
| $30,000 to $34,999 | 79 (4.9%) | 13 (1.0%) |
| $35,000 to $39,999 | 100 (6.2%) | 82 (6.4%) |
| $40,000 to $44,999 | 32 (2.0%) | 58 (4.5%) |
| $45,000 to $49,999 | 44 (2.7%) | 110 (8.6%) |
| $50,000 to $54,999 | 45 (2.8%) | 112 (8.7%) |
| $55,000 to $64,999 | 206 (12.8%) | 143 (11.2%) |
| $65,000 to $74,999 | 178 (11.0%) | 56 (4.4%) |
| $75,000 to $99,999 | 226 (14.0%) | 149 (11.6%) |
| $100,000+ | 256 (15.9%) | 101 (7.9%) |
| Total | 1,612 (100.0%) | 1,280 (100.0%) |
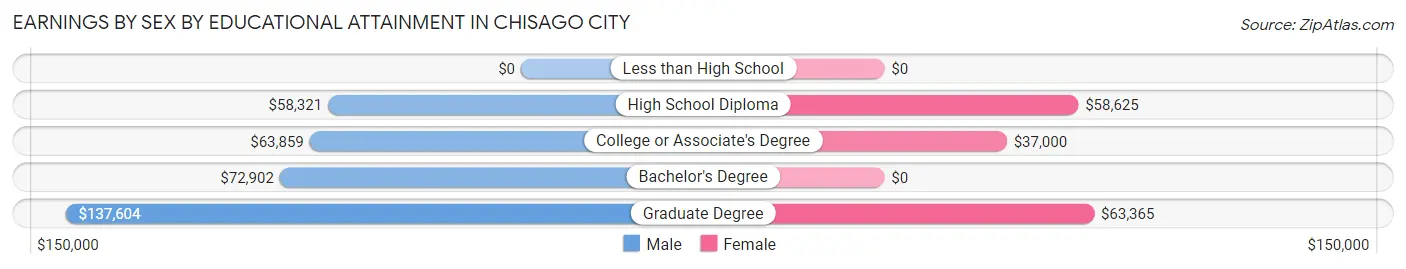
Earnings by Sex by Educational Attainment in Chisago City
Average earnings in Chisago City are $64,565 for men and $47,554 for women, a difference of 26.4%. Men with an educational attainment of graduate degree enjoy the highest average annual earnings of $137,604, while those with high school diploma education earn the least with $58,321. Women with an educational attainment of graduate degree earn the most with the average annual earnings of $63,365, while those with college or associate's degree education have the smallest earnings of $37,000.
| Educational Attainment | Male Income | Female Income |
| Less than High School | - | - |
| High School Diploma | $58,321 | $58,625 |
| College or Associate's Degree | $63,859 | $37,000 |
| Bachelor's Degree | $72,902 | $0 |
| Graduate Degree | $137,604 | $63,365 |
| Total | $64,565 | $47,554 |
Family Income in Chisago City
Family Income Brackets in Chisago City
According to the Chisago City family income data, there are 470 families falling into the $100,000 to $149,999 income range, which is the most common income bracket and makes up 30.5% of all families.
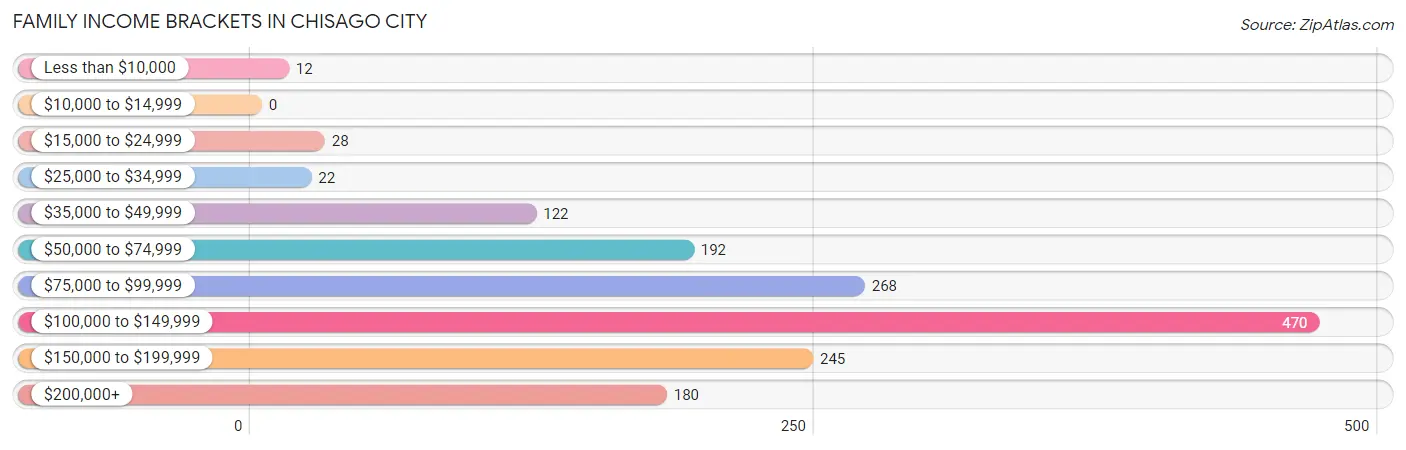
| Income Bracket | # Families | % Families |
| Less than $10,000 | 12 | 0.8% |
| $10,000 to $14,999 | 0 | 0.0% |
| $15,000 to $24,999 | 28 | 1.8% |
| $25,000 to $34,999 | 22 | 1.4% |
| $35,000 to $49,999 | 122 | 7.9% |
| $50,000 to $74,999 | 192 | 12.5% |
| $75,000 to $99,999 | 268 | 17.4% |
| $100,000 to $149,999 | 470 | 30.5% |
| $150,000 to $199,999 | 245 | 15.9% |
| $200,000+ | 180 | 11.7% |
Family Income by Famaliy Size in Chisago City
5-person families (92 | 6.0%) account for the highest median family income in Chisago City with $185,833 per family, while 2-person families (770 | 50.0%) have the highest median income of $46,827 per family member.
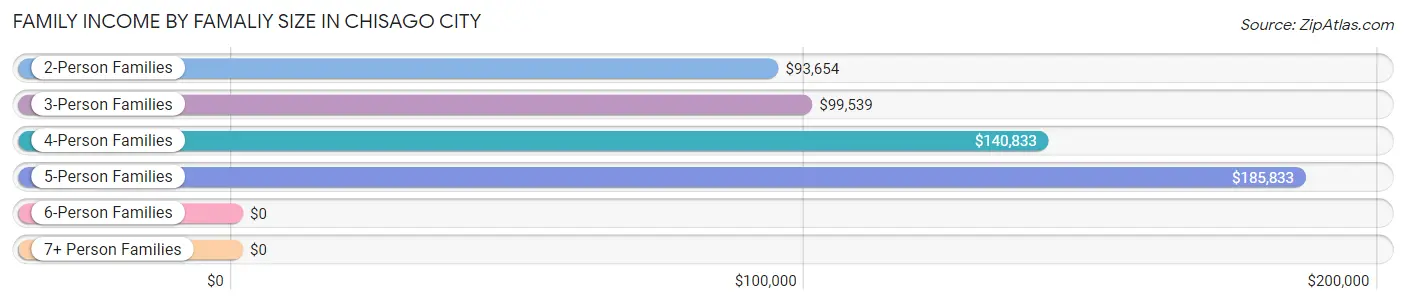
| Income Bracket | # Families | Median Income |
| 2-Person Families | 770 (50.0%) | $93,654 |
| 3-Person Families | 273 (17.7%) | $99,539 |
| 4-Person Families | 334 (21.7%) | $140,833 |
| 5-Person Families | 92 (6.0%) | $185,833 |
| 6-Person Families | 71 (4.6%) | $0 |
| 7+ Person Families | 0 (0.0%) | $0 |
| Total | 1,540 (100.0%) | $111,117 |
Family Income by Number of Earners in Chisago City
The median family income in Chisago City is $111,117, with families comprising 3+ earners (218) having the highest median family income of $150,833, while families with no earners (270) have the lowest median family income of $65,156, accounting for 14.2% and 17.5% of families, respectively.
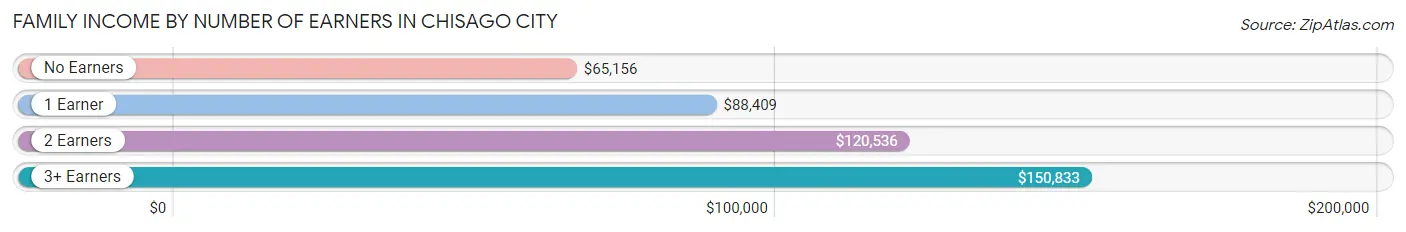
| Number of Earners | # Families | Median Income |
| No Earners | 270 (17.5%) | $65,156 |
| 1 Earner | 368 (23.9%) | $88,409 |
| 2 Earners | 684 (44.4%) | $120,536 |
| 3+ Earners | 218 (14.2%) | $150,833 |
| Total | 1,540 (100.0%) | $111,117 |
Household Income in Chisago City
Household Income Brackets in Chisago City
With 547 households falling in the category, the $100,000 to $149,999 income range is the most frequent in Chisago City, accounting for 25.4% of all households. In contrast, only 19 households (0.9%) fall into the $10,000 to $14,999 income bracket, making it the least populous group.
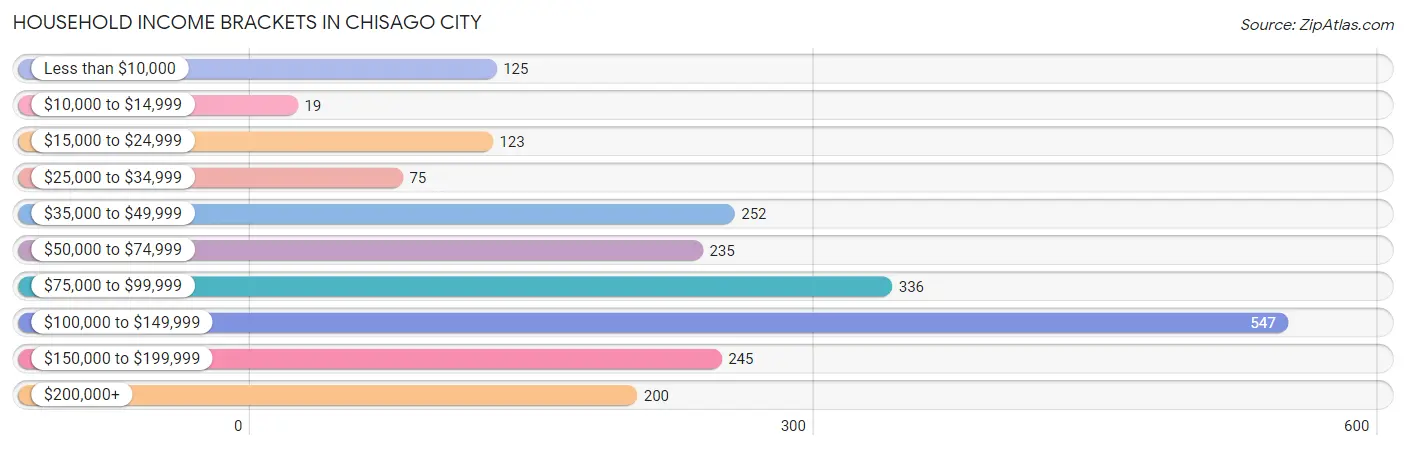
| Income Bracket | # Households | % Households |
| Less than $10,000 | 125 | 5.8% |
| $10,000 to $14,999 | 19 | 0.9% |
| $15,000 to $24,999 | 123 | 5.7% |
| $25,000 to $34,999 | 75 | 3.5% |
| $35,000 to $49,999 | 252 | 11.7% |
| $50,000 to $74,999 | 235 | 10.9% |
| $75,000 to $99,999 | 336 | 15.6% |
| $100,000 to $149,999 | 547 | 25.4% |
| $150,000 to $199,999 | 245 | 11.4% |
| $200,000+ | 200 | 9.3% |
Household Income by Householder Age in Chisago City
The median household income in Chisago City is $92,278, with the highest median household income of $149,464 found in the 45 to 64 years age bracket for the primary householder. A total of 483 households (22.4%) fall into this category. Meanwhile, the 65+ years age bracket for the primary householder has the lowest median household income of $57,885, with 830 households (38.6%) in this group.
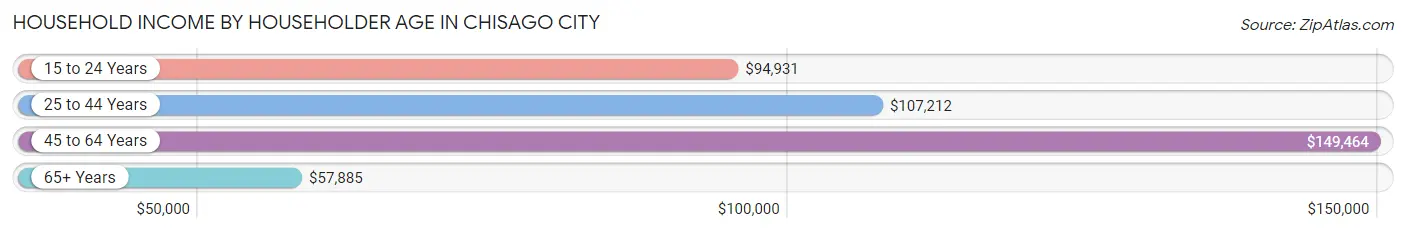
| Income Bracket | # Households | Median Income |
| 15 to 24 Years | 91 (4.2%) | $94,931 |
| 25 to 44 Years | 748 (34.8%) | $107,212 |
| 45 to 64 Years | 483 (22.4%) | $149,464 |
| 65+ Years | 830 (38.6%) | $57,885 |
| Total | 2,152 (100.0%) | $92,278 |
Poverty in Chisago City
Income Below Poverty by Sex and Age in Chisago City
With 3.7% poverty level for males and 5.4% for females among the residents of Chisago City, 75 year old and over males and 15 year old females are the most vulnerable to poverty, with 45 males (19.2%) and 13 females (100.0%) in their respective age groups living below the poverty level.
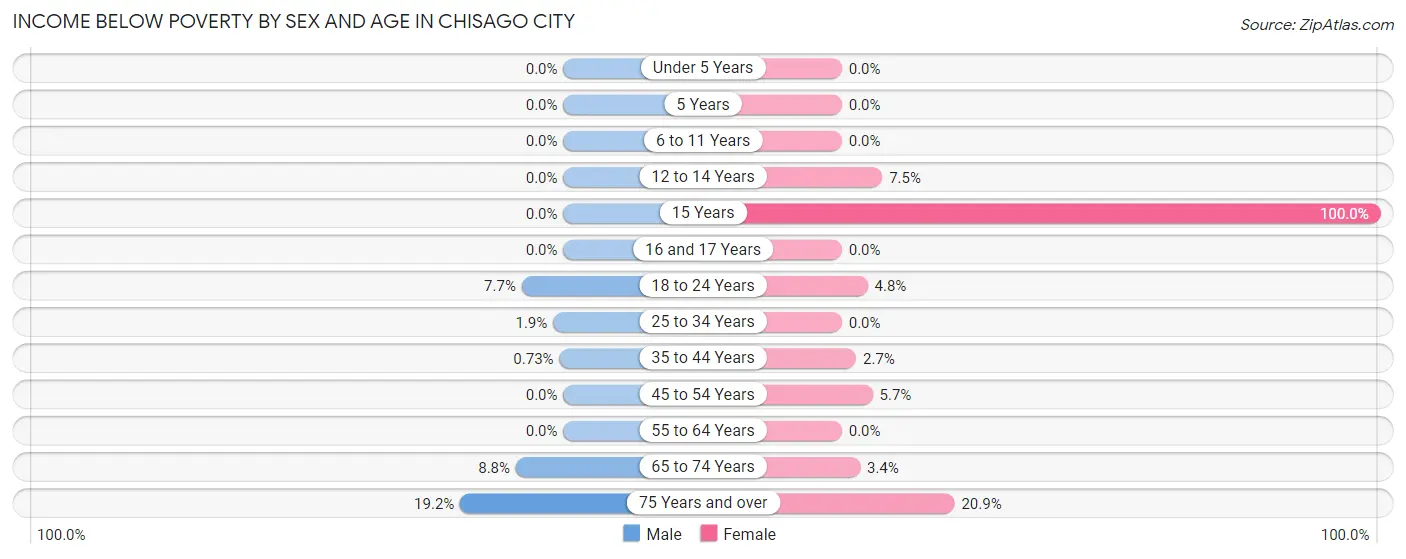
| Age Bracket | Male | Female |
| Under 5 Years | 0 (0.0%) | 0 (0.0%) |
| 5 Years | 0 (0.0%) | 0 (0.0%) |
| 6 to 11 Years | 0 (0.0%) | 0 (0.0%) |
| 12 to 14 Years | 0 (0.0%) | 12 (7.5%) |
| 15 Years | 0 (0.0%) | 13 (100.0%) |
| 16 and 17 Years | 0 (0.0%) | 0 (0.0%) |
| 18 to 24 Years | 21 (7.7%) | 9 (4.8%) |
| 25 to 34 Years | 5 (1.9%) | 0 (0.0%) |
| 35 to 44 Years | 3 (0.7%) | 9 (2.6%) |
| 45 to 54 Years | 0 (0.0%) | 14 (5.7%) |
| 55 to 64 Years | 0 (0.0%) | 0 (0.0%) |
| 65 to 74 Years | 26 (8.8%) | 13 (3.4%) |
| 75 Years and over | 45 (19.2%) | 73 (20.9%) |
| Total | 100 (3.7%) | 143 (5.4%) |
Income Above Poverty by Sex and Age in Chisago City
According to the poverty statistics in Chisago City, males aged under 5 years and females aged under 5 years are the age groups that are most secure financially, with 100.0% of males and 100.0% of females in these age groups living above the poverty line.
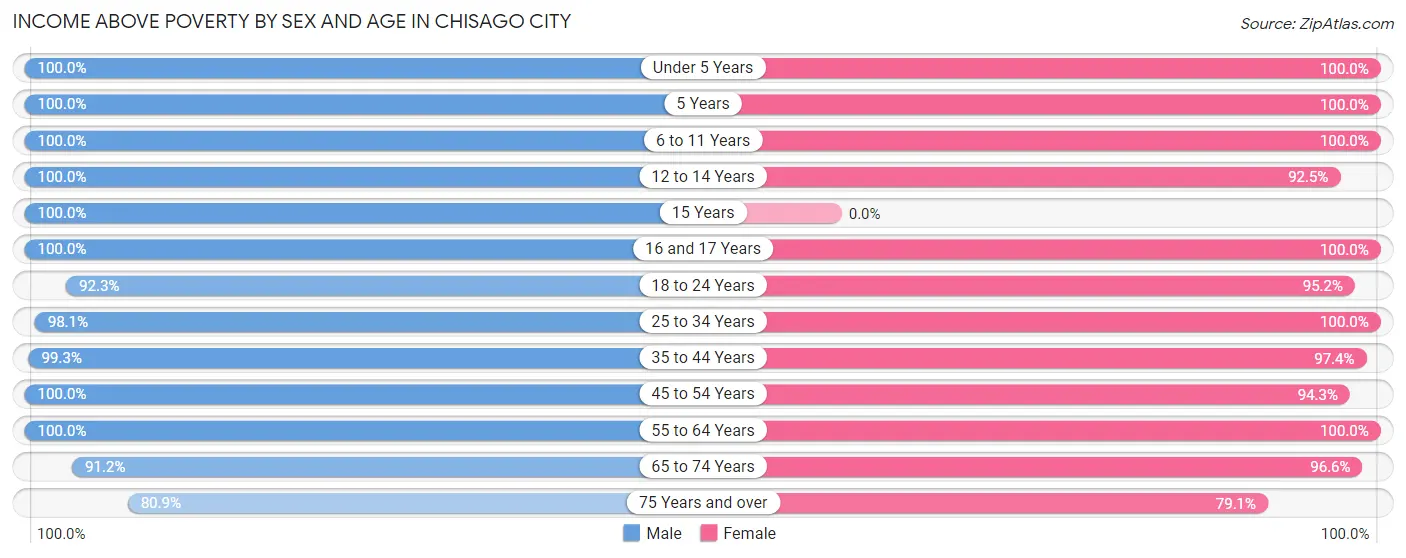
| Age Bracket | Male | Female |
| Under 5 Years | 163 (100.0%) | 246 (100.0%) |
| 5 Years | 41 (100.0%) | 22 (100.0%) |
| 6 to 11 Years | 242 (100.0%) | 90 (100.0%) |
| 12 to 14 Years | 85 (100.0%) | 148 (92.5%) |
| 15 Years | 48 (100.0%) | 0 (0.0%) |
| 16 and 17 Years | 126 (100.0%) | 37 (100.0%) |
| 18 to 24 Years | 251 (92.3%) | 179 (95.2%) |
| 25 to 34 Years | 258 (98.1%) | 310 (100.0%) |
| 35 to 44 Years | 408 (99.3%) | 330 (97.4%) |
| 45 to 54 Years | 342 (100.0%) | 231 (94.3%) |
| 55 to 64 Years | 200 (100.0%) | 262 (100.0%) |
| 65 to 74 Years | 269 (91.2%) | 372 (96.6%) |
| 75 Years and over | 190 (80.8%) | 276 (79.1%) |
| Total | 2,623 (96.3%) | 2,503 (94.6%) |
Income Below Poverty Among Married-Couple Families in Chisago City
The poverty statistics for married-couple families in Chisago City show that 1.0% or 13 of the total 1,360 families live below the poverty line. Families with no children have the highest poverty rate of 1.7%, comprising of 13 families. On the other hand, families with 1 or 2 children have the lowest poverty rate of 0.0%, which includes 0 families.
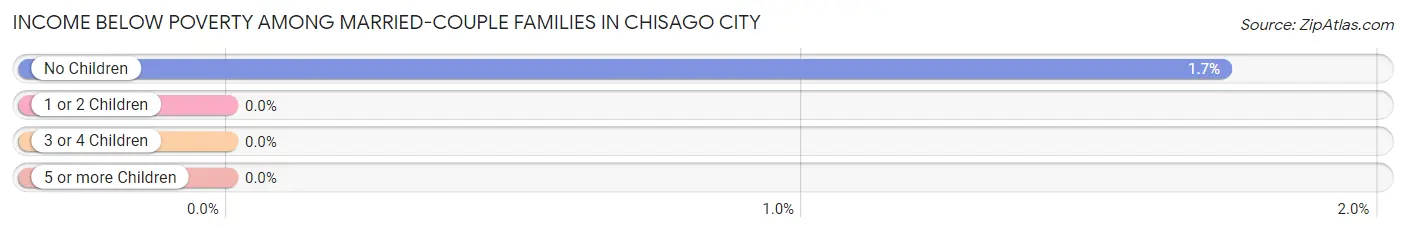
| Children | Above Poverty | Below Poverty |
| No Children | 739 (98.3%) | 13 (1.7%) |
| 1 or 2 Children | 514 (100.0%) | 0 (0.0%) |
| 3 or 4 Children | 94 (100.0%) | 0 (0.0%) |
| 5 or more Children | 0 (0.0%) | 0 (0.0%) |
| Total | 1,347 (99.0%) | 13 (1.0%) |
Income Below Poverty Among Single-Parent Households in Chisago City
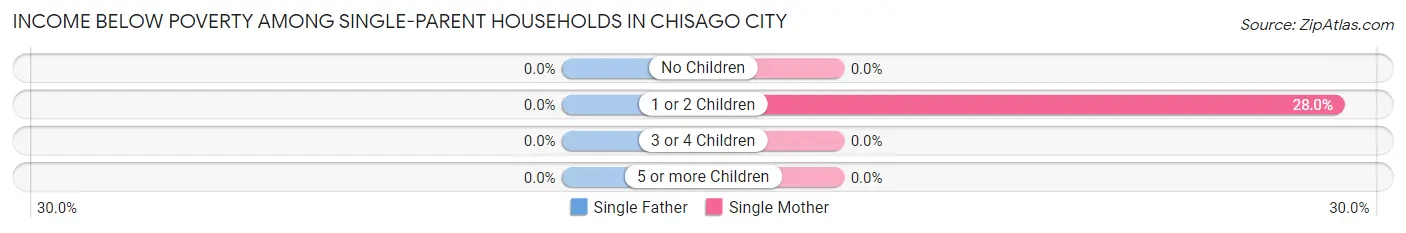
| Children | Single Father | Single Mother |
| No Children | 0 (0.0%) | 0 (0.0%) |
| 1 or 2 Children | 0 (0.0%) | 14 (28.0%) |
| 3 or 4 Children | 0 (0.0%) | 0 (0.0%) |
| 5 or more Children | 0 (0.0%) | 0 (0.0%) |
| Total | 0 (0.0%) | 14 (12.8%) |
Income Below Poverty Among Married-Couple vs Single-Parent Households in Chisago City
The poverty data for Chisago City shows that 13 of the married-couple family households (1.0%) and 14 of the single-parent households (7.8%) are living below the poverty level. Within the married-couple family households, those with no children have the highest poverty rate, with 13 households (1.7%) falling below the poverty line. Among the single-parent households, those with 1 or 2 children have the highest poverty rate, with 14 household (14.7%) living below poverty.
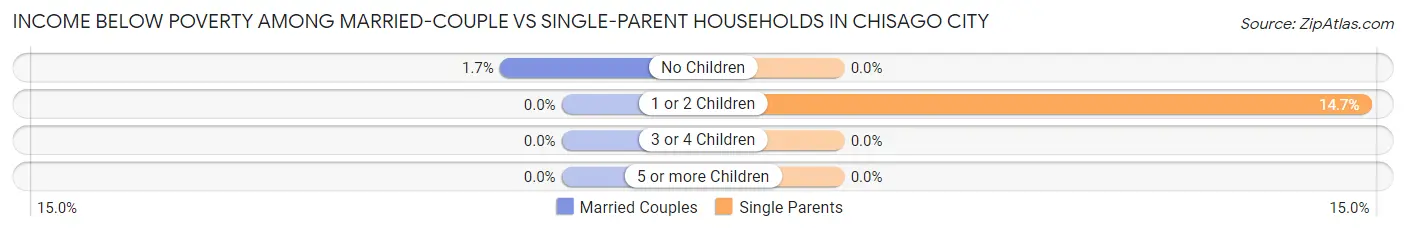
| Children | Married-Couple Families | Single-Parent Households |
| No Children | 13 (1.7%) | 0 (0.0%) |
| 1 or 2 Children | 0 (0.0%) | 14 (14.7%) |
| 3 or 4 Children | 0 (0.0%) | 0 (0.0%) |
| 5 or more Children | 0 (0.0%) | 0 (0.0%) |
| Total | 13 (1.0%) | 14 (7.8%) |
Race in Chisago City
The most populous races in Chisago City are White / Caucasian (5,040 | 90.4%), Two or more Races (441 | 7.9%), and Hispanic or Latino (174 | 3.1%).
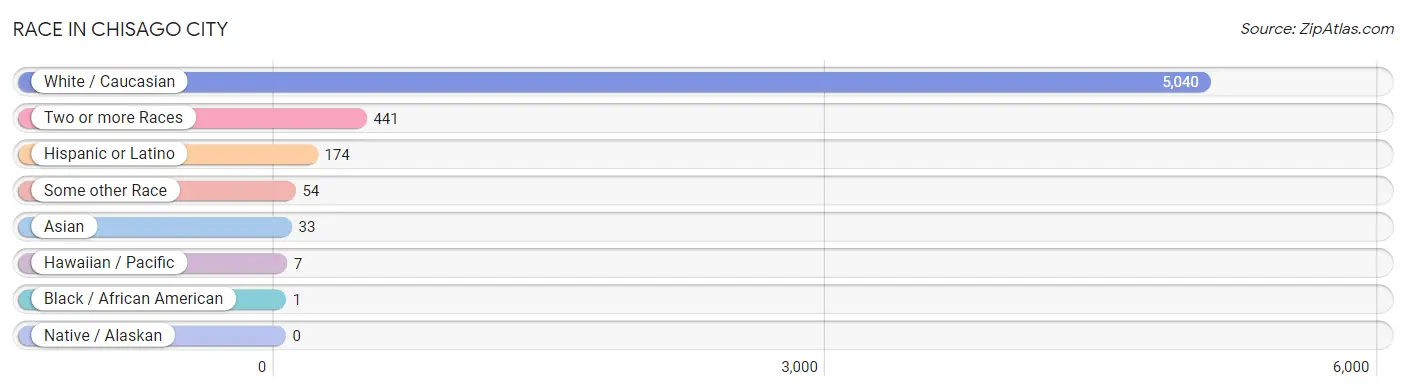
| Race | # Population | % Population |
| Asian | 33 | 0.6% |
| Black / African American | 1 | 0.0% |
| Hawaiian / Pacific | 7 | 0.1% |
| Hispanic or Latino | 174 | 3.1% |
| Native / Alaskan | 0 | 0.0% |
| White / Caucasian | 5,040 | 90.4% |
| Two or more Races | 441 | 7.9% |
| Some other Race | 54 | 1.0% |
| Total | 5,576 | 100.0% |
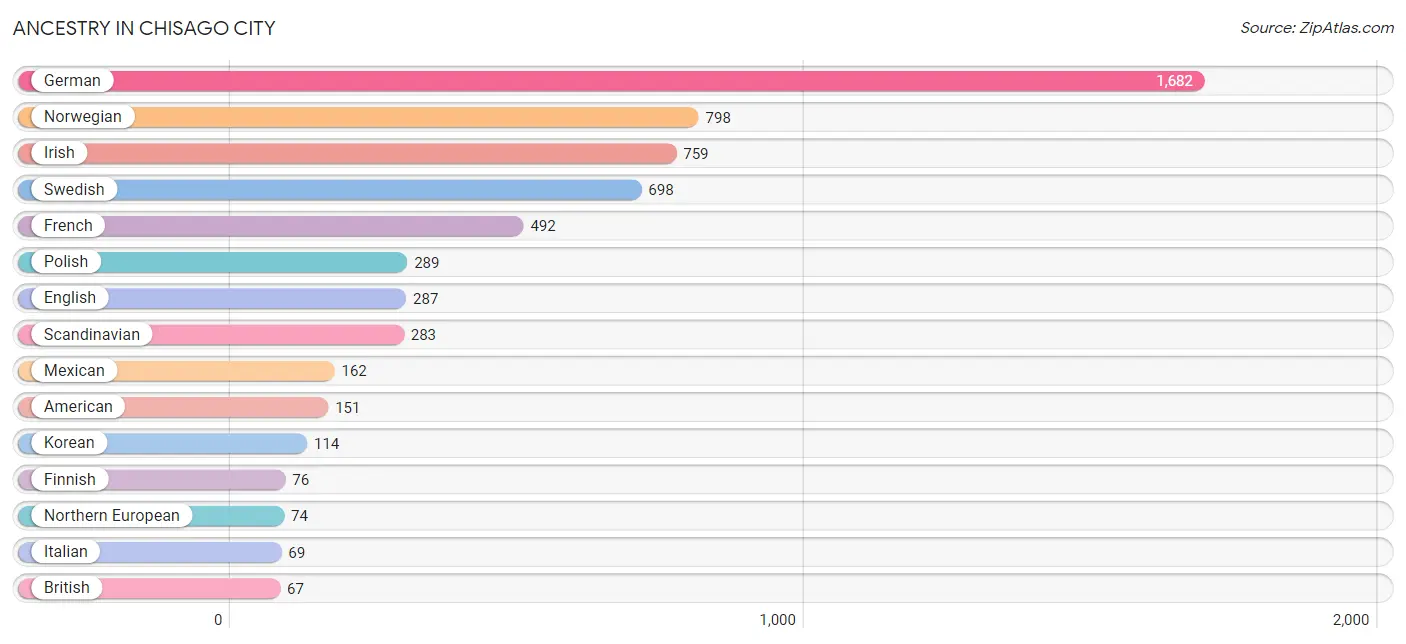
Ancestry in Chisago City
The most populous ancestries reported in Chisago City are German (1,682 | 30.2%), Norwegian (798 | 14.3%), Irish (759 | 13.6%), Swedish (698 | 12.5%), and French (492 | 8.8%), together accounting for 79.4% of all Chisago City residents.
| Ancestry | # Population | % Population |
| Aleut | 14 | 0.3% |
| American | 151 | 2.7% |
| Arab | 28 | 0.5% |
| Austrian | 42 | 0.7% |
| Brazilian | 5 | 0.1% |
| British | 67 | 1.2% |
| Chippewa | 29 | 0.5% |
| Czech | 65 | 1.2% |
| Danish | 37 | 0.7% |
| Dutch | 19 | 0.3% |
| Eastern European | 15 | 0.3% |
| English | 287 | 5.1% |
| European | 67 | 1.2% |
| Finnish | 76 | 1.4% |
| French | 492 | 8.8% |
| French Canadian | 15 | 0.3% |
| German | 1,682 | 30.2% |
| Hungarian | 41 | 0.7% |
| Icelander | 21 | 0.4% |
| Irish | 759 | 13.6% |
| Italian | 69 | 1.2% |
| Korean | 114 | 2.0% |
| Lebanese | 28 | 0.5% |
| Mexican | 162 | 2.9% |
| Native Hawaiian | 7 | 0.1% |
| Northern European | 74 | 1.3% |
| Norwegian | 798 | 14.3% |
| Polish | 289 | 5.2% |
| Portuguese | 15 | 0.3% |
| Russian | 16 | 0.3% |
| Scandinavian | 283 | 5.1% |
| Scotch-Irish | 21 | 0.4% |
| Scottish | 11 | 0.2% |
| Swedish | 698 | 12.5% |
| Swiss | 39 | 0.7% |
| Ukrainian | 8 | 0.1% |
| Welsh | 13 | 0.2% |
| Yugoslavian | 17 | 0.3% | View All 38 Rows |
Immigrants in Chisago City
The most numerous immigrant groups reported in Chisago City came from Latin America (45 | 0.8%), Asia (33 | 0.6%), Philippines (33 | 0.6%), South Eastern Asia (33 | 0.6%), and Central America (25 | 0.4%), together accounting for 3.0% of all Chisago City residents.
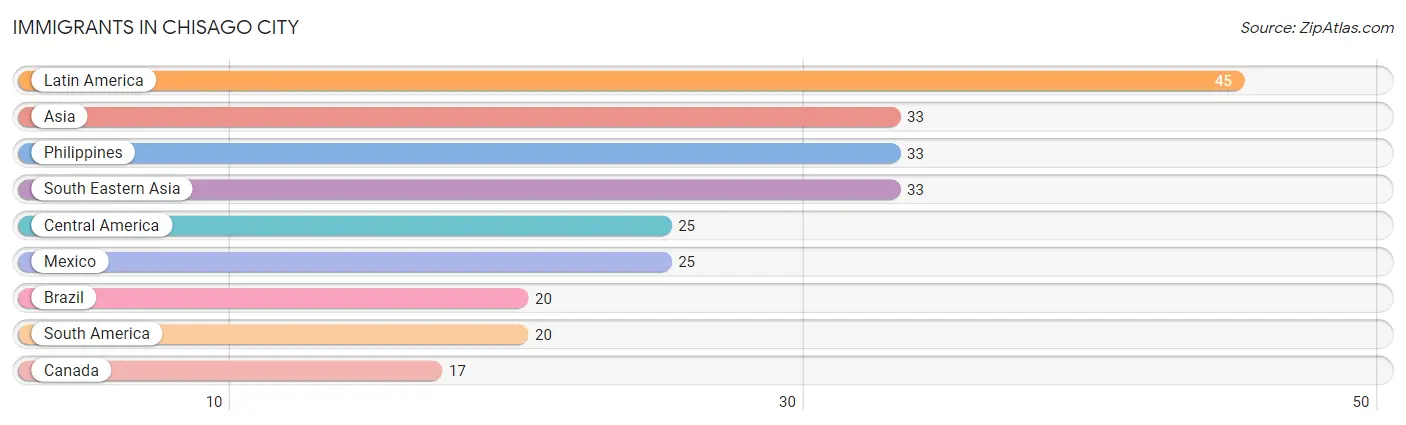
| Immigration Origin | # Population | % Population |
| Asia | 33 | 0.6% |
| Brazil | 20 | 0.4% |
| Canada | 17 | 0.3% |
| Central America | 25 | 0.4% |
| Latin America | 45 | 0.8% |
| Mexico | 25 | 0.4% |
| Philippines | 33 | 0.6% |
| South America | 20 | 0.4% |
| South Eastern Asia | 33 | 0.6% | View All 9 Rows |
Sex and Age in Chisago City
Sex and Age in Chisago City
The most populous age groups in Chisago City are 15 to 19 Years (243 | 8.7%) for men and Under 5 Years (265 | 9.5%) for women.
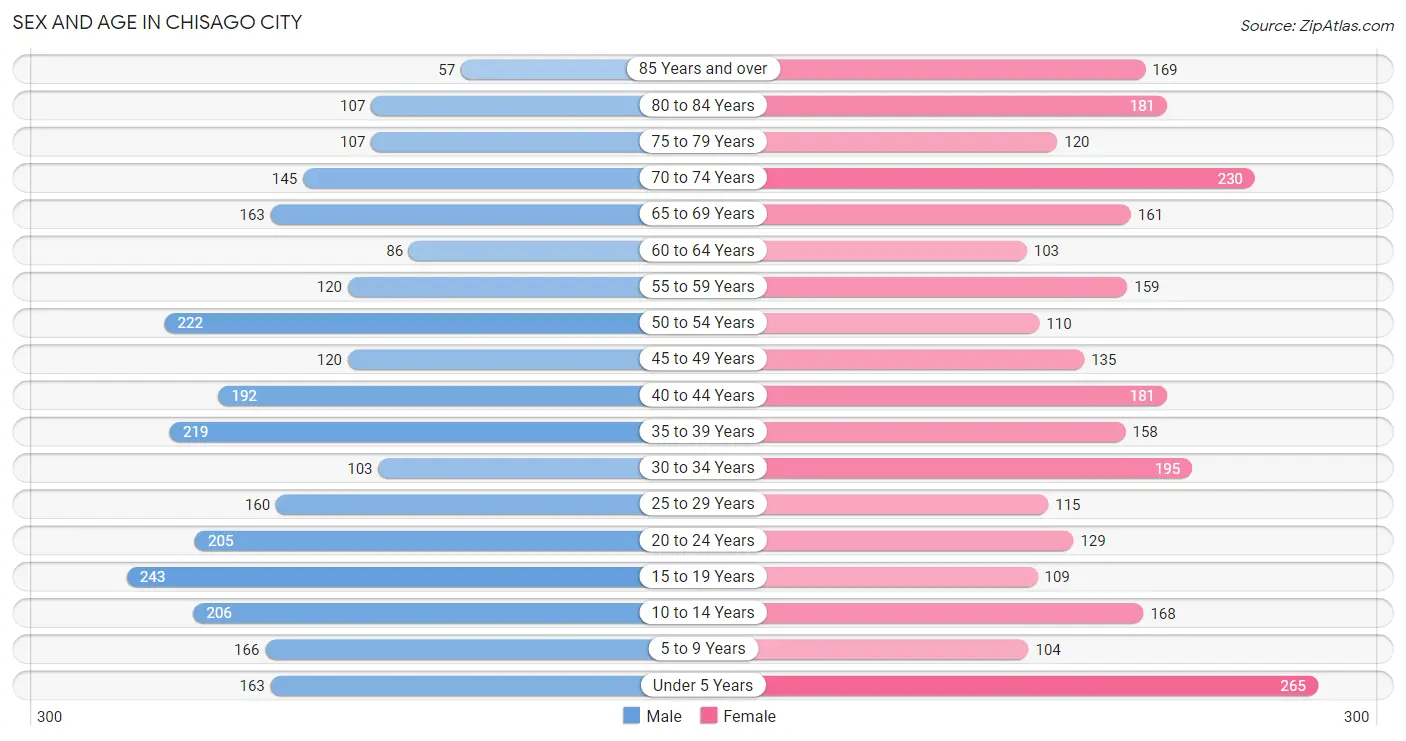
| Age Bracket | Male | Female |
| Under 5 Years | 163 (5.9%) | 265 (9.5%) |
| 5 to 9 Years | 166 (6.0%) | 104 (3.7%) |
| 10 to 14 Years | 206 (7.4%) | 168 (6.0%) |
| 15 to 19 Years | 243 (8.7%) | 109 (3.9%) |
| 20 to 24 Years | 205 (7.4%) | 129 (4.6%) |
| 25 to 29 Years | 160 (5.8%) | 115 (4.1%) |
| 30 to 34 Years | 103 (3.7%) | 195 (7.0%) |
| 35 to 39 Years | 219 (7.9%) | 158 (5.7%) |
| 40 to 44 Years | 192 (6.9%) | 181 (6.5%) |
| 45 to 49 Years | 120 (4.3%) | 135 (4.8%) |
| 50 to 54 Years | 222 (8.0%) | 110 (3.9%) |
| 55 to 59 Years | 120 (4.3%) | 159 (5.7%) |
| 60 to 64 Years | 86 (3.1%) | 103 (3.7%) |
| 65 to 69 Years | 163 (5.9%) | 161 (5.8%) |
| 70 to 74 Years | 145 (5.2%) | 230 (8.2%) |
| 75 to 79 Years | 107 (3.8%) | 120 (4.3%) |
| 80 to 84 Years | 107 (3.8%) | 181 (6.5%) |
| 85 Years and over | 57 (2.1%) | 169 (6.0%) |
| Total | 2,784 (100.0%) | 2,792 (100.0%) |
Families and Households in Chisago City
Median Family Size in Chisago City
The median family size in Chisago City is 3.00 persons per family, with married-couple families (1,360 | 88.3%) accounting for the largest median family size of 3.08 persons per family. On the other hand, single female/mother families (109 | 7.1%) represent the smallest median family size with 2.24 persons per family.
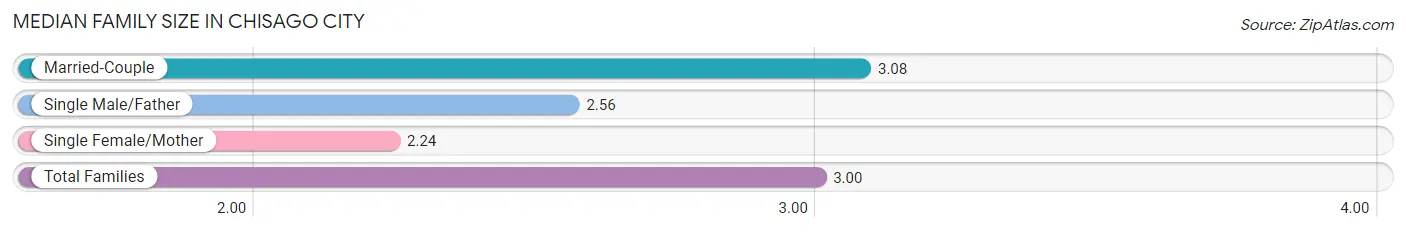
| Family Type | # Families | Family Size |
| Married-Couple | 1,360 (88.3%) | 3.08 |
| Single Male/Father | 71 (4.6%) | 2.56 |
| Single Female/Mother | 109 (7.1%) | 2.24 |
| Total Families | 1,540 (100.0%) | 3.00 |
Median Household Size in Chisago City
The median household size in Chisago City is 2.49 persons per household, with single male/father households (71 | 3.3%) accounting for the largest median household size of 3.28 persons per household. non-family households (612 | 28.4%) represent the smallest median household size with 1.03 persons per household.
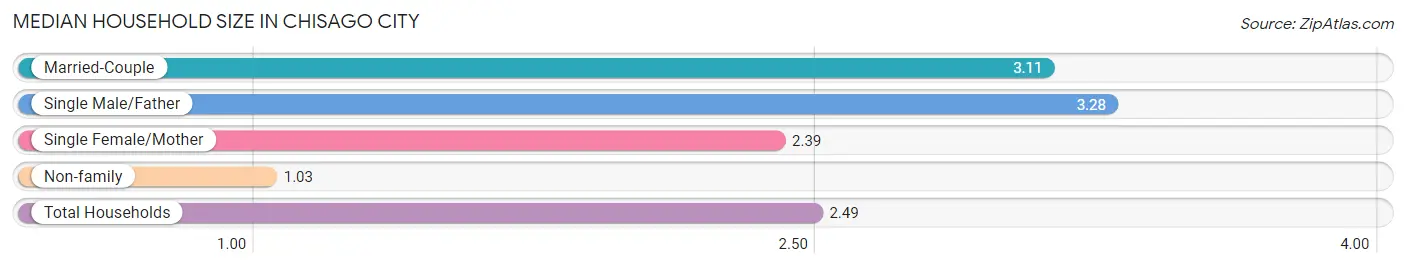
| Household Type | # Households | Household Size |
| Married-Couple | 1,360 (63.2%) | 3.11 |
| Single Male/Father | 71 (3.3%) | 3.28 |
| Single Female/Mother | 109 (5.1%) | 2.39 |
| Non-family | 612 (28.4%) | 1.03 |
| Total Households | 2,152 (100.0%) | 2.49 |
Household Size by Marriage Status in Chisago City
Out of a total of 2,152 households in Chisago City, 1,540 (71.6%) are family households, while 612 (28.4%) are nonfamily households. The most numerous type of family households are 2-person households, comprising 714, and the most common type of nonfamily households are 1-person households, comprising 587.
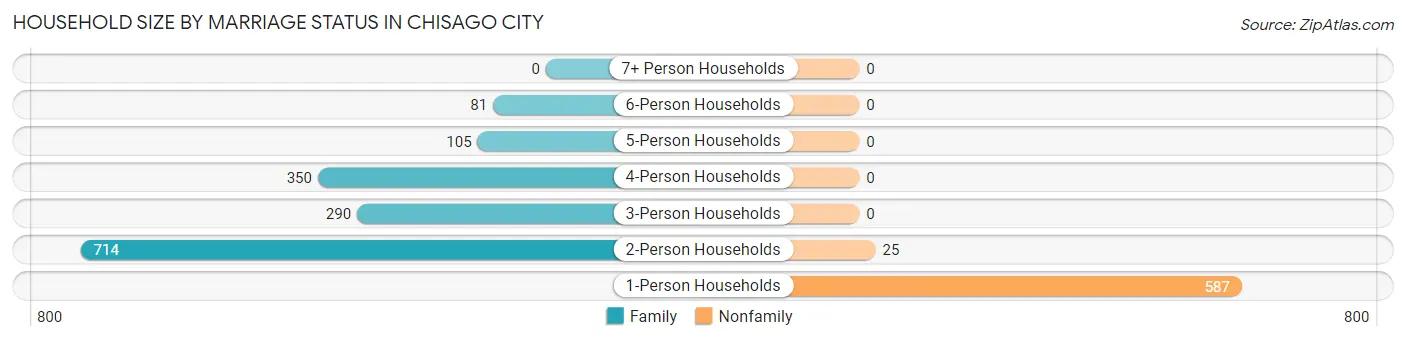
| Household Size | Family Households | Nonfamily Households |
| 1-Person Households | - | 587 (27.3%) |
| 2-Person Households | 714 (33.2%) | 25 (1.2%) |
| 3-Person Households | 290 (13.5%) | 0 (0.0%) |
| 4-Person Households | 350 (16.3%) | 0 (0.0%) |
| 5-Person Households | 105 (4.9%) | 0 (0.0%) |
| 6-Person Households | 81 (3.8%) | 0 (0.0%) |
| 7+ Person Households | 0 (0.0%) | 0 (0.0%) |
| Total | 1,540 (71.6%) | 612 (28.4%) |
Female Fertility in Chisago City
Fertility by Age in Chisago City
Average fertility rate in Chisago City is 46.0 births per 1,000 women. Women in the age bracket of 20 to 34 years have the highest fertility rate with 73.0 births per 1,000 women. Women in the age bracket of 20 to 34 years acount for 68.1% of all women with births.
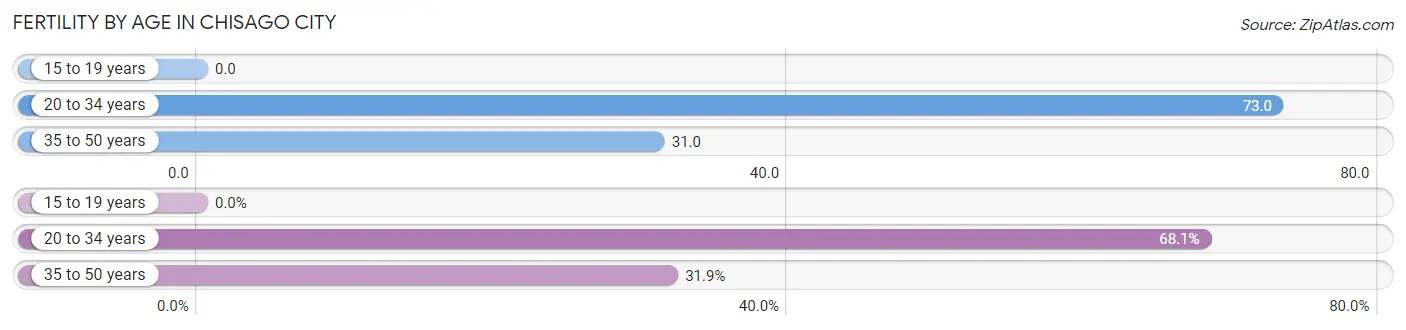
| Age Bracket | Women with Births | Births / 1,000 Women |
| 15 to 19 years | 0 (0.0%) | 0.0 |
| 20 to 34 years | 32 (68.1%) | 73.0 |
| 35 to 50 years | 15 (31.9%) | 31.0 |
| Total | 47 (100.0%) | 46.0 |
Fertility by Age by Marriage Status in Chisago City
40.4% of women with births (47) in Chisago City are married. The highest percentage of unmarried women with births falls into 35 to 50 years age bracket with 60.0% of them unmarried at the time of birth, while the lowest percentage of unmarried women with births belong to 20 to 34 years age bracket with 59.4% of them unmarried.
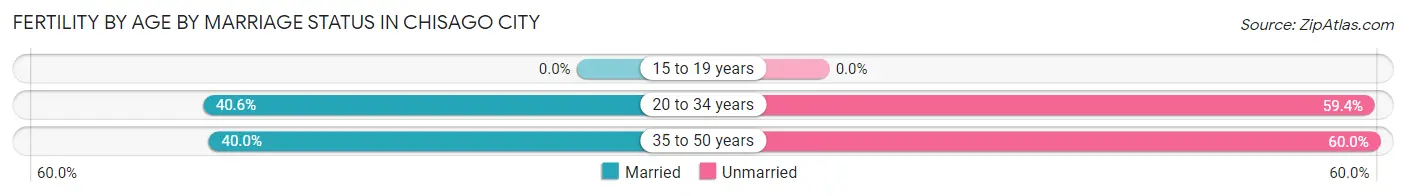
| Age Bracket | Married | Unmarried |
| 15 to 19 years | 0 (0.0%) | 0 (0.0%) |
| 20 to 34 years | 13 (40.6%) | 19 (59.4%) |
| 35 to 50 years | 6 (40.0%) | 9 (60.0%) |
| Total | 19 (40.4%) | 28 (59.6%) |
Fertility by Education in Chisago City
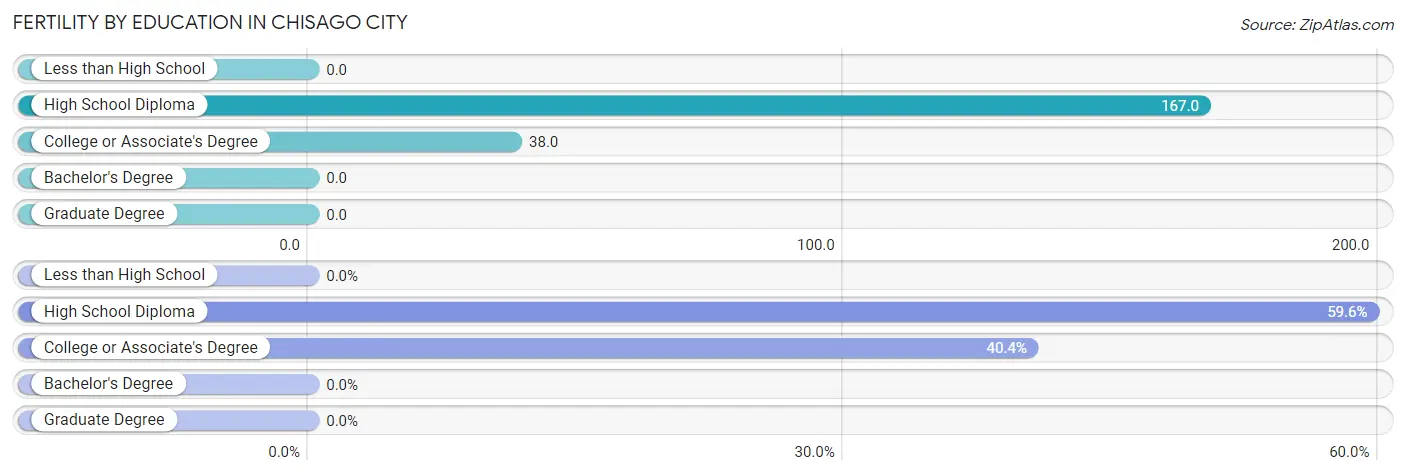
| Educational Attainment | Women with Births | Births / 1,000 Women |
| Less than High School | 0 (0.0%) | 0.0 |
| High School Diploma | 28 (59.6%) | 167.0 |
| College or Associate's Degree | 19 (40.4%) | 38.0 |
| Bachelor's Degree | 0 (0.0%) | 0.0 |
| Graduate Degree | 0 (0.0%) | 0.0 |
| Total | 47 (100.0%) | 46.0 |
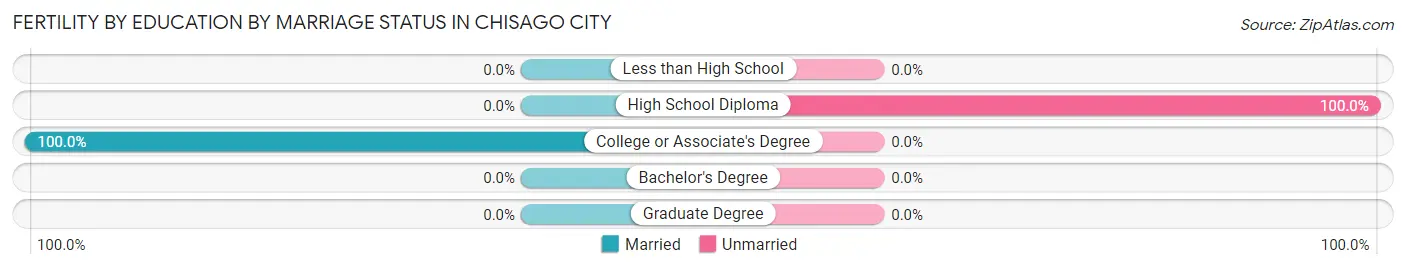
Fertility by Education by Marriage Status in Chisago City
59.6% of women with births in Chisago City are unmarried. Women with the educational attainment of college or associate's degree are most likely to be married with 100.0% of them married at childbirth, while women with the educational attainment of high school diploma are least likely to be married with 100.0% of them unmarried at childbirth.
| Educational Attainment | Married | Unmarried |
| Less than High School | 0 (0.0%) | 0 (0.0%) |
| High School Diploma | 0 (0.0%) | 28 (100.0%) |
| College or Associate's Degree | 19 (100.0%) | 0 (0.0%) |
| Bachelor's Degree | 0 (0.0%) | 0 (0.0%) |
| Graduate Degree | 0 (0.0%) | 0 (0.0%) |
| Total | 19 (40.4%) | 28 (59.6%) |
Employment Characteristics in Chisago City
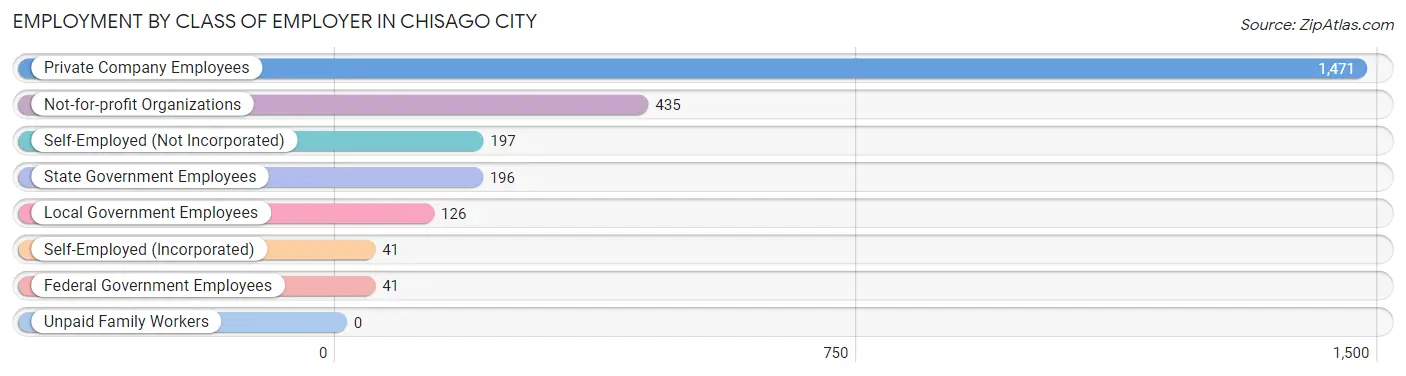
Employment by Class of Employer in Chisago City
Among the 2,507 employed individuals in Chisago City, private company employees (1,471 | 58.7%), not-for-profit organizations (435 | 17.3%), and self-employed (not incorporated) (197 | 7.9%) make up the most common classes of employment.
| Employer Class | # Employees | % Employees |
| Private Company Employees | 1,471 | 58.7% |
| Self-Employed (Incorporated) | 41 | 1.6% |
| Self-Employed (Not Incorporated) | 197 | 7.9% |
| Not-for-profit Organizations | 435 | 17.3% |
| Local Government Employees | 126 | 5.0% |
| State Government Employees | 196 | 7.8% |
| Federal Government Employees | 41 | 1.6% |
| Unpaid Family Workers | 0 | 0.0% |
| Total | 2,507 | 100.0% |
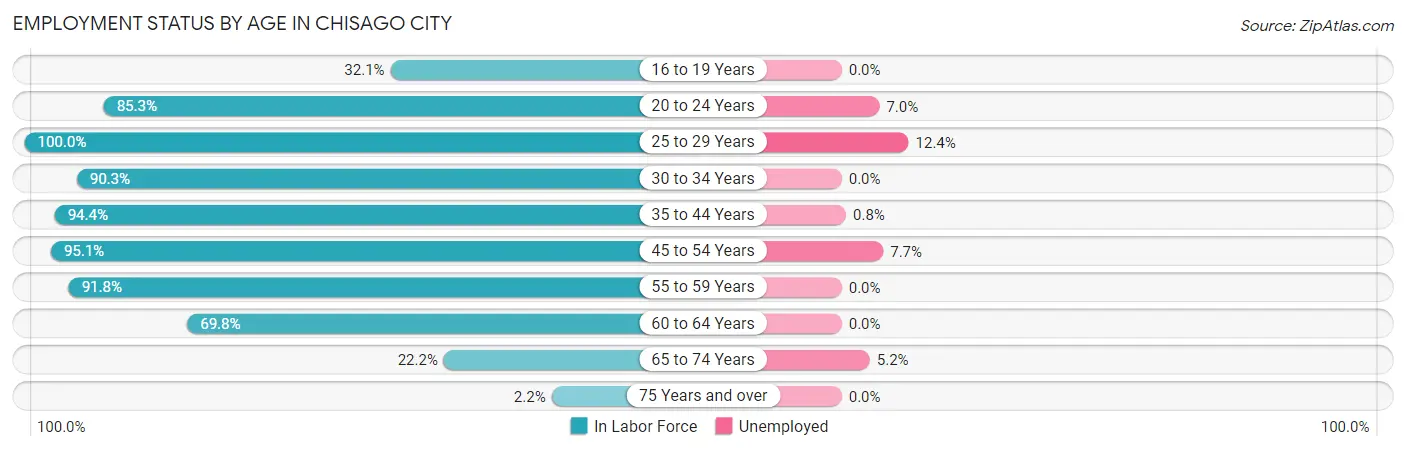
Employment Status by Age in Chisago City
According to the labor force statistics for Chisago City, out of the total population over 16 years of age (4,442), 61.8% or 2,745 individuals are in the labor force, with 4.0% or 110 of them unemployed. The age group with the highest labor force participation rate is 25 to 29 years, with 100.0% or 275 individuals in the labor force. Within the labor force, the 25 to 29 years age range has the highest percentage of unemployed individuals, with 12.4% or 34 of them being unemployed.
| Age Bracket | In Labor Force | Unemployed |
| 16 to 19 Years | 93 (32.1%) | 0 (0.0%) |
| 20 to 24 Years | 285 (85.3%) | 20 (7.0%) |
| 25 to 29 Years | 275 (100.0%) | 34 (12.4%) |
| 30 to 34 Years | 269 (90.3%) | 0 (0.0%) |
| 35 to 44 Years | 708 (94.4%) | 6 (0.8%) |
| 45 to 54 Years | 558 (95.1%) | 43 (7.7%) |
| 55 to 59 Years | 256 (91.8%) | 0 (0.0%) |
| 60 to 64 Years | 132 (69.8%) | 0 (0.0%) |
| 65 to 74 Years | 155 (22.2%) | 8 (5.2%) |
| 75 Years and over | 16 (2.2%) | 0 (0.0%) |
| Total | 2,745 (61.8%) | 110 (4.0%) |
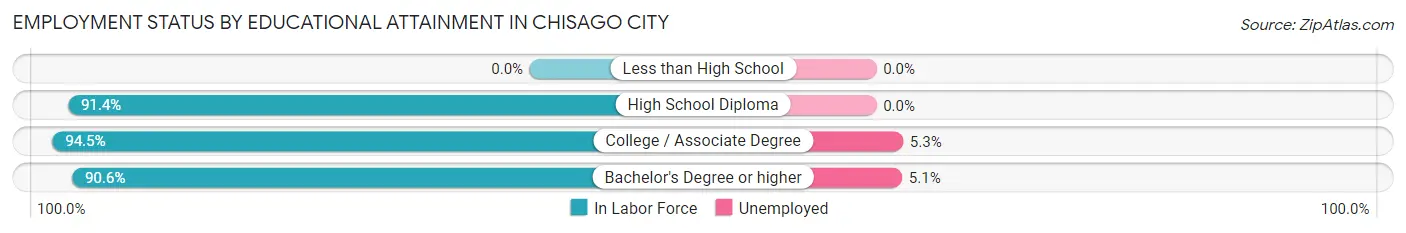
Employment Status by Educational Attainment in Chisago City
According to labor force statistics for Chisago City, 92.4% of individuals (2,197) out of the total population between 25 and 64 years of age (2,378) are in the labor force, with 3.8% or 83 of them being unemployed. The group with the highest labor force participation rate are those with the educational attainment of college / associate degree, with 94.5% or 927 individuals in the labor force. Within the labor force, individuals with college / associate degree education have the highest percentage of unemployment, with 5.3% or 49 of them being unemployed.
| Educational Attainment | In Labor Force | Unemployed |
| Less than High School | 0 (0.0%) | 0 (0.0%) |
| High School Diploma | 603 (91.4%) | 0 (0.0%) |
| College / Associate Degree | 927 (94.5%) | 52 (5.3%) |
| Bachelor's Degree or higher | 668 (90.6%) | 38 (5.1%) |
| Total | 2,197 (92.4%) | 90 (3.8%) |
Employment Occupations by Sex in Chisago City
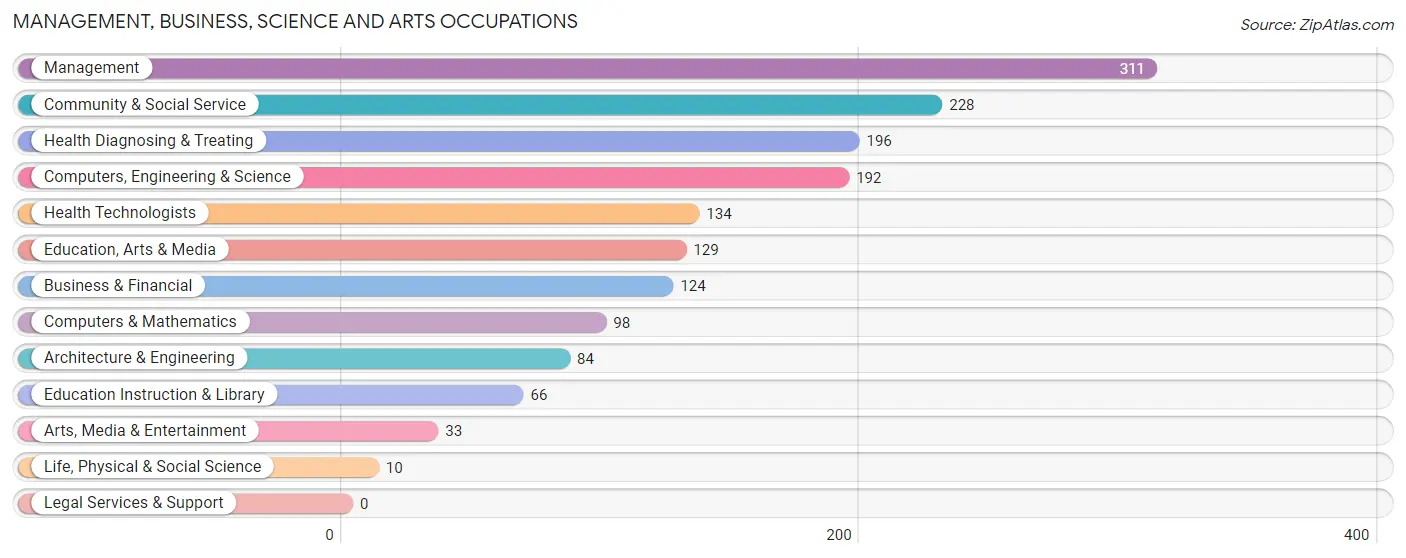
Management, Business, Science and Arts Occupations
The most common Management, Business, Science and Arts occupations in Chisago City are Management (311 | 11.8%), Community & Social Service (228 | 8.6%), Health Diagnosing & Treating (196 | 7.4%), Computers, Engineering & Science (192 | 7.3%), and Health Technologists (134 | 5.1%).
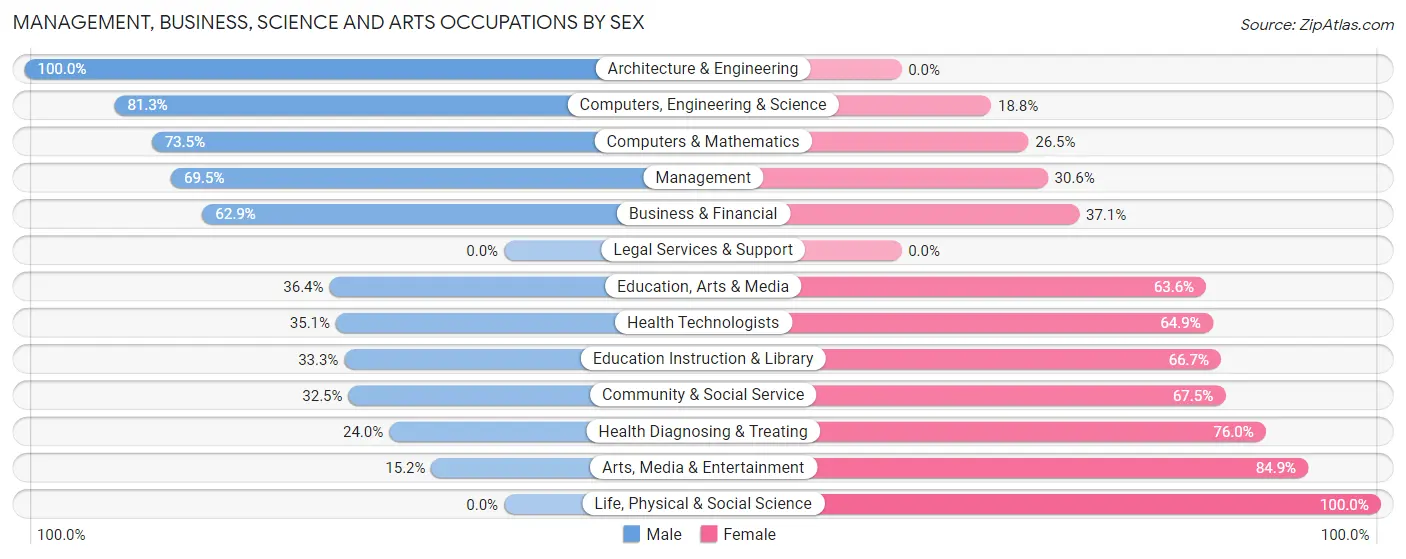
Management, Business, Science and Arts Occupations by Sex
Within the Management, Business, Science and Arts occupations in Chisago City, the most male-oriented occupations are Architecture & Engineering (100.0%), Computers, Engineering & Science (81.2%), and Computers & Mathematics (73.5%), while the most female-oriented occupations are Life, Physical & Social Science (100.0%), Arts, Media & Entertainment (84.9%), and Health Diagnosing & Treating (76.0%).
| Occupation | Male | Female |
| Management | 216 (69.5%) | 95 (30.5%) |
| Business & Financial | 78 (62.9%) | 46 (37.1%) |
| Computers, Engineering & Science | 156 (81.2%) | 36 (18.8%) |
| Computers & Mathematics | 72 (73.5%) | 26 (26.5%) |
| Architecture & Engineering | 84 (100.0%) | 0 (0.0%) |
| Life, Physical & Social Science | 0 (0.0%) | 10 (100.0%) |
| Community & Social Service | 74 (32.5%) | 154 (67.5%) |
| Education, Arts & Media | 47 (36.4%) | 82 (63.6%) |
| Legal Services & Support | 0 (0.0%) | 0 (0.0%) |
| Education Instruction & Library | 22 (33.3%) | 44 (66.7%) |
| Arts, Media & Entertainment | 5 (15.1%) | 28 (84.9%) |
| Health Diagnosing & Treating | 47 (24.0%) | 149 (76.0%) |
| Health Technologists | 47 (35.1%) | 87 (64.9%) |
| Total (Category) | 571 (54.3%) | 480 (45.7%) |
| Total (Overall) | 1,477 (56.0%) | 1,159 (44.0%) |
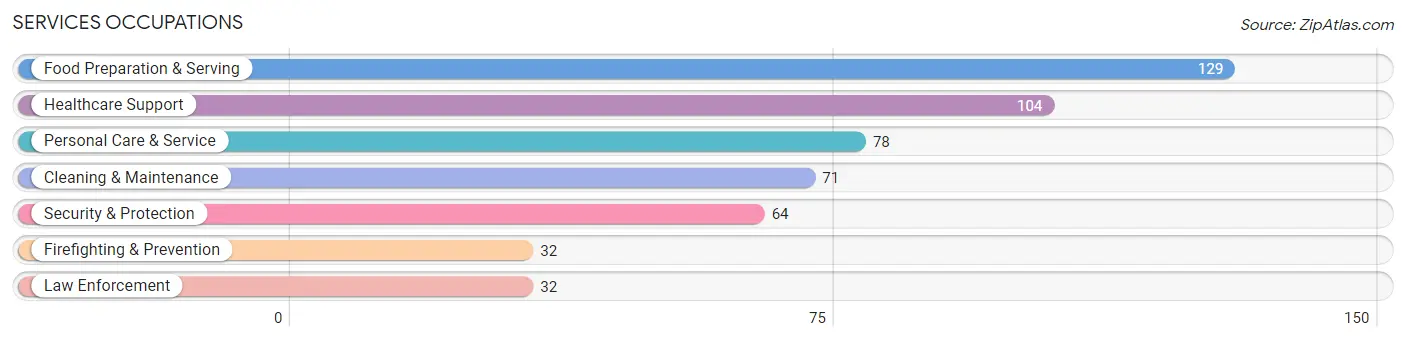
Services Occupations
The most common Services occupations in Chisago City are Food Preparation & Serving (129 | 4.9%), Healthcare Support (104 | 4.0%), Personal Care & Service (78 | 3.0%), Cleaning & Maintenance (71 | 2.7%), and Security & Protection (64 | 2.4%).
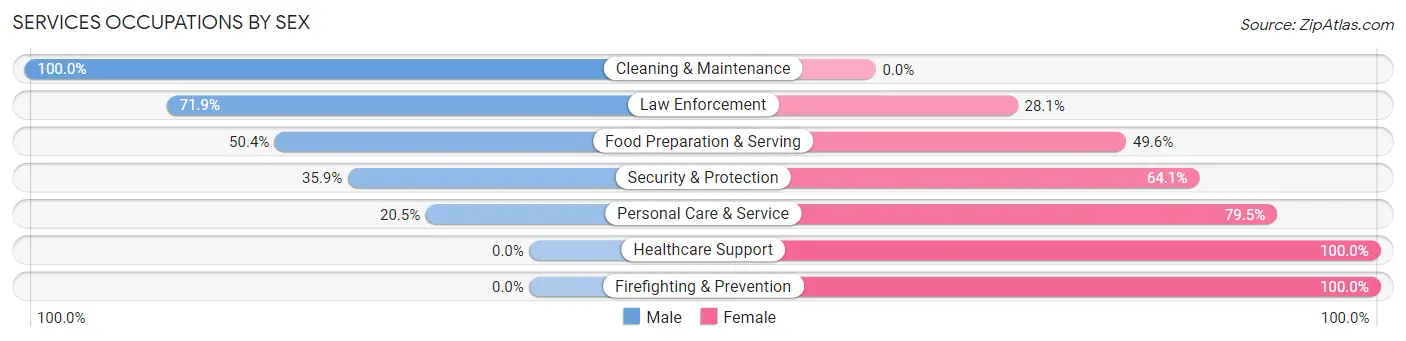
Services Occupations by Sex
Within the Services occupations in Chisago City, the most male-oriented occupations are Cleaning & Maintenance (100.0%), Law Enforcement (71.9%), and Food Preparation & Serving (50.4%), while the most female-oriented occupations are Healthcare Support (100.0%), Firefighting & Prevention (100.0%), and Personal Care & Service (79.5%).
| Occupation | Male | Female |
| Healthcare Support | 0 (0.0%) | 104 (100.0%) |
| Security & Protection | 23 (35.9%) | 41 (64.1%) |
| Firefighting & Prevention | 0 (0.0%) | 32 (100.0%) |
| Law Enforcement | 23 (71.9%) | 9 (28.1%) |
| Food Preparation & Serving | 65 (50.4%) | 64 (49.6%) |
| Cleaning & Maintenance | 71 (100.0%) | 0 (0.0%) |
| Personal Care & Service | 16 (20.5%) | 62 (79.5%) |
| Total (Category) | 175 (39.2%) | 271 (60.8%) |
| Total (Overall) | 1,477 (56.0%) | 1,159 (44.0%) |
Sales and Office Occupations
The most common Sales and Office occupations in Chisago City are Office & Administration (288 | 10.9%), and Sales & Related (132 | 5.0%).
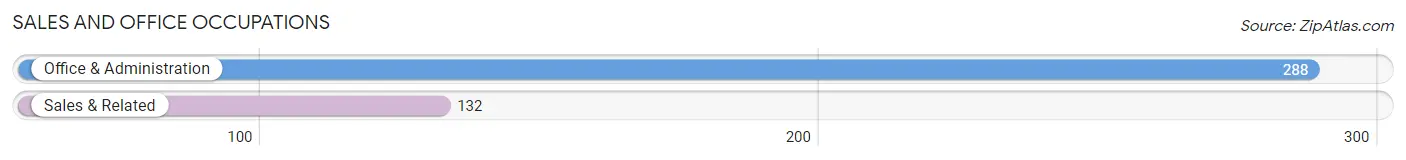
Sales and Office Occupations by Sex
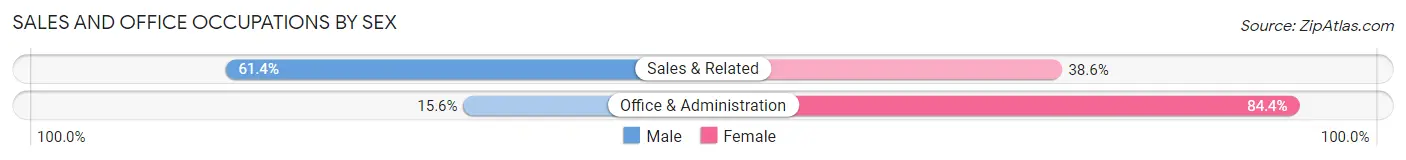
| Occupation | Male | Female |
| Sales & Related | 81 (61.4%) | 51 (38.6%) |
| Office & Administration | 45 (15.6%) | 243 (84.4%) |
| Total (Category) | 126 (30.0%) | 294 (70.0%) |
| Total (Overall) | 1,477 (56.0%) | 1,159 (44.0%) |
Natural Resources, Construction and Maintenance Occupations
The most common Natural Resources, Construction and Maintenance occupations in Chisago City are Construction & Extraction (176 | 6.7%), and Installation, Maintenance & Repair (41 | 1.6%).
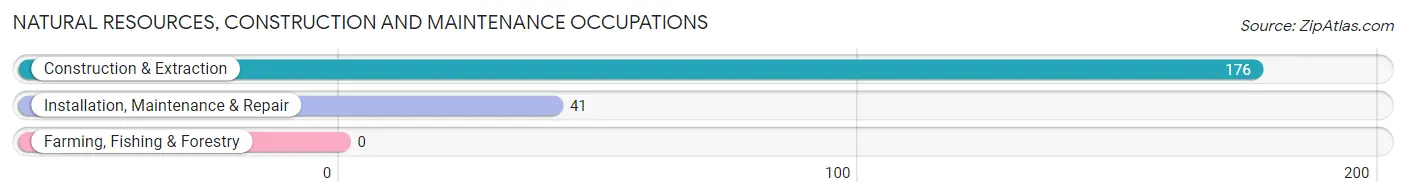
Natural Resources, Construction and Maintenance Occupations by Sex
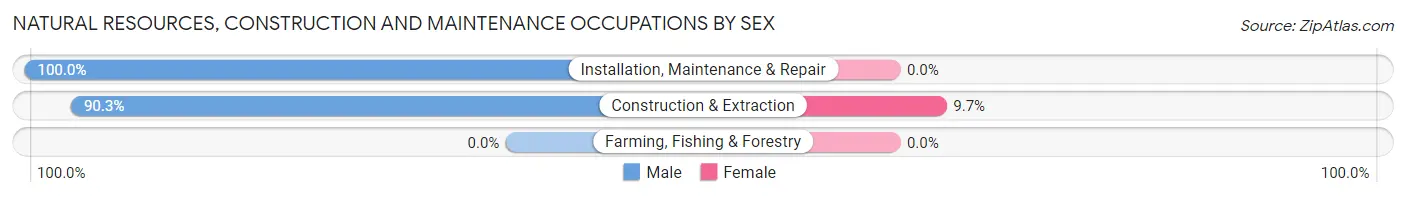
| Occupation | Male | Female |
| Farming, Fishing & Forestry | 0 (0.0%) | 0 (0.0%) |
| Construction & Extraction | 159 (90.3%) | 17 (9.7%) |
| Installation, Maintenance & Repair | 41 (100.0%) | 0 (0.0%) |
| Total (Category) | 200 (92.2%) | 17 (7.8%) |
| Total (Overall) | 1,477 (56.0%) | 1,159 (44.0%) |
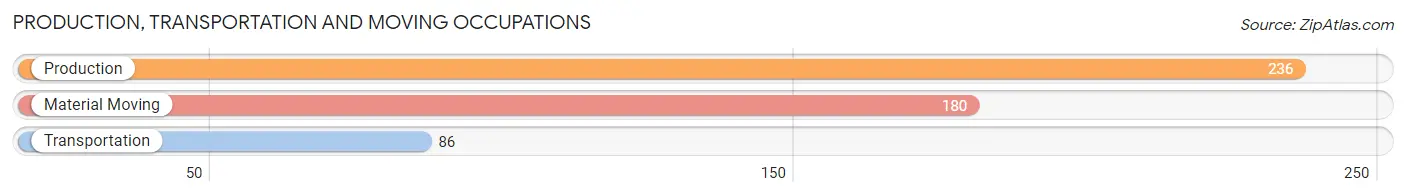
Production, Transportation and Moving Occupations
The most common Production, Transportation and Moving occupations in Chisago City are Production (236 | 8.9%), Material Moving (180 | 6.8%), and Transportation (86 | 3.3%).
Production, Transportation and Moving Occupations by Sex
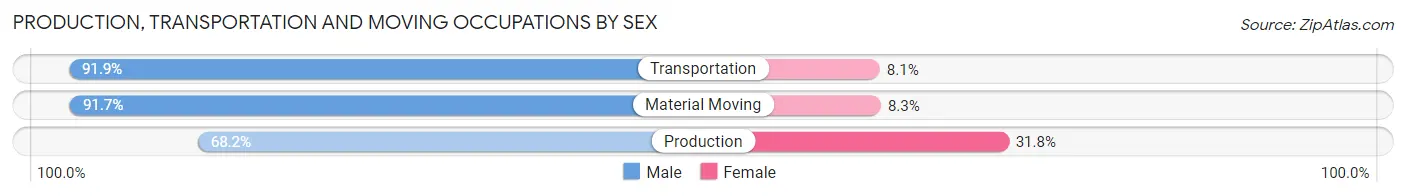
| Occupation | Male | Female |
| Production | 161 (68.2%) | 75 (31.8%) |
| Transportation | 79 (91.9%) | 7 (8.1%) |
| Material Moving | 165 (91.7%) | 15 (8.3%) |
| Total (Category) | 405 (80.7%) | 97 (19.3%) |
| Total (Overall) | 1,477 (56.0%) | 1,159 (44.0%) |
Employment Industries by Sex in Chisago City
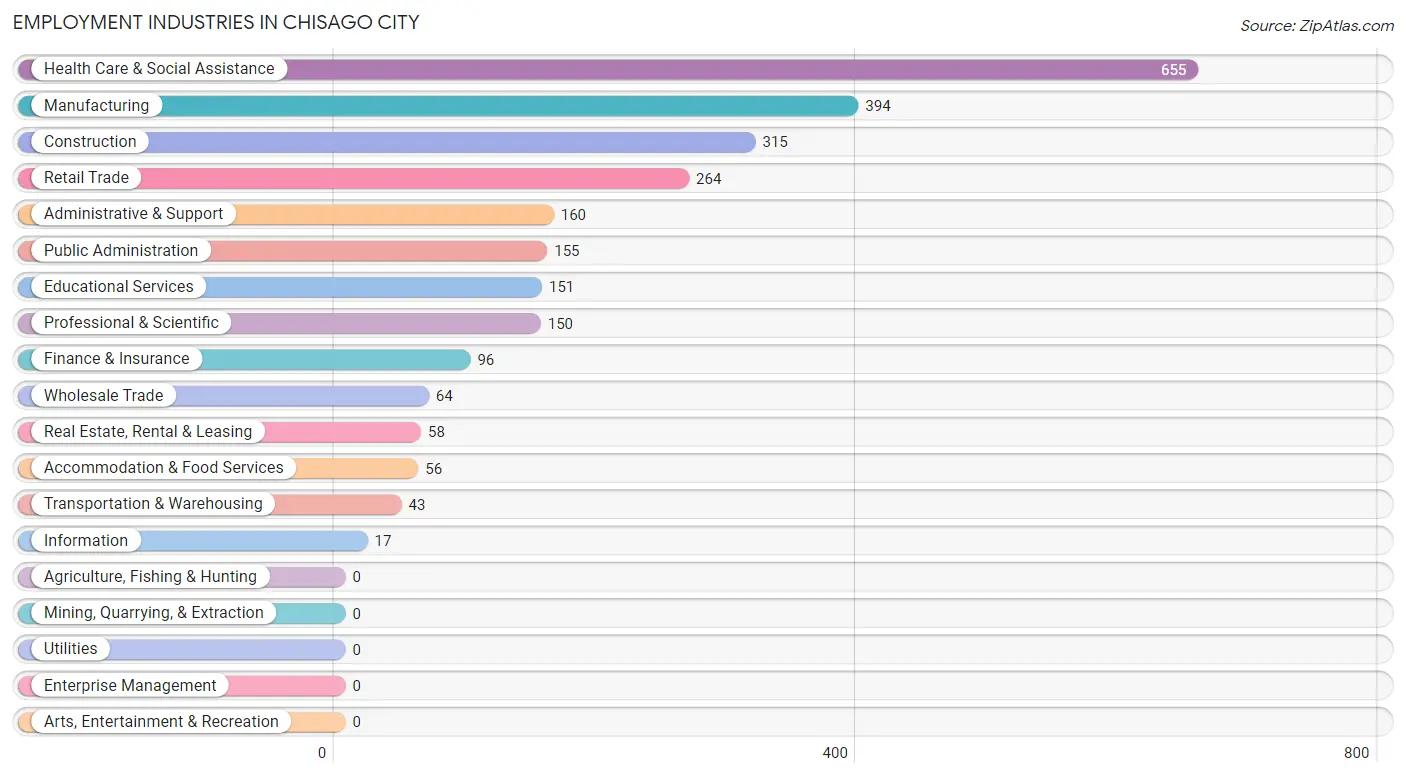
Employment Industries in Chisago City
The major employment industries in Chisago City include Health Care & Social Assistance (655 | 24.8%), Manufacturing (394 | 14.9%), Construction (315 | 11.9%), Retail Trade (264 | 10.0%), and Administrative & Support (160 | 6.1%).
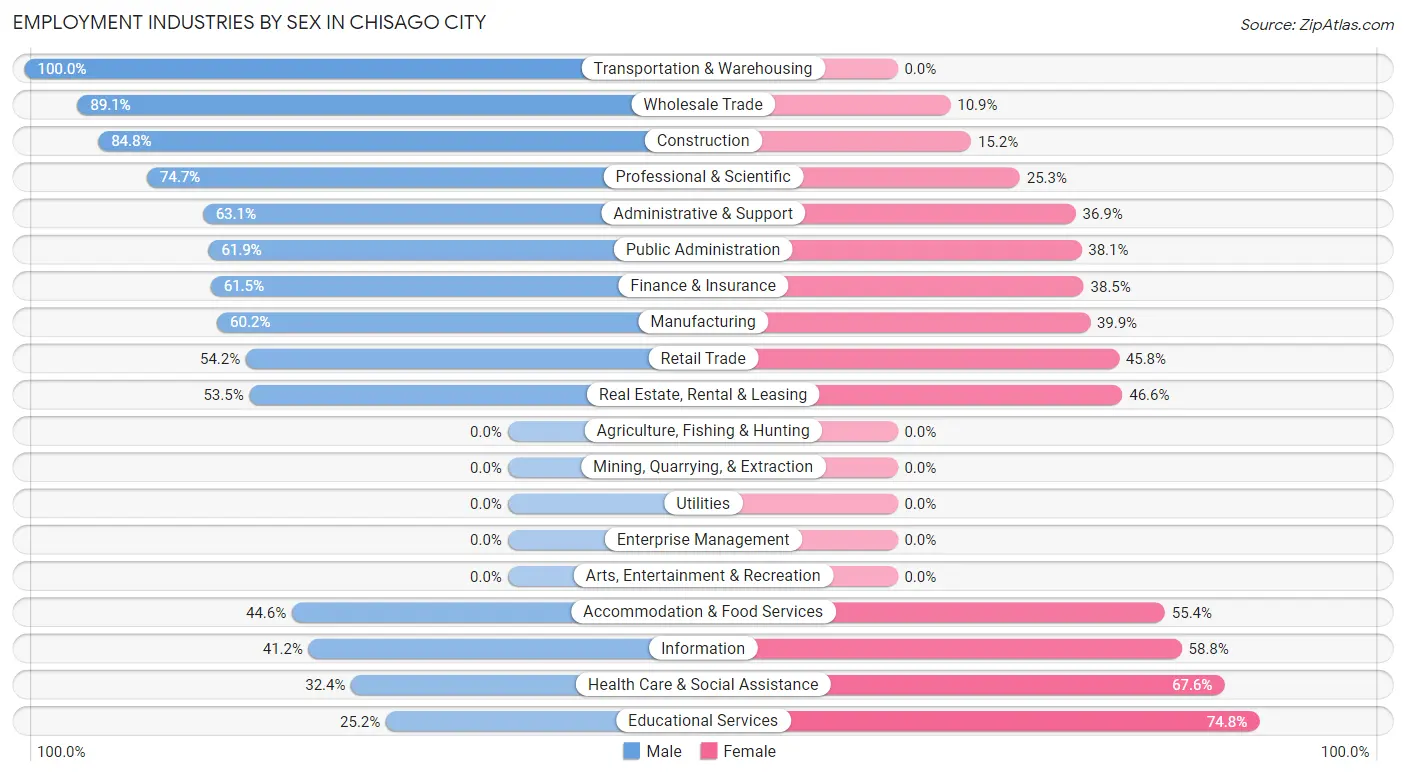
Employment Industries by Sex in Chisago City
The Chisago City industries that see more men than women are Transportation & Warehousing (100.0%), Wholesale Trade (89.1%), and Construction (84.8%), whereas the industries that tend to have a higher number of women are Educational Services (74.8%), Health Care & Social Assistance (67.6%), and Information (58.8%).
| Industry | Male | Female |
| Agriculture, Fishing & Hunting | 0 (0.0%) | 0 (0.0%) |
| Mining, Quarrying, & Extraction | 0 (0.0%) | 0 (0.0%) |
| Construction | 267 (84.8%) | 48 (15.2%) |
| Manufacturing | 237 (60.2%) | 157 (39.9%) |
| Wholesale Trade | 57 (89.1%) | 7 (10.9%) |
| Retail Trade | 143 (54.2%) | 121 (45.8%) |
| Transportation & Warehousing | 43 (100.0%) | 0 (0.0%) |
| Utilities | 0 (0.0%) | 0 (0.0%) |
| Information | 7 (41.2%) | 10 (58.8%) |
| Finance & Insurance | 59 (61.5%) | 37 (38.5%) |
| Real Estate, Rental & Leasing | 31 (53.4%) | 27 (46.6%) |
| Professional & Scientific | 112 (74.7%) | 38 (25.3%) |
| Enterprise Management | 0 (0.0%) | 0 (0.0%) |
| Administrative & Support | 101 (63.1%) | 59 (36.9%) |
| Educational Services | 38 (25.2%) | 113 (74.8%) |
| Health Care & Social Assistance | 212 (32.4%) | 443 (67.6%) |
| Arts, Entertainment & Recreation | 0 (0.0%) | 0 (0.0%) |
| Accommodation & Food Services | 25 (44.6%) | 31 (55.4%) |
| Public Administration | 96 (61.9%) | 59 (38.1%) |
| Total | 1,477 (56.0%) | 1,159 (44.0%) |
Education in Chisago City
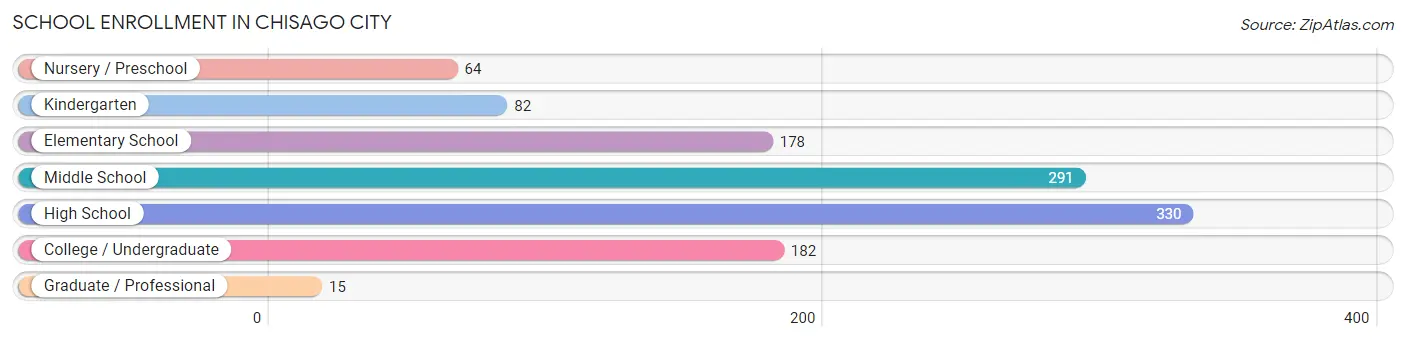
School Enrollment in Chisago City
The most common levels of schooling among the 1,142 students in Chisago City are high school (330 | 28.9%), middle school (291 | 25.5%), and college / undergraduate (182 | 15.9%).
| School Level | # Students | % Students |
| Nursery / Preschool | 64 | 5.6% |
| Kindergarten | 82 | 7.2% |
| Elementary School | 178 | 15.6% |
| Middle School | 291 | 25.5% |
| High School | 330 | 28.9% |
| College / Undergraduate | 182 | 15.9% |
| Graduate / Professional | 15 | 1.3% |
| Total | 1,142 | 100.0% |
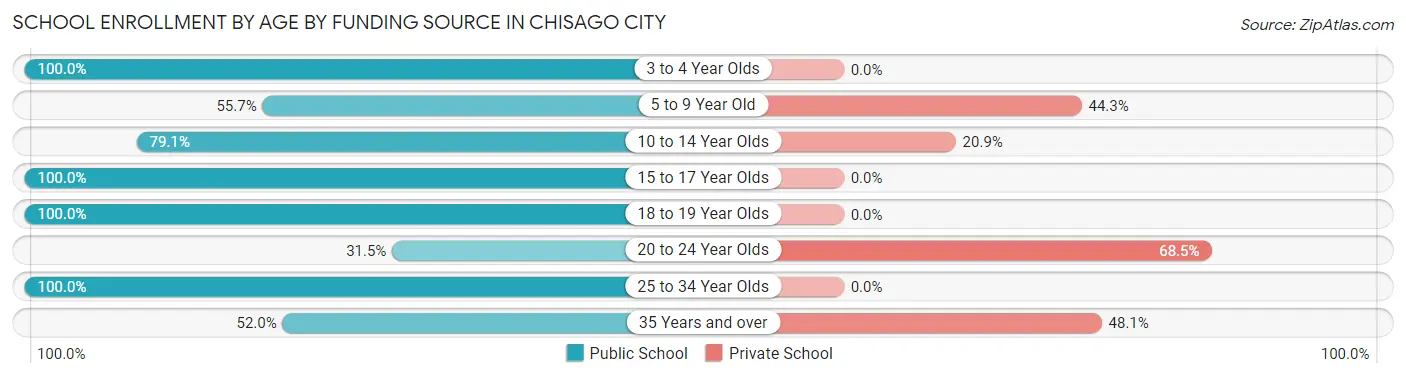
School Enrollment by Age by Funding Source in Chisago City
Out of a total of 1,142 students who are enrolled in schools in Chisago City, 300 (26.3%) attend a private institution, while the remaining 842 (73.7%) are enrolled in public schools. The age group of 20 to 24 year olds has the highest likelihood of being enrolled in private schools, with 76 (68.5% in the age bracket) enrolled. Conversely, the age group of 3 to 4 year olds has the lowest likelihood of being enrolled in a private school, with 25 (100.0% in the age bracket) attending a public institution.
| Age Bracket | Public School | Private School |
| 3 to 4 Year Olds | 25 (100.0%) | 0 (0.0%) |
| 5 to 9 Year Old | 137 (55.7%) | 109 (44.3%) |
| 10 to 14 Year Olds | 296 (79.1%) | 78 (20.9%) |
| 15 to 17 Year Olds | 226 (100.0%) | 0 (0.0%) |
| 18 to 19 Year Olds | 74 (100.0%) | 0 (0.0%) |
| 20 to 24 Year Olds | 35 (31.5%) | 76 (68.5%) |
| 25 to 34 Year Olds | 9 (100.0%) | 0 (0.0%) |
| 35 Years and over | 40 (51.9%) | 37 (48.0%) |
| Total | 842 (73.7%) | 300 (26.3%) |
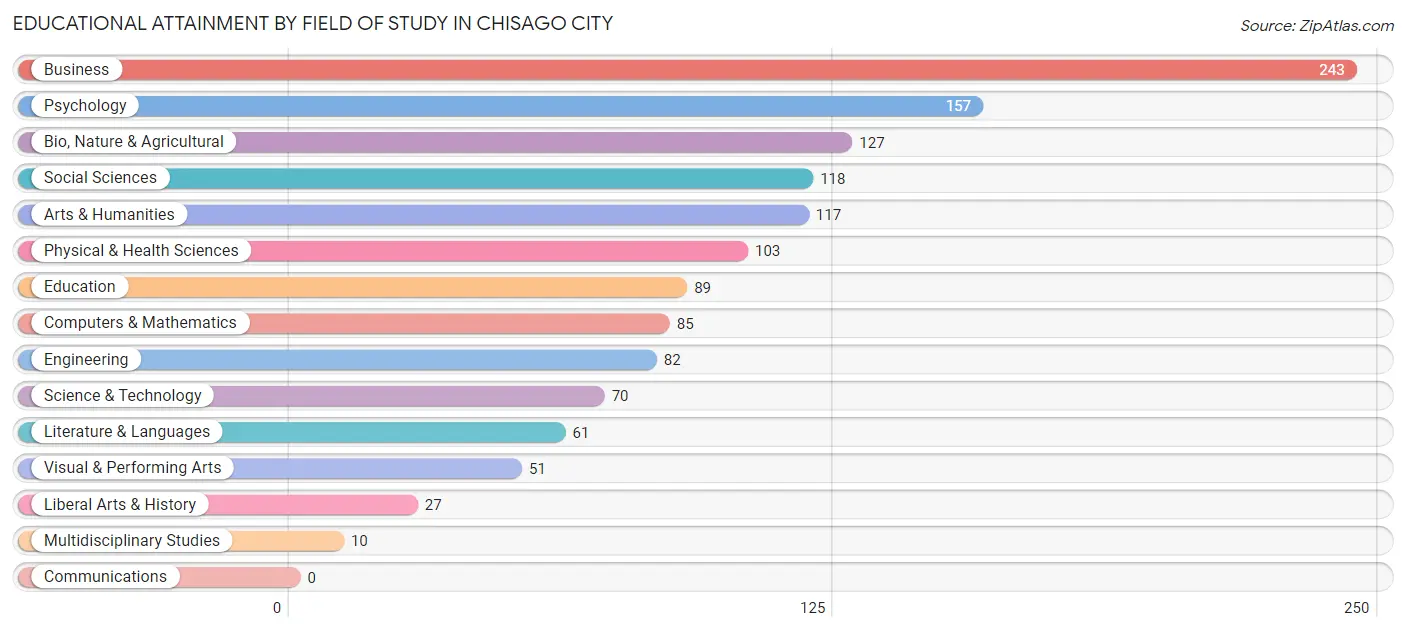
Educational Attainment by Field of Study in Chisago City
Business (243 | 18.1%), psychology (157 | 11.7%), bio, nature & agricultural (127 | 9.5%), social sciences (118 | 8.8%), and arts & humanities (117 | 8.7%) are the most common fields of study among 1,340 individuals in Chisago City who have obtained a bachelor's degree or higher.
| Field of Study | # Graduates | % Graduates |
| Computers & Mathematics | 85 | 6.3% |
| Bio, Nature & Agricultural | 127 | 9.5% |
| Physical & Health Sciences | 103 | 7.7% |
| Psychology | 157 | 11.7% |
| Social Sciences | 118 | 8.8% |
| Engineering | 82 | 6.1% |
| Multidisciplinary Studies | 10 | 0.7% |
| Science & Technology | 70 | 5.2% |
| Business | 243 | 18.1% |
| Education | 89 | 6.6% |
| Literature & Languages | 61 | 4.5% |
| Liberal Arts & History | 27 | 2.0% |
| Visual & Performing Arts | 51 | 3.8% |
| Communications | 0 | 0.0% |
| Arts & Humanities | 117 | 8.7% |
| Total | 1,340 | 100.0% |
Transportation & Commute in Chisago City
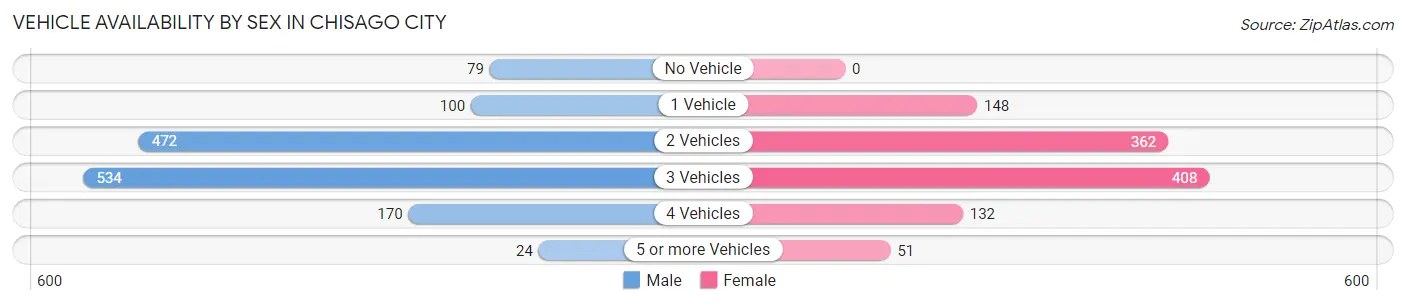
Vehicle Availability by Sex in Chisago City
The most prevalent vehicle ownership categories in Chisago City are males with 3 vehicles (534, accounting for 38.7%) and females with 3 vehicles (408, making up 48.5%).
| Vehicles Available | Male | Female |
| No Vehicle | 79 (5.7%) | 0 (0.0%) |
| 1 Vehicle | 100 (7.2%) | 148 (13.4%) |
| 2 Vehicles | 472 (34.2%) | 362 (32.9%) |
| 3 Vehicles | 534 (38.7%) | 408 (37.1%) |
| 4 Vehicles | 170 (12.3%) | 132 (12.0%) |
| 5 or more Vehicles | 24 (1.7%) | 51 (4.6%) |
| Total | 1,379 (100.0%) | 1,101 (100.0%) |
Commute Time in Chisago City
The most frequently occuring commute durations in Chisago City are 40 to 44 minutes (323 commuters, 15.6%), 15 to 19 minutes (320 commuters, 15.5%), and 45 to 59 minutes (248 commuters, 12.0%).
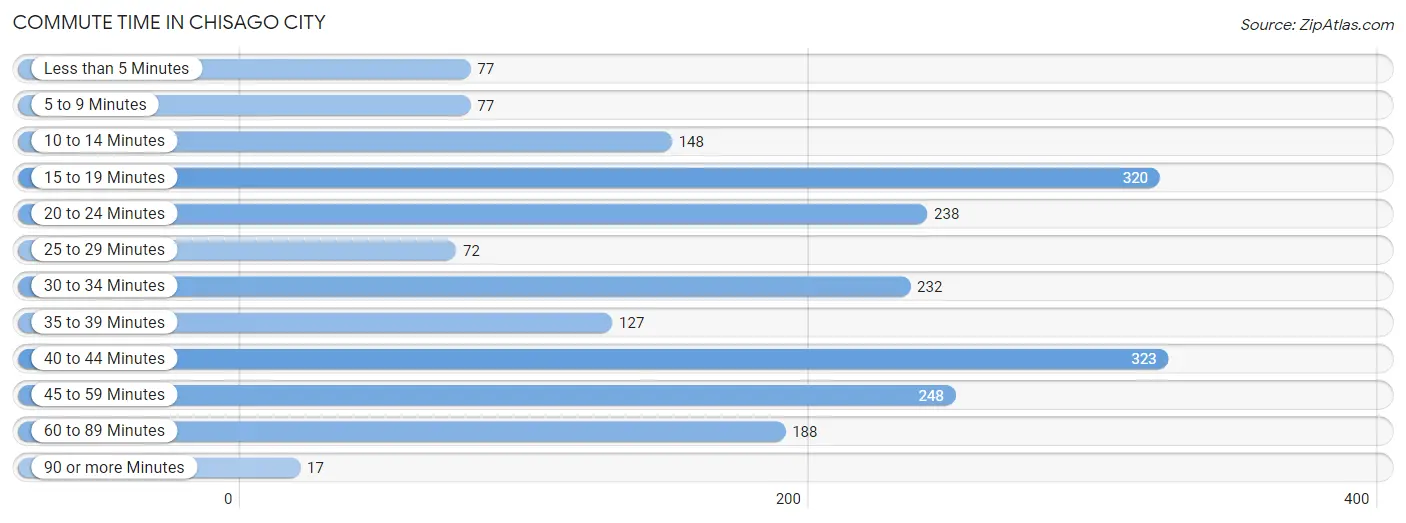
| Commute Time | # Commuters | % Commuters |
| Less than 5 Minutes | 77 | 3.7% |
| 5 to 9 Minutes | 77 | 3.7% |
| 10 to 14 Minutes | 148 | 7.2% |
| 15 to 19 Minutes | 320 | 15.5% |
| 20 to 24 Minutes | 238 | 11.5% |
| 25 to 29 Minutes | 72 | 3.5% |
| 30 to 34 Minutes | 232 | 11.2% |
| 35 to 39 Minutes | 127 | 6.1% |
| 40 to 44 Minutes | 323 | 15.6% |
| 45 to 59 Minutes | 248 | 12.0% |
| 60 to 89 Minutes | 188 | 9.1% |
| 90 or more Minutes | 17 | 0.8% |
Commute Time by Sex in Chisago City
The most common commute times in Chisago City are 40 to 44 minutes (262 commuters, 22.9%) for males and 15 to 19 minutes (169 commuters, 18.3%) for females.
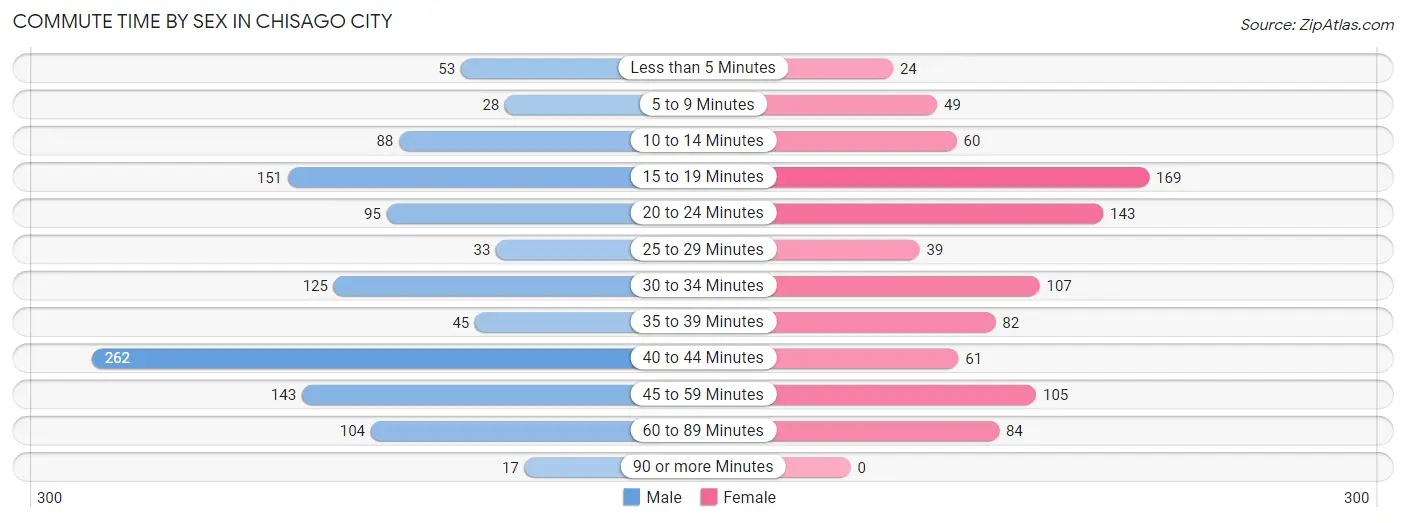
| Commute Time | Male | Female |
| Less than 5 Minutes | 53 (4.6%) | 24 (2.6%) |
| 5 to 9 Minutes | 28 (2.5%) | 49 (5.3%) |
| 10 to 14 Minutes | 88 (7.7%) | 60 (6.5%) |
| 15 to 19 Minutes | 151 (13.2%) | 169 (18.3%) |
| 20 to 24 Minutes | 95 (8.3%) | 143 (15.5%) |
| 25 to 29 Minutes | 33 (2.9%) | 39 (4.2%) |
| 30 to 34 Minutes | 125 (10.9%) | 107 (11.6%) |
| 35 to 39 Minutes | 45 (3.9%) | 82 (8.9%) |
| 40 to 44 Minutes | 262 (22.9%) | 61 (6.6%) |
| 45 to 59 Minutes | 143 (12.5%) | 105 (11.4%) |
| 60 to 89 Minutes | 104 (9.1%) | 84 (9.1%) |
| 90 or more Minutes | 17 (1.5%) | 0 (0.0%) |
Time of Departure to Work by Sex in Chisago City
The most frequent times of departure to work in Chisago City are 7:30 AM to 7:59 AM (226, 19.8%) for males and 7:00 AM to 7:29 AM (320, 34.7%) for females.
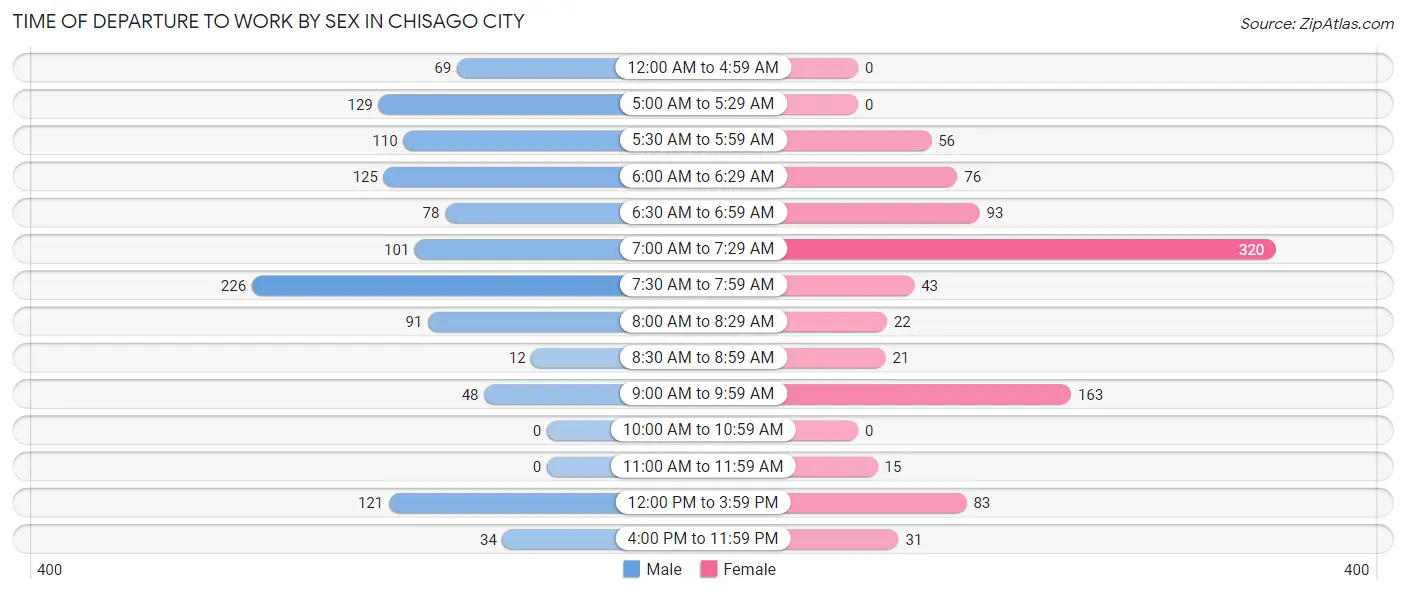
| Time of Departure | Male | Female |
| 12:00 AM to 4:59 AM | 69 (6.0%) | 0 (0.0%) |
| 5:00 AM to 5:29 AM | 129 (11.3%) | 0 (0.0%) |
| 5:30 AM to 5:59 AM | 110 (9.6%) | 56 (6.1%) |
| 6:00 AM to 6:29 AM | 125 (10.9%) | 76 (8.2%) |
| 6:30 AM to 6:59 AM | 78 (6.8%) | 93 (10.1%) |
| 7:00 AM to 7:29 AM | 101 (8.8%) | 320 (34.7%) |
| 7:30 AM to 7:59 AM | 226 (19.8%) | 43 (4.7%) |
| 8:00 AM to 8:29 AM | 91 (8.0%) | 22 (2.4%) |
| 8:30 AM to 8:59 AM | 12 (1.1%) | 21 (2.3%) |
| 9:00 AM to 9:59 AM | 48 (4.2%) | 163 (17.7%) |
| 10:00 AM to 10:59 AM | 0 (0.0%) | 0 (0.0%) |
| 11:00 AM to 11:59 AM | 0 (0.0%) | 15 (1.6%) |
| 12:00 PM to 3:59 PM | 121 (10.6%) | 83 (9.0%) |
| 4:00 PM to 11:59 PM | 34 (3.0%) | 31 (3.4%) |
| Total | 1,144 (100.0%) | 923 (100.0%) |
Housing Occupancy in Chisago City
Occupancy by Ownership in Chisago City
Of the total 2,152 dwellings in Chisago City, owner-occupied units account for 1,603 (74.5%), while renter-occupied units make up 549 (25.5%).
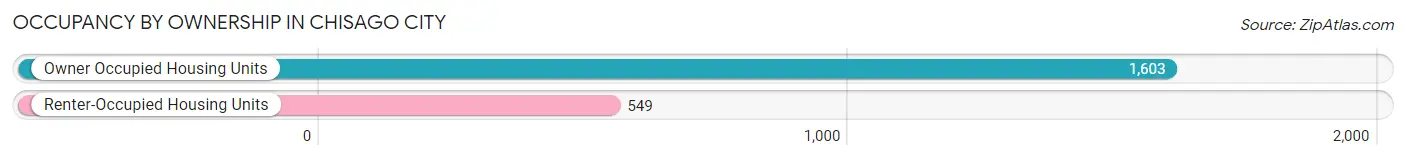
| Occupancy | # Housing Units | % Housing Units |
| Owner Occupied Housing Units | 1,603 | 74.5% |
| Renter-Occupied Housing Units | 549 | 25.5% |
| Total Occupied Housing Units | 2,152 | 100.0% |
Occupancy by Household Size in Chisago City
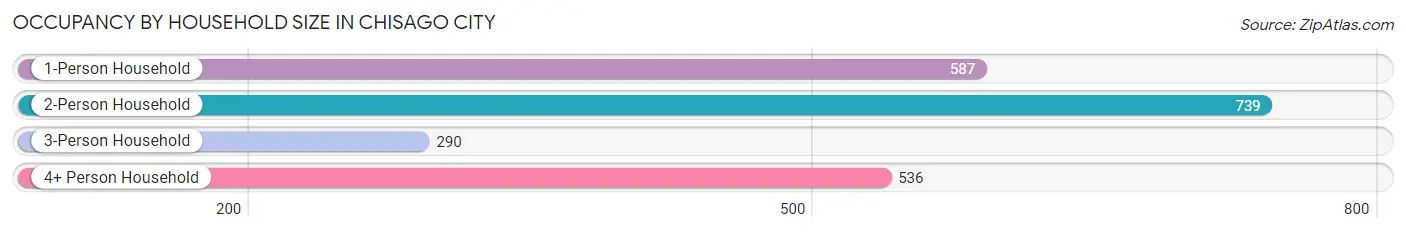
| Household Size | # Housing Units | % Housing Units |
| 1-Person Household | 587 | 27.3% |
| 2-Person Household | 739 | 34.3% |
| 3-Person Household | 290 | 13.5% |
| 4+ Person Household | 536 | 24.9% |
| Total Housing Units | 2,152 | 100.0% |
Occupancy by Ownership by Household Size in Chisago City
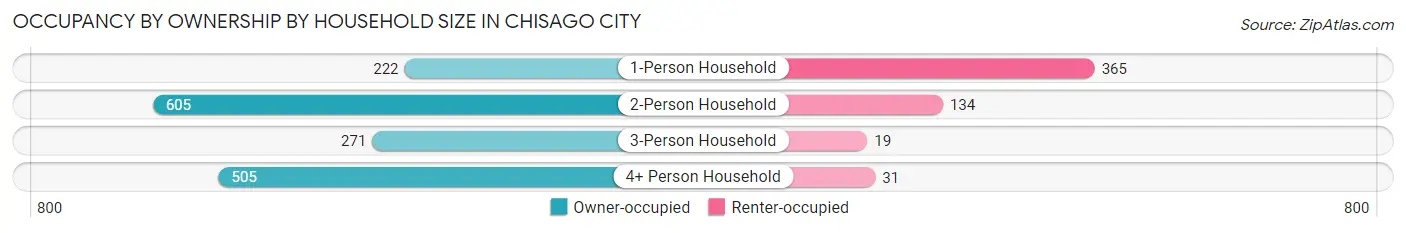
| Household Size | Owner-occupied | Renter-occupied |
| 1-Person Household | 222 (37.8%) | 365 (62.2%) |
| 2-Person Household | 605 (81.9%) | 134 (18.1%) |
| 3-Person Household | 271 (93.4%) | 19 (6.6%) |
| 4+ Person Household | 505 (94.2%) | 31 (5.8%) |
| Total Housing Units | 1,603 (74.5%) | 549 (25.5%) |
Occupancy by Educational Attainment in Chisago City
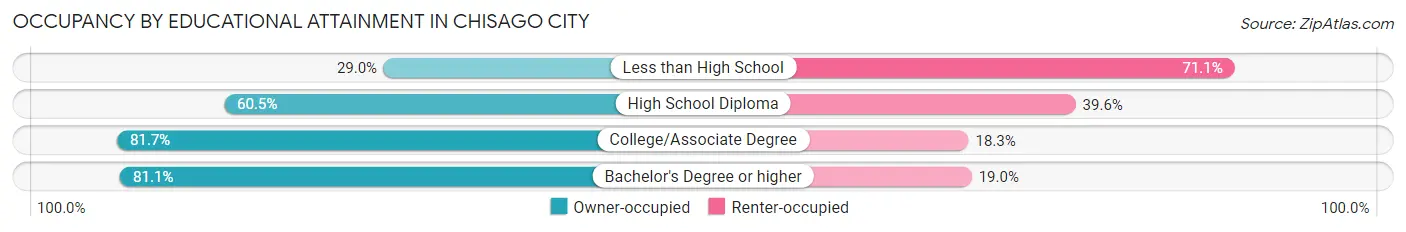
| Household Size | Owner-occupied | Renter-occupied |
| Less than High School | 11 (28.9%) | 27 (71.1%) |
| High School Diploma | 373 (60.5%) | 244 (39.6%) |
| College/Associate Degree | 740 (81.7%) | 166 (18.3%) |
| Bachelor's Degree or higher | 479 (81.0%) | 112 (19.0%) |
Occupancy by Age of Householder in Chisago City
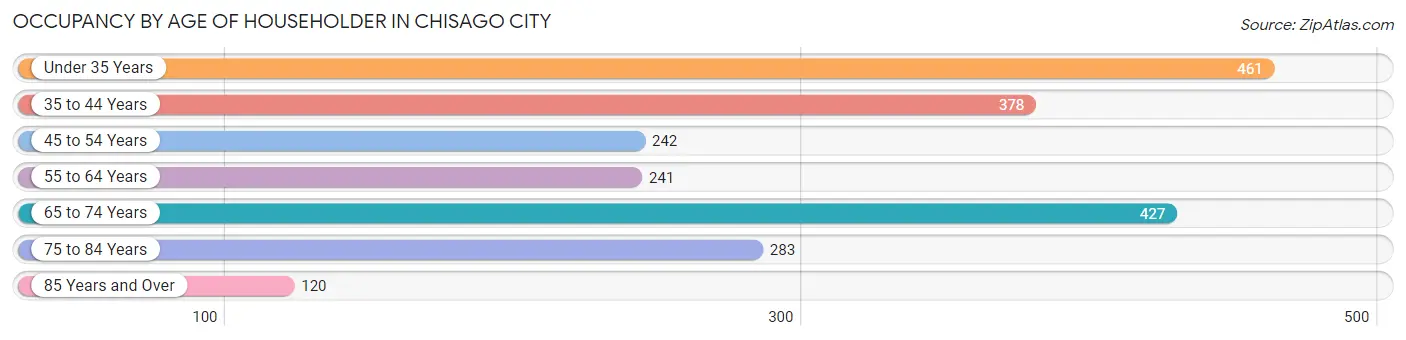
| Age Bracket | # Households | % Households |
| Under 35 Years | 461 | 21.4% |
| 35 to 44 Years | 378 | 17.6% |
| 45 to 54 Years | 242 | 11.3% |
| 55 to 64 Years | 241 | 11.2% |
| 65 to 74 Years | 427 | 19.8% |
| 75 to 84 Years | 283 | 13.2% |
| 85 Years and Over | 120 | 5.6% |
| Total | 2,152 | 100.0% |
Housing Finances in Chisago City
Median Income by Occupancy in Chisago City
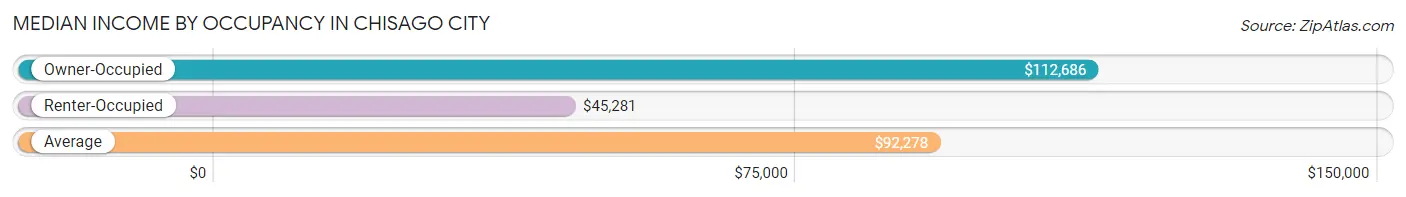
| Occupancy Type | # Households | Median Income |
| Owner-Occupied | 1,603 (74.5%) | $112,686 |
| Renter-Occupied | 549 (25.5%) | $45,281 |
| Average | 2,152 (100.0%) | $92,278 |
Occupancy by Householder Income Bracket in Chisago City
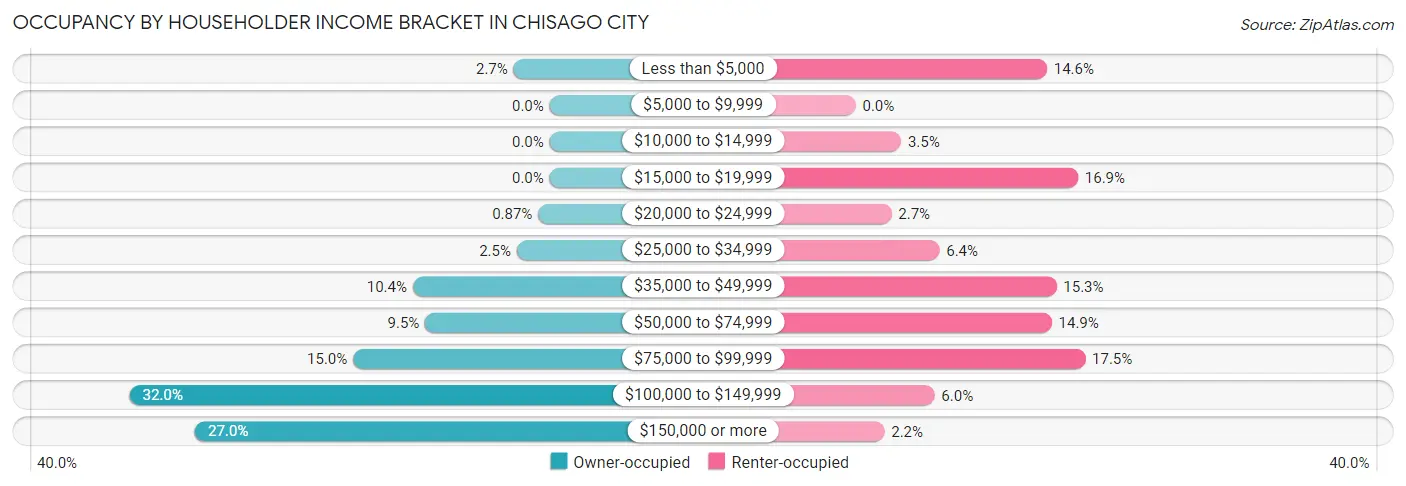
| Income Bracket | Owner-occupied | Renter-occupied |
| Less than $5,000 | 44 (2.7%) | 80 (14.6%) |
| $5,000 to $9,999 | 0 (0.0%) | 0 (0.0%) |
| $10,000 to $14,999 | 0 (0.0%) | 19 (3.5%) |
| $15,000 to $19,999 | 0 (0.0%) | 93 (16.9%) |
| $20,000 to $24,999 | 14 (0.9%) | 15 (2.7%) |
| $25,000 to $34,999 | 40 (2.5%) | 35 (6.4%) |
| $35,000 to $49,999 | 167 (10.4%) | 84 (15.3%) |
| $50,000 to $74,999 | 152 (9.5%) | 82 (14.9%) |
| $75,000 to $99,999 | 240 (15.0%) | 96 (17.5%) |
| $100,000 to $149,999 | 513 (32.0%) | 33 (6.0%) |
| $150,000 or more | 433 (27.0%) | 12 (2.2%) |
| Total | 1,603 (100.0%) | 549 (100.0%) |
Monthly Housing Cost Tiers in Chisago City
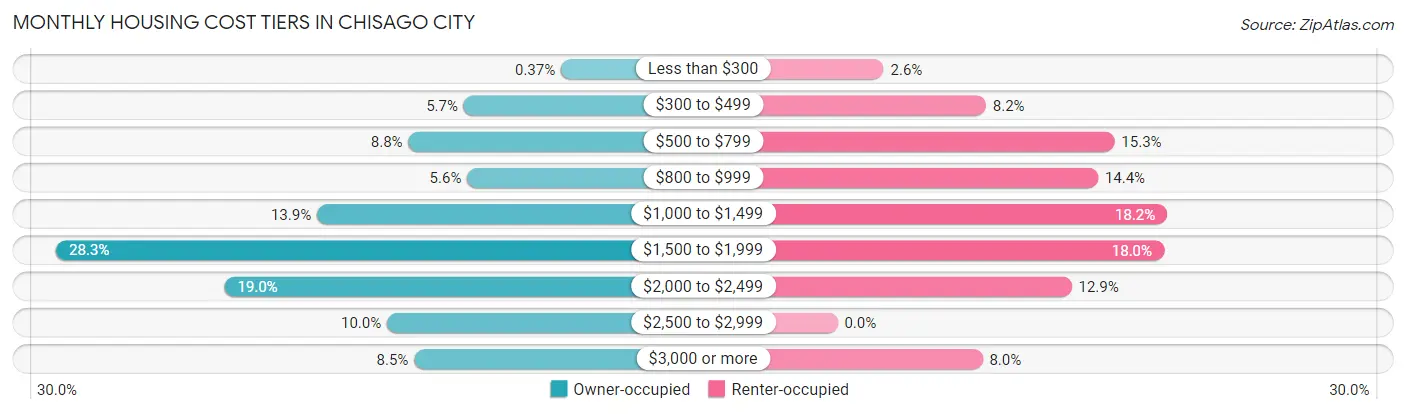
| Monthly Cost | Owner-occupied | Renter-occupied |
| Less than $300 | 6 (0.4%) | 14 (2.5%) |
| $300 to $499 | 92 (5.7%) | 45 (8.2%) |
| $500 to $799 | 141 (8.8%) | 84 (15.3%) |
| $800 to $999 | 89 (5.6%) | 79 (14.4%) |
| $1,000 to $1,499 | 222 (13.9%) | 100 (18.2%) |
| $1,500 to $1,999 | 453 (28.3%) | 99 (18.0%) |
| $2,000 to $2,499 | 304 (19.0%) | 71 (12.9%) |
| $2,500 to $2,999 | 160 (10.0%) | 0 (0.0%) |
| $3,000 or more | 136 (8.5%) | 44 (8.0%) |
| Total | 1,603 (100.0%) | 549 (100.0%) |
Physical Housing Characteristics in Chisago City
Housing Structures in Chisago City
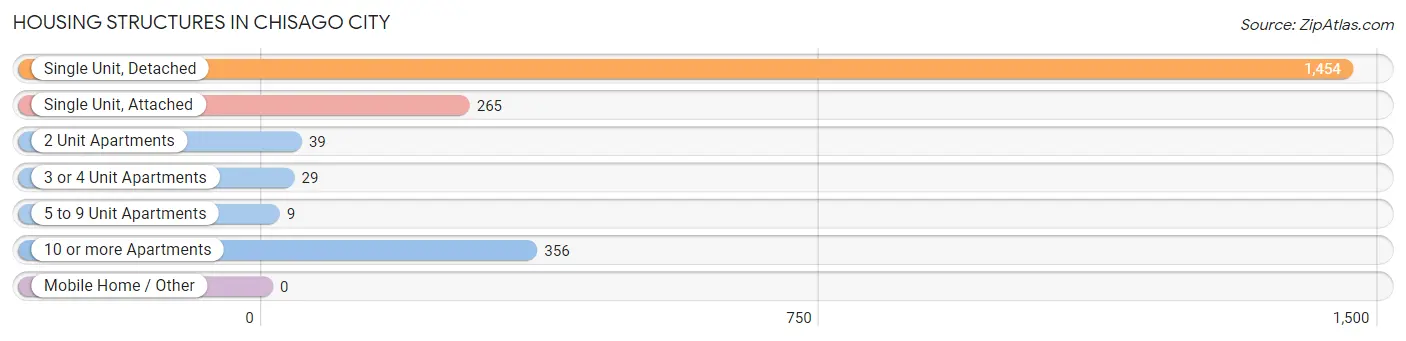
| Structure Type | # Housing Units | % Housing Units |
| Single Unit, Detached | 1,454 | 67.6% |
| Single Unit, Attached | 265 | 12.3% |
| 2 Unit Apartments | 39 | 1.8% |
| 3 or 4 Unit Apartments | 29 | 1.3% |
| 5 to 9 Unit Apartments | 9 | 0.4% |
| 10 or more Apartments | 356 | 16.5% |
| Mobile Home / Other | 0 | 0.0% |
| Total | 2,152 | 100.0% |
Housing Structures by Occupancy in Chisago City
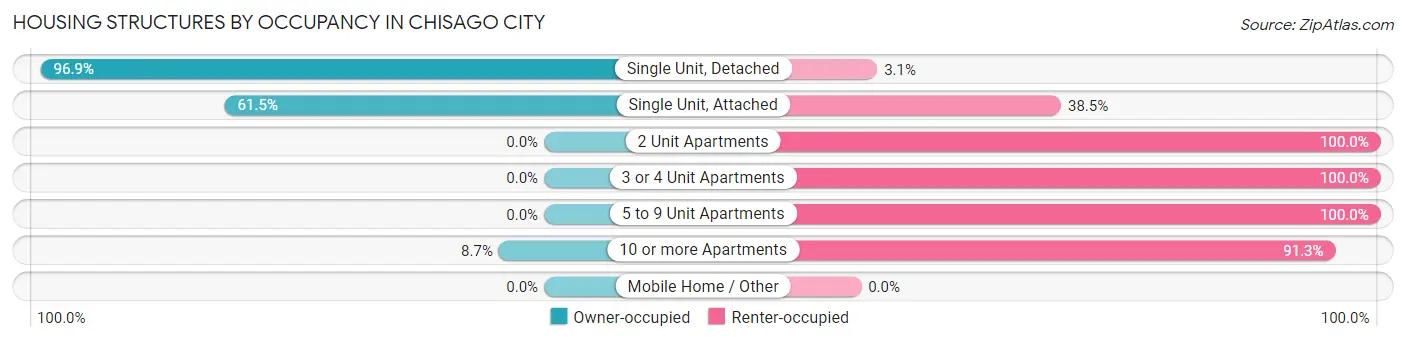
| Structure Type | Owner-occupied | Renter-occupied |
| Single Unit, Detached | 1,409 (96.9%) | 45 (3.1%) |
| Single Unit, Attached | 163 (61.5%) | 102 (38.5%) |
| 2 Unit Apartments | 0 (0.0%) | 39 (100.0%) |
| 3 or 4 Unit Apartments | 0 (0.0%) | 29 (100.0%) |
| 5 to 9 Unit Apartments | 0 (0.0%) | 9 (100.0%) |
| 10 or more Apartments | 31 (8.7%) | 325 (91.3%) |
| Mobile Home / Other | 0 (0.0%) | 0 (0.0%) |
| Total | 1,603 (74.5%) | 549 (25.5%) |
Housing Structures by Number of Rooms in Chisago City
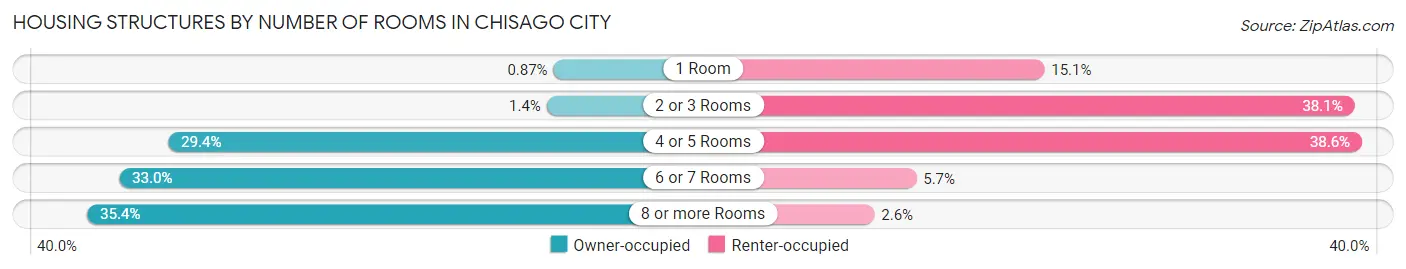
| Number of Rooms | Owner-occupied | Renter-occupied |
| 1 Room | 14 (0.9%) | 83 (15.1%) |
| 2 or 3 Rooms | 22 (1.4%) | 209 (38.1%) |
| 4 or 5 Rooms | 471 (29.4%) | 212 (38.6%) |
| 6 or 7 Rooms | 529 (33.0%) | 31 (5.7%) |
| 8 or more Rooms | 567 (35.4%) | 14 (2.5%) |
| Total | 1,603 (100.0%) | 549 (100.0%) |
Housing Structure by Heating Type in Chisago City
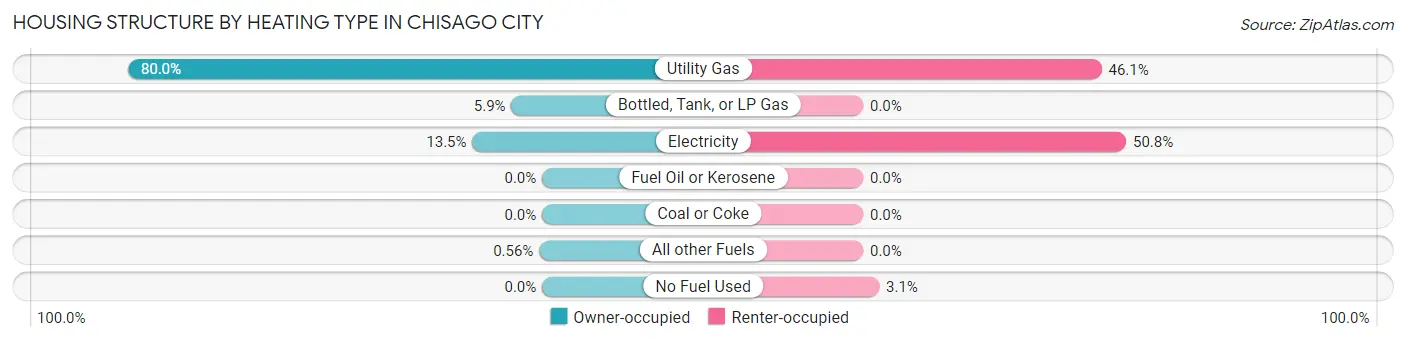
| Heating Type | Owner-occupied | Renter-occupied |
| Utility Gas | 1,283 (80.0%) | 253 (46.1%) |
| Bottled, Tank, or LP Gas | 95 (5.9%) | 0 (0.0%) |
| Electricity | 216 (13.5%) | 279 (50.8%) |
| Fuel Oil or Kerosene | 0 (0.0%) | 0 (0.0%) |
| Coal or Coke | 0 (0.0%) | 0 (0.0%) |
| All other Fuels | 9 (0.6%) | 0 (0.0%) |
| No Fuel Used | 0 (0.0%) | 17 (3.1%) |
| Total | 1,603 (100.0%) | 549 (100.0%) |
Household Vehicle Usage in Chisago City
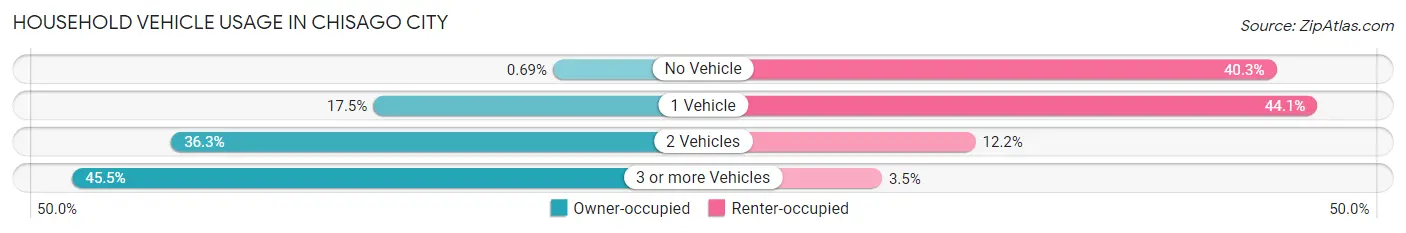
| Vehicles per Household | Owner-occupied | Renter-occupied |
| No Vehicle | 11 (0.7%) | 221 (40.3%) |
| 1 Vehicle | 280 (17.5%) | 242 (44.1%) |
| 2 Vehicles | 582 (36.3%) | 67 (12.2%) |
| 3 or more Vehicles | 730 (45.5%) | 19 (3.5%) |
| Total | 1,603 (100.0%) | 549 (100.0%) |
Real Estate & Mortgages in Chisago City
Real Estate and Mortgage Overview in Chisago City
| Characteristic | Without Mortgage | With Mortgage |
| Housing Units | 400 | 1,203 |
| Median Property Value | $285,800 | $351,900 |
| Median Household Income | $91,250 | $382 |
| Monthly Housing Costs | $751 | $136 |
| Real Estate Taxes | $4,155 | $49 |
Property Value by Mortgage Status in Chisago City
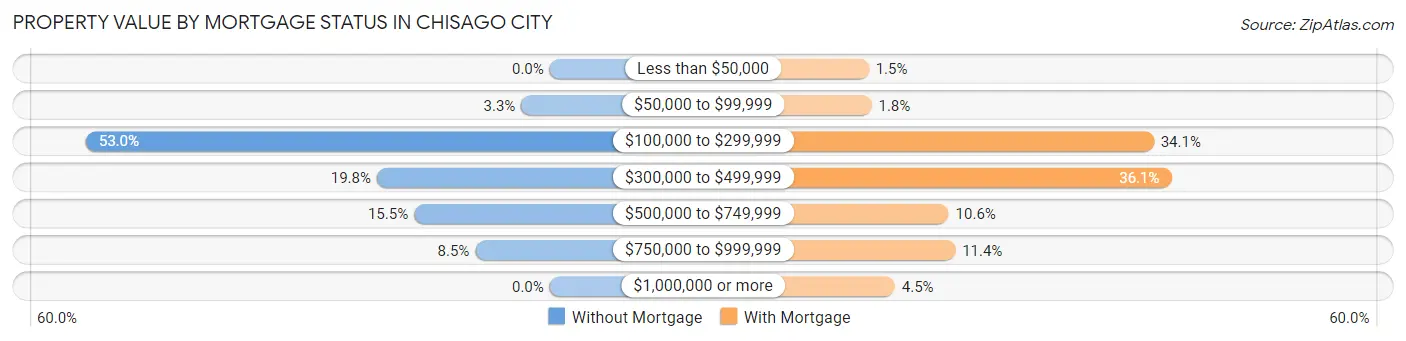
| Property Value | Without Mortgage | With Mortgage |
| Less than $50,000 | 0 (0.0%) | 18 (1.5%) |
| $50,000 to $99,999 | 13 (3.3%) | 22 (1.8%) |
| $100,000 to $299,999 | 212 (53.0%) | 410 (34.1%) |
| $300,000 to $499,999 | 79 (19.8%) | 434 (36.1%) |
| $500,000 to $749,999 | 62 (15.5%) | 128 (10.6%) |
| $750,000 to $999,999 | 34 (8.5%) | 137 (11.4%) |
| $1,000,000 or more | 0 (0.0%) | 54 (4.5%) |
| Total | 400 (100.0%) | 1,203 (100.0%) |
Household Income by Mortgage Status in Chisago City
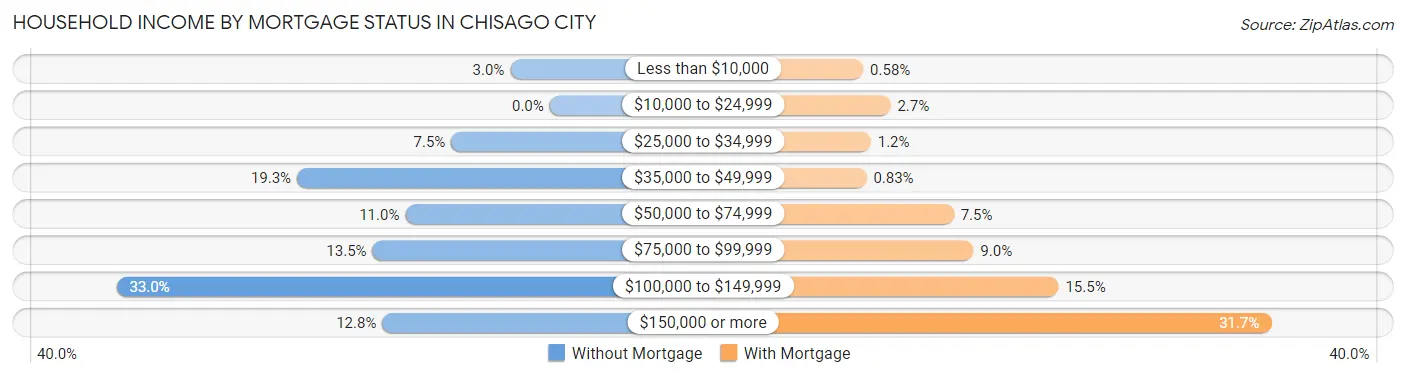
| Household Income | Without Mortgage | With Mortgage |
| Less than $10,000 | 12 (3.0%) | 7 (0.6%) |
| $10,000 to $24,999 | 0 (0.0%) | 32 (2.7%) |
| $25,000 to $34,999 | 30 (7.5%) | 14 (1.2%) |
| $35,000 to $49,999 | 77 (19.3%) | 10 (0.8%) |
| $50,000 to $74,999 | 44 (11.0%) | 90 (7.5%) |
| $75,000 to $99,999 | 54 (13.5%) | 108 (9.0%) |
| $100,000 to $149,999 | 132 (33.0%) | 186 (15.5%) |
| $150,000 or more | 51 (12.8%) | 381 (31.7%) |
| Total | 400 (100.0%) | 1,203 (100.0%) |
Property Value to Household Income Ratio in Chisago City
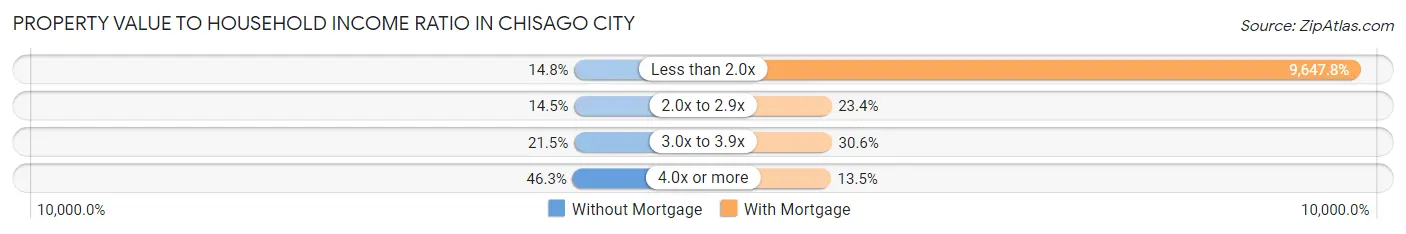
| Value-to-Income Ratio | Without Mortgage | With Mortgage |
| Less than 2.0x | 59 (14.7%) | 116,063 (9,647.8%) |
| 2.0x to 2.9x | 58 (14.5%) | 282 (23.4%) |
| 3.0x to 3.9x | 86 (21.5%) | 368 (30.6%) |
| 4.0x or more | 185 (46.3%) | 162 (13.5%) |
| Total | 400 (100.0%) | 1,203 (100.0%) |
Real Estate Taxes by Mortgage Status in Chisago City
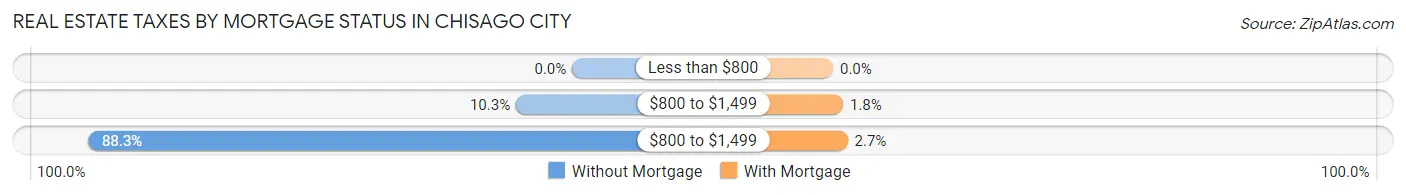
| Property Taxes | Without Mortgage | With Mortgage |
| Less than $800 | 0 (0.0%) | 0 (0.0%) |
| $800 to $1,499 | 41 (10.2%) | 22 (1.8%) |
| $800 to $1,499 | 353 (88.2%) | 32 (2.7%) |
| Total | 400 (100.0%) | 1,203 (100.0%) |
Health & Disability in Chisago City
Health Insurance Coverage by Age in Chisago City
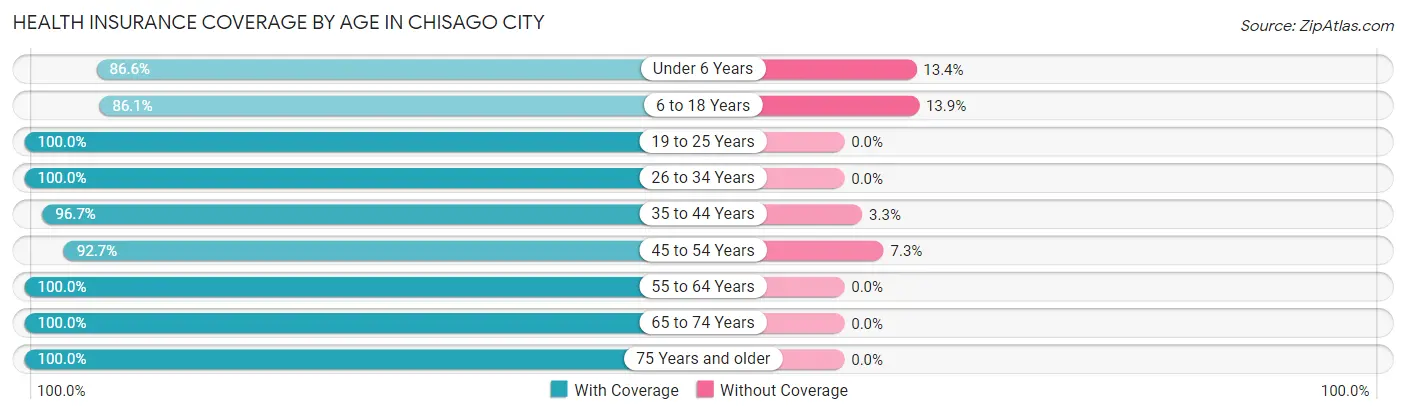
| Age Bracket | With Coverage | Without Coverage |
| Under 6 Years | 425 (86.6%) | 66 (13.4%) |
| 6 to 18 Years | 766 (86.1%) | 124 (13.9%) |
| 19 to 25 Years | 384 (100.0%) | 0 (0.0%) |
| 26 to 34 Years | 560 (100.0%) | 0 (0.0%) |
| 35 to 44 Years | 725 (96.7%) | 25 (3.3%) |
| 45 to 54 Years | 544 (92.7%) | 43 (7.3%) |
| 55 to 64 Years | 462 (100.0%) | 0 (0.0%) |
| 65 to 74 Years | 680 (100.0%) | 0 (0.0%) |
| 75 Years and older | 584 (100.0%) | 0 (0.0%) |
| Total | 5,130 (95.2%) | 258 (4.8%) |
Health Insurance Coverage by Citizenship Status in Chisago City
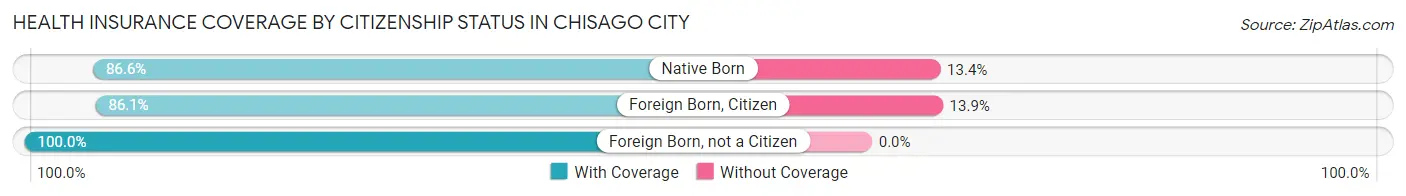
| Citizenship Status | With Coverage | Without Coverage |
| Native Born | 425 (86.6%) | 66 (13.4%) |
| Foreign Born, Citizen | 766 (86.1%) | 124 (13.9%) |
| Foreign Born, not a Citizen | 384 (100.0%) | 0 (0.0%) |
Health Insurance Coverage by Household Income in Chisago City
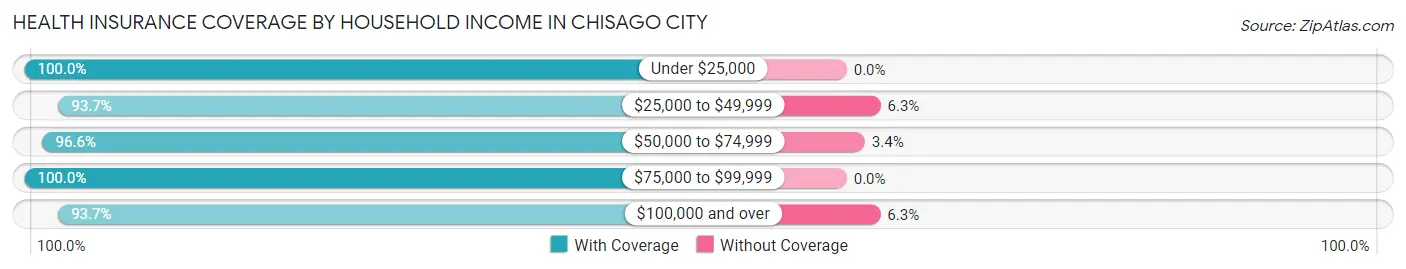
| Household Income | With Coverage | Without Coverage |
| Under $25,000 | 305 (100.0%) | 0 (0.0%) |
| $25,000 to $49,999 | 635 (93.7%) | 43 (6.3%) |
| $50,000 to $74,999 | 427 (96.6%) | 15 (3.4%) |
| $75,000 to $99,999 | 758 (100.0%) | 0 (0.0%) |
| $100,000 and over | 2,975 (93.7%) | 200 (6.3%) |
Public vs Private Health Insurance Coverage by Age in Chisago City
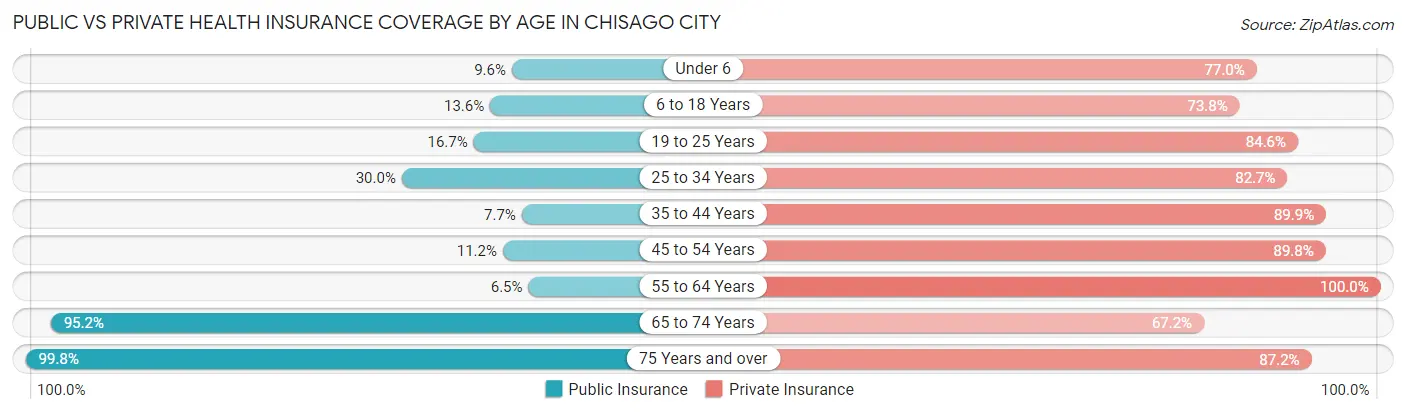
| Age Bracket | Public Insurance | Private Insurance |
| Under 6 | 47 (9.6%) | 378 (77.0%) |
| 6 to 18 Years | 121 (13.6%) | 657 (73.8%) |
| 19 to 25 Years | 64 (16.7%) | 325 (84.6%) |
| 25 to 34 Years | 168 (30.0%) | 463 (82.7%) |
| 35 to 44 Years | 58 (7.7%) | 674 (89.9%) |
| 45 to 54 Years | 66 (11.2%) | 527 (89.8%) |
| 55 to 64 Years | 30 (6.5%) | 462 (100.0%) |
| 65 to 74 Years | 647 (95.2%) | 457 (67.2%) |
| 75 Years and over | 583 (99.8%) | 509 (87.2%) |
| Total | 1,784 (33.1%) | 4,452 (82.6%) |
Disability Status by Sex by Age in Chisago City
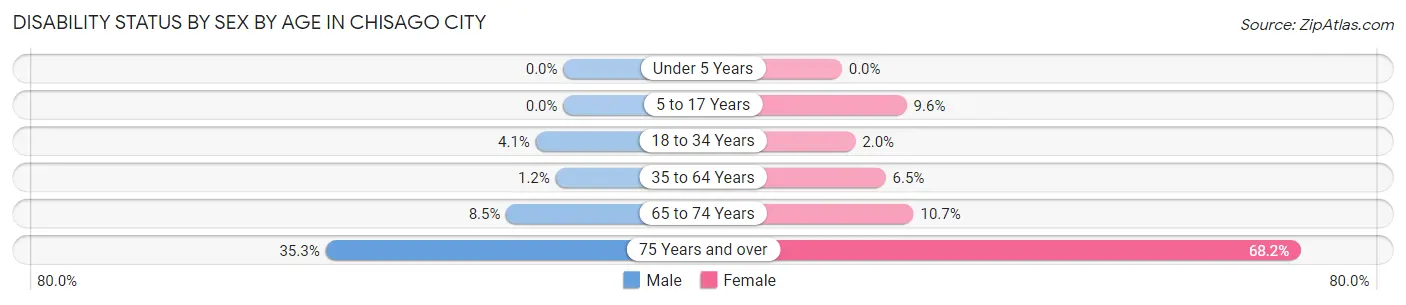
| Age Bracket | Male | Female |
| Under 5 Years | 0 (0.0%) | 0 (0.0%) |
| 5 to 17 Years | 0 (0.0%) | 31 (9.6%) |
| 18 to 34 Years | 22 (4.1%) | 10 (2.0%) |
| 35 to 64 Years | 11 (1.1%) | 55 (6.5%) |
| 65 to 74 Years | 25 (8.5%) | 41 (10.6%) |
| 75 Years and over | 83 (35.3%) | 238 (68.2%) |
Disability Class by Sex by Age in Chisago City
Disability Class: Hearing Difficulty
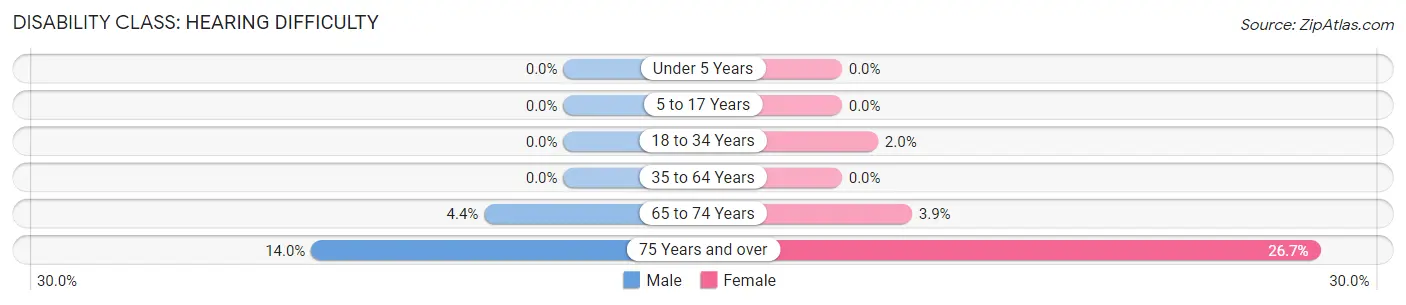
| Age Bracket | Male | Female |
| Under 5 Years | 0 (0.0%) | 0 (0.0%) |
| 5 to 17 Years | 0 (0.0%) | 0 (0.0%) |
| 18 to 34 Years | 0 (0.0%) | 10 (2.0%) |
| 35 to 64 Years | 0 (0.0%) | 0 (0.0%) |
| 65 to 74 Years | 13 (4.4%) | 15 (3.9%) |
| 75 Years and over | 33 (14.0%) | 93 (26.7%) |
Disability Class: Vision Difficulty
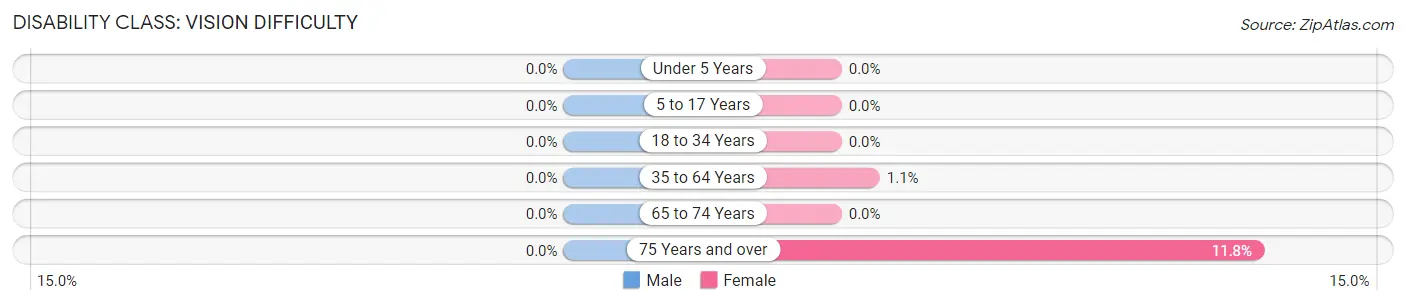
| Age Bracket | Male | Female |
| Under 5 Years | 0 (0.0%) | 0 (0.0%) |
| 5 to 17 Years | 0 (0.0%) | 0 (0.0%) |
| 18 to 34 Years | 0 (0.0%) | 0 (0.0%) |
| 35 to 64 Years | 0 (0.0%) | 9 (1.1%) |
| 65 to 74 Years | 0 (0.0%) | 0 (0.0%) |
| 75 Years and over | 0 (0.0%) | 41 (11.7%) |
Disability Class: Cognitive Difficulty
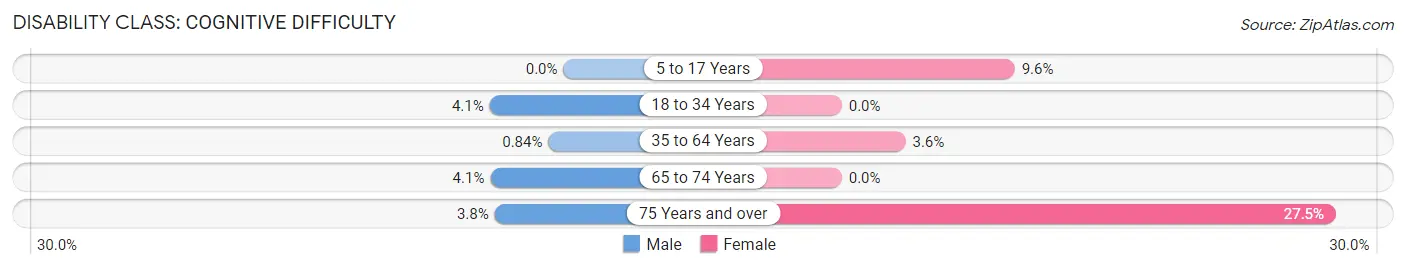
| Age Bracket | Male | Female |
| 5 to 17 Years | 0 (0.0%) | 31 (9.6%) |
| 18 to 34 Years | 22 (4.1%) | 0 (0.0%) |
| 35 to 64 Years | 8 (0.8%) | 30 (3.5%) |
| 65 to 74 Years | 12 (4.1%) | 0 (0.0%) |
| 75 Years and over | 9 (3.8%) | 96 (27.5%) |
Disability Class: Ambulatory Difficulty
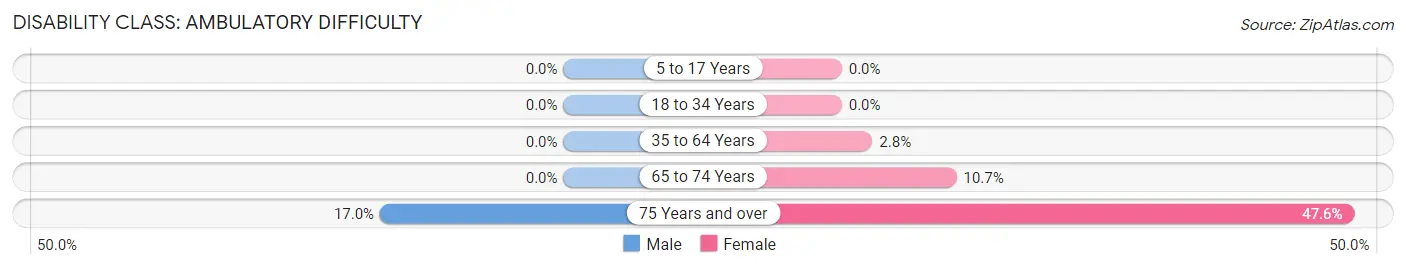
| Age Bracket | Male | Female |
| 5 to 17 Years | 0 (0.0%) | 0 (0.0%) |
| 18 to 34 Years | 0 (0.0%) | 0 (0.0%) |
| 35 to 64 Years | 0 (0.0%) | 24 (2.8%) |
| 65 to 74 Years | 0 (0.0%) | 41 (10.6%) |
| 75 Years and over | 40 (17.0%) | 166 (47.6%) |
Disability Class: Self-Care Difficulty
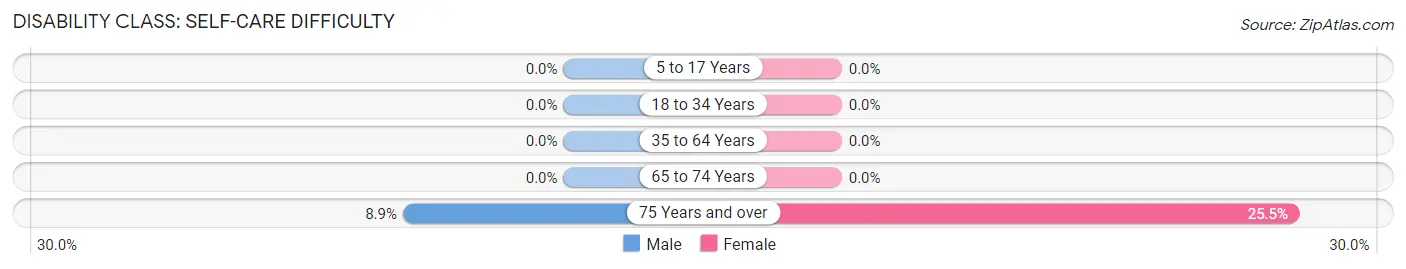
| Age Bracket | Male | Female |
| 5 to 17 Years | 0 (0.0%) | 0 (0.0%) |
| 18 to 34 Years | 0 (0.0%) | 0 (0.0%) |
| 35 to 64 Years | 0 (0.0%) | 0 (0.0%) |
| 65 to 74 Years | 0 (0.0%) | 0 (0.0%) |
| 75 Years and over | 21 (8.9%) | 89 (25.5%) |
Technology Access in Chisago City
Computing Device Access in Chisago City
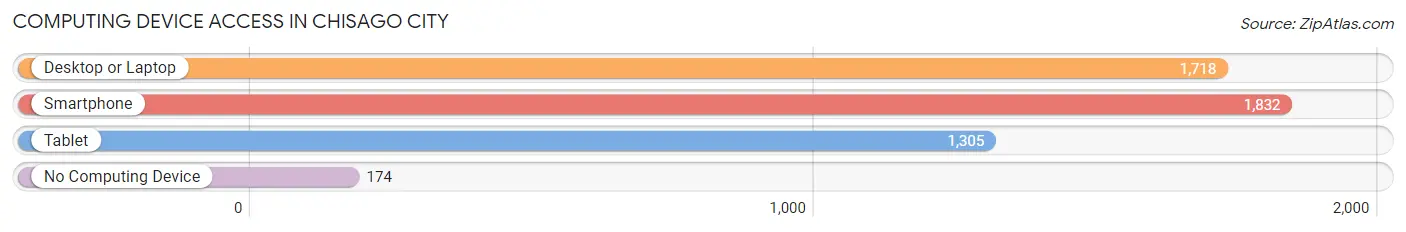
| Device Type | # Households | % Households |
| Desktop or Laptop | 1,718 | 79.8% |
| Smartphone | 1,832 | 85.1% |
| Tablet | 1,305 | 60.6% |
| No Computing Device | 174 | 8.1% |
| Total | 2,152 | 100.0% |
Internet Access in Chisago City
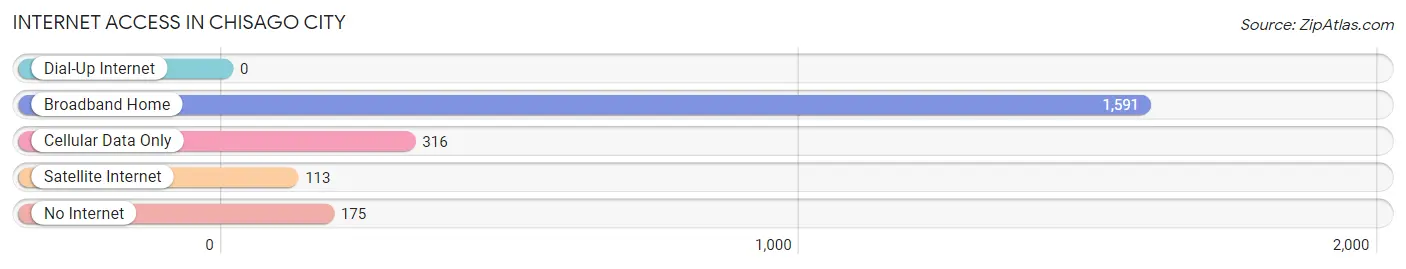
| Internet Type | # Households | % Households |
| Dial-Up Internet | 0 | 0.0% |
| Broadband Home | 1,591 | 73.9% |
| Cellular Data Only | 316 | 14.7% |
| Satellite Internet | 113 | 5.2% |
| No Internet | 175 | 8.1% |
| Total | 2,152 | 100.0% |
Chisago City Summary
Chisago City is a small city located in Chisago County, Minnesota, United States. It is situated on the western edge of the Twin Cities metropolitan area, approximately 40 miles northeast of Minneapolis. The city is part of the larger Chisago Lakes area, which includes the cities of Lindstrom, Center City, Shafer, and Taylors Falls. As of the 2010 census, the city had a population of 5,081.
History
The area that is now Chisago City was first settled in the mid-1800s by Swedish immigrants. The city was originally known as Chisago Lake Station, and was a stop on the St. Paul and Duluth Railroad. The city was officially incorporated in 1891, and the name was changed to Chisago City in 1895.
In the early 1900s, the city was a popular tourist destination, with many visitors coming to enjoy the lakes and the surrounding countryside. The city was also home to a number of resorts, including the Chisago Lake Hotel, which was built in 1906 and operated until the 1950s.
Geography
Chisago City is located at 45°20'N, 92°48'W (45.33, -92.80). According to the United States Census Bureau, the city has a total area of 4.2 square miles (10.8 km2), of which 4.1 square miles (10.6 km2) is land and 0.1 square mile (0.2 km2) is water.
The city is located on the western edge of the Twin Cities metropolitan area, approximately 40 miles northeast of Minneapolis. The city is part of the larger Chisago Lakes area, which includes the cities of Lindstrom, Center City, Shafer, and Taylors Falls.
Economy
Chisago City is a small city with a limited economy. The city is home to a number of small businesses, including restaurants, retail stores, and professional services. The city is also home to a number of manufacturing companies, including a plastics manufacturer and a metal fabrication company.
The city is also home to a number of tourist attractions, including the Chisago Lakes State Park, which offers camping, fishing, and other outdoor activities. The city is also home to a number of golf courses, including the Chisago Lakes Golf Course.
Demographics
As of the 2010 census, there were 5,081 people, 1,945 households, and 1,346 families residing in the city. The population density was 1,228.3 people per square mile (474.2/km2). There were 2,072 housing units at an average density of 505.2 per square mile (195.2/km2). The racial makeup of the city was 95.2% White, 0.7% African American, 0.3% Native American, 0.7% Asian, 0.1% Pacific Islander, 1.3% from other races, and 1.7% from two or more races. Hispanic or Latino of any race were 3.2% of the population.
There were 1,945 households, out of which 33.2% had children under the age of 18 living with them, 54.2% were married couples living together, 10.2% had a female householder with no husband present, and 30.7% were non-families. 25.2% of all households were made up of individuals, and 10.2% had someone living alone who was 65 years of age or older. The average household size was 2.60 and the average family size was 3.13.
In the city, the population was spread out, with 25.9% under the age of 18, 7.2% from 18 to 24, 28.2% from 25 to 44, 24.2% from 45 to 64, and 14.5% who were 65 years of age or older. The median age was 38 years. For every 100 females, there were 97.2 males. For every 100 females age 18 and over, there were 94.2 males.
The median income for a household in the city was $50,938, and the median income for a family was $60,938. Males had a median income of $41,938 versus $30,938 for females. The per capita income for the city was $23,938. About 4.2% of families and 5.7% of the population were below the poverty line, including 6.7% of those under age 18 and 5.2% of those age 65 or over.
Common Questions
What is Per Capita Income in Chisago City?
Per Capita income in Chisago City is $42,356.
What is the Median Family Income in Chisago City?
Median Family Income in Chisago City is $111,117.
What is the Median Household income in Chisago City?
Median Household Income in Chisago City is $92,278.
What is Income or Wage Gap in Chisago City?
Income or Wage Gap in Chisago City is 20.9%.
Women in Chisago City earn 79.1 cents for every dollar earned by a man.
What is Inequality or Gini Index in Chisago City?
Inequality or Gini Index in Chisago City is 0.40.
What is the Total Population of Chisago City?
Total Population of Chisago City is 5,576.
What is the Total Male Population of Chisago City?
Total Male Population of Chisago City is 2,784.
What is the Total Female Population of Chisago City?
Total Female Population of Chisago City is 2,792.
What is the Ratio of Males per 100 Females in Chisago City?
There are 99.71 Males per 100 Females in Chisago City.
What is the Ratio of Females per 100 Males in Chisago City?
There are 100.29 Females per 100 Males in Chisago City.
What is the Median Population Age in Chisago City?
Median Population Age in Chisago City is 40.7 Years.
What is the Average Family Size in Chisago City
Average Family Size in Chisago City is 3.0 People.
What is the Average Household Size in Chisago City
Average Household Size in Chisago City is 2.5 People.
How Large is the Labor Force in Chisago City?
There are 2,745 People in the Labor Forcein in Chisago City.
What is the Percentage of People in the Labor Force in Chisago City?
61.8% of People are in the Labor Force in Chisago City.
What is the Unemployment Rate in Chisago City?
Unemployment Rate in Chisago City is 4.0%.