Cities with the Most Immigrants from Jamaica in Minnesota
RELATED REPORTS & OPTIONS
Jamaica
Minnesota
Compare Cities
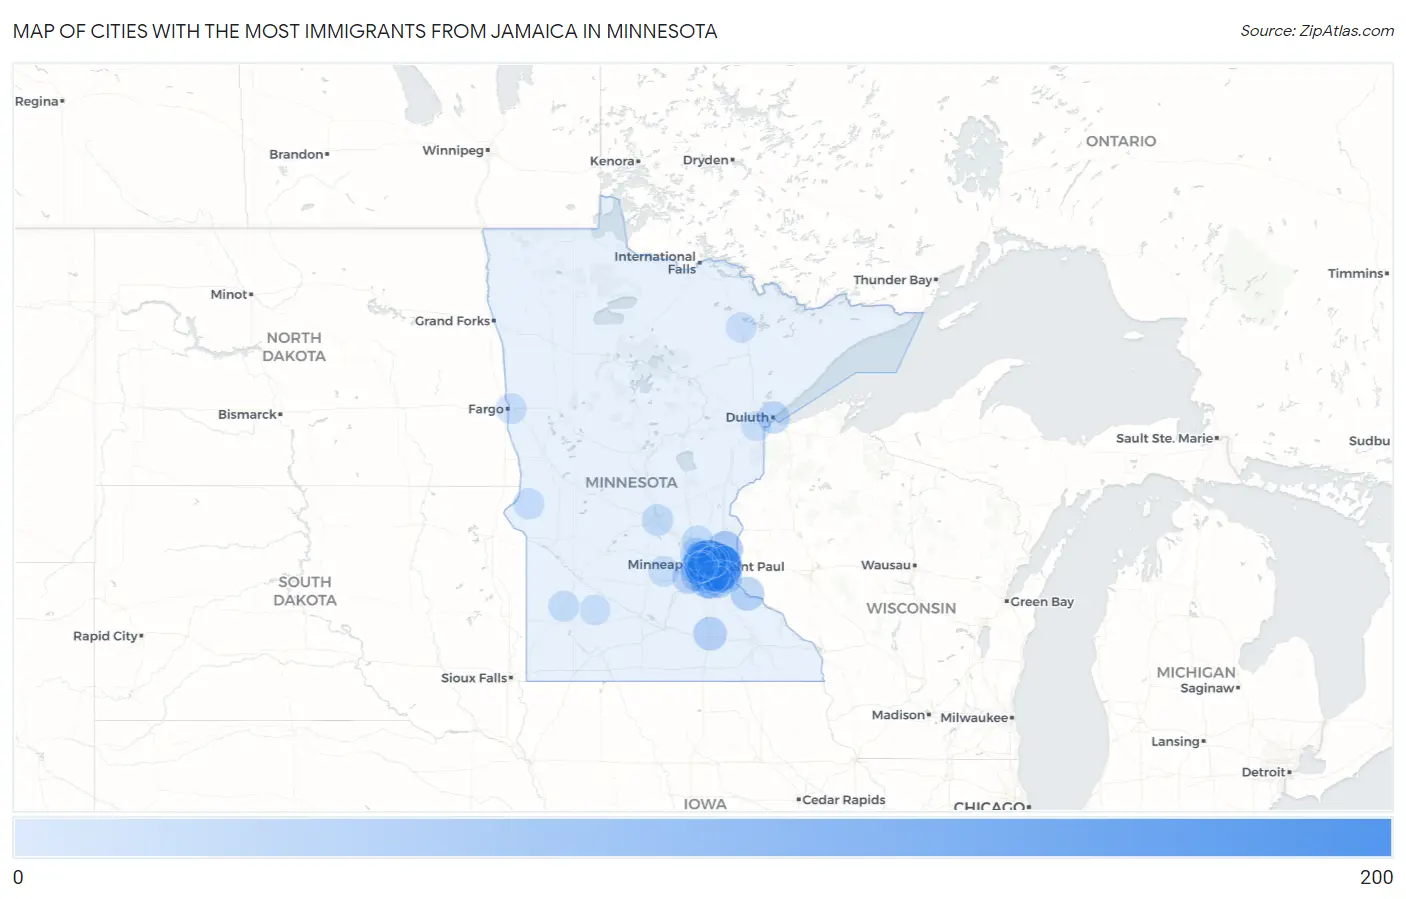
Map of Cities with the Most Immigrants from Jamaica in Minnesota
0
200
Cities with the Most Immigrants from Jamaica in Minnesota
| City | Jamaica | vs State | vs National | |
| 1. | Minneapolis | 166 | 934(17.77%)#1 | 785,998(0.02%)#461 |
| 2. | St Paul | 156 | 934(16.70%)#2 | 785,998(0.02%)#491 |
| 3. | Burnsville | 52 | 934(5.57%)#3 | 785,998(0.01%)#1,133 |
| 4. | Hugo | 44 | 934(4.71%)#4 | 785,998(0.01%)#1,253 |
| 5. | New Hope | 41 | 934(4.39%)#5 | 785,998(0.01%)#1,298 |
| 6. | Bloomington | 34 | 934(3.64%)#6 | 785,998(0.00%)#1,427 |
| 7. | Red Wing | 30 | 934(3.21%)#7 | 785,998(0.00%)#1,531 |
| 8. | Owatonna | 28 | 934(3.00%)#8 | 785,998(0.00%)#1,578 |
| 9. | Edina | 27 | 934(2.89%)#9 | 785,998(0.00%)#1,612 |
| 10. | Oakdale | 27 | 934(2.89%)#10 | 785,998(0.00%)#1,617 |
| 11. | Eden Prairie | 26 | 934(2.78%)#11 | 785,998(0.00%)#1,639 |
| 12. | Apple Valley | 25 | 934(2.68%)#12 | 785,998(0.00%)#1,669 |
| 13. | Minnetonka | 22 | 934(2.36%)#13 | 785,998(0.00%)#1,758 |
| 14. | Inver Grove Heights | 21 | 934(2.25%)#14 | 785,998(0.00%)#1,798 |
| 15. | Chaska | 21 | 934(2.25%)#15 | 785,998(0.00%)#1,804 |
| 16. | Cottage Grove | 20 | 934(2.14%)#16 | 785,998(0.00%)#1,845 |
| 17. | Duluth | 18 | 934(1.93%)#17 | 785,998(0.00%)#1,924 |
| 18. | Maple Grove | 18 | 934(1.93%)#18 | 785,998(0.00%)#1,928 |
| 19. | Robbinsdale | 13 | 934(1.39%)#19 | 785,998(0.00%)#2,167 |
| 20. | St Cloud | 12 | 934(1.28%)#20 | 785,998(0.00%)#2,205 |
| 21. | Roseville | 11 | 934(1.18%)#21 | 785,998(0.00%)#2,267 |
| 22. | Ramsey | 11 | 934(1.18%)#22 | 785,998(0.00%)#2,271 |
| 23. | Rosemount | 10 | 934(1.07%)#23 | 785,998(0.00%)#2,345 |
| 24. | Eagan | 8 | 934(0.86%)#24 | 785,998(0.00%)#2,475 |
| 25. | Lauderdale | 8 | 934(0.86%)#25 | 785,998(0.00%)#2,530 |
| 26. | Dumont | 8 | 934(0.86%)#26 | 785,998(0.00%)#2,548 |
| 27. | Marshall | 7 | 934(0.75%)#27 | 785,998(0.00%)#2,578 |
| 28. | Moorhead | 6 | 934(0.64%)#28 | 785,998(0.00%)#2,627 |
| 29. | St Louis Park | 5 | 934(0.54%)#29 | 785,998(0.00%)#2,684 |
| 30. | Lester Prairie | 5 | 934(0.54%)#30 | 785,998(0.00%)#2,729 |
| 31. | Wabasso | 5 | 934(0.54%)#31 | 785,998(0.00%)#2,748 |
| 32. | Cook | 3 | 934(0.32%)#32 | 785,998(0.00%)#2,870 |
| 33. | Hopkins | 1 | 934(0.11%)#33 | 785,998(0.00%)#2,959 |
| 34. | Carlton | 1 | 934(0.11%)#34 | 785,998(0.00%)#3,000 |
Common Questions
What are the Top 10 Cities with the Most Immigrants from Jamaica in Minnesota?
Top 10 Cities with the Most Immigrants from Jamaica in Minnesota are:
#1
166
#2
156
#3
52
#4
44
#5
41
#6
34
#7
30
#8
28
#9
27
#10
27
What city has the Most Immigrants from Jamaica in Minnesota?
Minneapolis has the Most Immigrants from Jamaica in Minnesota with 166.
What is the Total Immigrants from Jamaica in the State of Minnesota?
Total Immigrants from Jamaica in Minnesota is 934.
What is the Total Immigrants from Jamaica in the United States?
Total Immigrants from Jamaica in the United States is 785,998.