Cities with the Highest Percentage of African Population in Minnesota
RELATED REPORTS & OPTIONS
African
Minnesota
Compare Cities
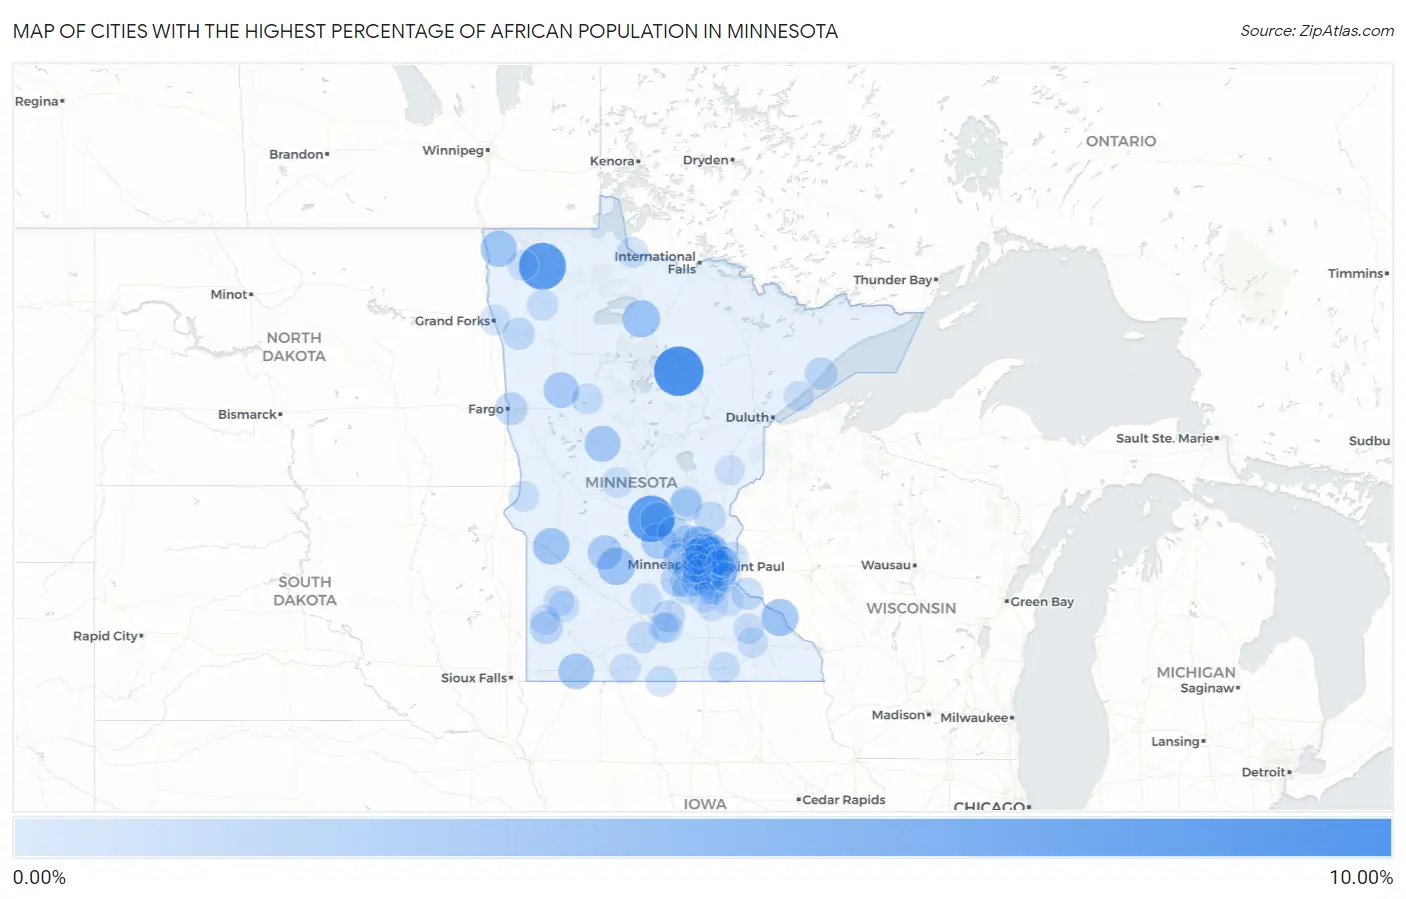
Map of Cities with the Highest Percentage of African Population in Minnesota
0.00%
10.00%
Cities with the Highest Percentage of African Population in Minnesota
| City | African | vs State | vs National | |
| 1. | Zemple | 8.85% | 0.58%(+8.27)#1 | 0.57%(+8.28)#124 |
| 2. | Strathcona | 7.69% | 0.58%(+7.12)#2 | 0.57%(+7.13)#170 |
| 3. | Waite Park | 7.37% | 0.58%(+6.79)#3 | 0.57%(+6.80)#179 |
| 4. | Lake Lillian | 3.48% | 0.58%(+2.91)#4 | 0.57%(+2.92)#514 |
| 5. | Kelliher | 3.41% | 0.58%(+2.83)#5 | 0.57%(+2.84)#520 |
| 6. | Brooklyn Park | 3.38% | 0.58%(+2.80)#6 | 0.57%(+2.81)#527 |
| 7. | Kellogg | 3.26% | 0.58%(+2.69)#7 | 0.57%(+2.70)#549 |
| 8. | Hilltop | 3.08% | 0.58%(+2.51)#8 | 0.57%(+2.52)#603 |
| 9. | Appleton | 3.05% | 0.58%(+2.47)#9 | 0.57%(+2.48)#612 |
| 10. | Hallock | 3.00% | 0.58%(+2.42)#10 | 0.57%(+2.43)#627 |
| 11. | Anoka | 2.95% | 0.58%(+2.37)#11 | 0.57%(+2.39)#646 |
| 12. | Wadena | 2.80% | 0.58%(+2.22)#12 | 0.57%(+2.23)#686 |
| 13. | Worthington | 2.75% | 0.58%(+2.18)#13 | 0.57%(+2.19)#698 |
| 14. | White Earth | 2.59% | 0.58%(+2.01)#14 | 0.57%(+2.03)#752 |
| 15. | Annandale | 2.54% | 0.58%(+1.96)#15 | 0.57%(+1.97)#775 |
| 16. | St Cloud | 2.42% | 0.58%(+1.85)#16 | 0.57%(+1.86)#812 |
| 17. | Fridley | 2.26% | 0.58%(+1.69)#17 | 0.57%(+1.70)#873 |
| 18. | Willmar | 2.26% | 0.58%(+1.68)#18 | 0.57%(+1.69)#878 |
| 19. | Mounds View | 1.97% | 0.58%(+1.39)#19 | 0.57%(+1.40)#1,042 |
| 20. | Brooklyn Center | 1.92% | 0.58%(+1.34)#20 | 0.57%(+1.35)#1,080 |
| 21. | New Hope | 1.89% | 0.58%(+1.31)#21 | 0.57%(+1.33)#1,095 |
| 22. | Cologne | 1.73% | 0.58%(+1.15)#22 | 0.57%(+1.16)#1,201 |
| 23. | Hopkins | 1.64% | 0.58%(+1.06)#23 | 0.57%(+1.07)#1,292 |
| 24. | Apple Valley | 1.64% | 0.58%(+1.06)#24 | 0.57%(+1.07)#1,294 |
| 25. | Bloomington | 1.61% | 0.58%(+1.04)#25 | 0.57%(+1.05)#1,311 |
| 26. | Ruthton | 1.50% | 0.58%(+0.923)#26 | 0.57%(+0.935)#1,407 |
| 27. | St Anthony City Hennepin And Ramsey Counties | 1.40% | 0.58%(+0.827)#27 | 0.57%(+0.838)#1,532 |
| 28. | Moorhead | 1.40% | 0.58%(+0.818)#28 | 0.57%(+0.830)#1,550 |
| 29. | Silver Bay | 1.36% | 0.58%(+0.784)#29 | 0.57%(+0.796)#1,589 |
| 30. | Pease | 1.36% | 0.58%(+0.780)#30 | 0.57%(+0.792)#1,591 |
| 31. | Carver | 1.34% | 0.58%(+0.767)#31 | 0.57%(+0.778)#1,607 |
| 32. | New Brighton | 1.31% | 0.58%(+0.728)#32 | 0.57%(+0.740)#1,668 |
| 33. | Richfield | 1.30% | 0.58%(+0.724)#33 | 0.57%(+0.736)#1,678 |
| 34. | South St Paul | 1.27% | 0.58%(+0.695)#34 | 0.57%(+0.707)#1,720 |
| 35. | St Paul | 1.25% | 0.58%(+0.677)#35 | 0.57%(+0.689)#1,743 |
| 36. | St Peter | 1.23% | 0.58%(+0.652)#36 | 0.57%(+0.664)#1,775 |
| 37. | Rockford | 1.21% | 0.58%(+0.630)#37 | 0.57%(+0.642)#1,801 |
| 38. | Red Wing | 1.18% | 0.58%(+0.602)#38 | 0.57%(+0.613)#1,837 |
| 39. | Crookston | 1.18% | 0.58%(+0.601)#39 | 0.57%(+0.612)#1,838 |
| 40. | Columbia Heights | 1.16% | 0.58%(+0.587)#40 | 0.57%(+0.599)#1,863 |
| 41. | Burnsville | 1.16% | 0.58%(+0.579)#41 | 0.57%(+0.591)#1,870 |
| 42. | Otsego | 1.14% | 0.58%(+0.562)#42 | 0.57%(+0.574)#1,894 |
| 43. | Becker | 1.10% | 0.58%(+0.526)#43 | 0.57%(+0.537)#1,963 |
| 44. | Cambridge | 1.04% | 0.58%(+0.461)#44 | 0.57%(+0.473)#2,069 |
| 45. | Crystal | 1.04% | 0.58%(+0.460)#45 | 0.57%(+0.471)#2,074 |
| 46. | St. John's University | 1.03% | 0.58%(+0.458)#46 | 0.57%(+0.469)#2,077 |
| 47. | Coon Rapids | 0.99% | 0.58%(+0.409)#47 | 0.57%(+0.420)#2,163 |
| 48. | Minneapolis | 0.98% | 0.58%(+0.403)#48 | 0.57%(+0.414)#2,175 |
| 49. | Spring Lake Park | 0.90% | 0.58%(+0.327)#49 | 0.57%(+0.339)#2,335 |
| 50. | Stillwater | 0.90% | 0.58%(+0.318)#50 | 0.57%(+0.330)#2,355 |
| 51. | Eagan | 0.84% | 0.58%(+0.258)#51 | 0.57%(+0.270)#2,495 |
| 52. | Jordan | 0.83% | 0.58%(+0.250)#52 | 0.57%(+0.262)#2,514 |
| 53. | Madelia | 0.81% | 0.58%(+0.231)#53 | 0.57%(+0.242)#2,560 |
| 54. | Baudette | 0.80% | 0.58%(+0.220)#54 | 0.57%(+0.232)#2,591 |
| 55. | Ramsey | 0.80% | 0.58%(+0.219)#55 | 0.57%(+0.230)#2,598 |
| 56. | Lexington | 0.78% | 0.58%(+0.199)#56 | 0.57%(+0.211)#2,661 |
| 57. | Winthrop | 0.77% | 0.58%(+0.194)#57 | 0.57%(+0.206)#2,674 |
| 58. | Austin | 0.76% | 0.58%(+0.187)#58 | 0.57%(+0.199)#2,702 |
| 59. | Delano | 0.76% | 0.58%(+0.187)#59 | 0.57%(+0.199)#2,703 |
| 60. | Mankato | 0.76% | 0.58%(+0.181)#60 | 0.57%(+0.193)#2,719 |
| 61. | Thief River Falls | 0.74% | 0.58%(+0.167)#61 | 0.57%(+0.179)#2,760 |
| 62. | Falcon Heights | 0.73% | 0.58%(+0.149)#62 | 0.57%(+0.161)#2,806 |
| 63. | Robbinsdale | 0.72% | 0.58%(+0.142)#63 | 0.57%(+0.154)#2,818 |
| 64. | Lakeville | 0.72% | 0.58%(+0.140)#64 | 0.57%(+0.152)#2,829 |
| 65. | Oakdale | 0.72% | 0.58%(+0.140)#65 | 0.57%(+0.152)#2,830 |
| 66. | Roseville | 0.71% | 0.58%(+0.135)#66 | 0.57%(+0.147)#2,851 |
| 67. | Marshall | 0.71% | 0.58%(+0.134)#67 | 0.57%(+0.145)#2,855 |
| 68. | Blaine | 0.71% | 0.58%(+0.131)#68 | 0.57%(+0.143)#2,865 |
| 69. | Pine Point | 0.70% | 0.58%(+0.125)#69 | 0.57%(+0.136)#2,882 |
| 70. | Inver Grove Heights | 0.70% | 0.58%(+0.118)#70 | 0.57%(+0.130)#2,897 |
| 71. | Milaca | 0.69% | 0.58%(+0.116)#71 | 0.57%(+0.127)#2,908 |
| 72. | Elmore | 0.69% | 0.58%(+0.111)#72 | 0.57%(+0.123)#2,924 |
| 73. | Ghent | 0.66% | 0.58%(+0.079)#73 | 0.57%(+0.091)#3,025 |
| 74. | Long Prairie | 0.63% | 0.58%(+0.051)#74 | 0.57%(+0.063)#3,126 |
| 75. | Rochester | 0.62% | 0.58%(+0.043)#75 | 0.57%(+0.055)#3,152 |
| 76. | Maple Grove | 0.62% | 0.58%(+0.042)#76 | 0.57%(+0.054)#3,161 |
| 77. | Karlstad | 0.60% | 0.58%(+0.027)#77 | 0.57%(+0.039)#3,219 |
| 78. | Little Canada | 0.60% | 0.58%(+0.025)#78 | 0.57%(+0.037)#3,228 |
| 79. | Wheaton | 0.60% | 0.58%(+0.019)#79 | 0.57%(+0.031)#3,247 |
| 80. | Oronoco | 0.59% | 0.58%(+0.012)#80 | 0.57%(+0.024)#3,278 |
| 81. | Sherburn | 0.58% | 0.58%(+0.003)#81 | 0.57%(+0.014)#3,317 |
| 82. | Spring Park | 0.57% | 0.58%(-0.004)#82 | 0.57%(+0.008)#3,341 |
| 83. | East Grand Forks | 0.55% | 0.58%(-0.029)#83 | 0.57%(-0.017)#3,443 |
| 84. | Shakopee | 0.55% | 0.58%(-0.029)#84 | 0.57%(-0.017)#3,445 |
| 85. | North Mankato | 0.53% | 0.58%(-0.050)#85 | 0.57%(-0.039)#3,523 |
| 86. | Two Harbors | 0.50% | 0.58%(-0.080)#86 | 0.57%(-0.068)#3,648 |
| 87. | Edina | 0.49% | 0.58%(-0.091)#87 | 0.57%(-0.079)#3,704 |
| 88. | Tyler | 0.48% | 0.58%(-0.097)#88 | 0.57%(-0.086)#3,739 |
| 89. | Eden Prairie | 0.46% | 0.58%(-0.113)#89 | 0.57%(-0.102)#3,832 |
| 90. | Elko New Market | 0.45% | 0.58%(-0.124)#90 | 0.57%(-0.112)#3,870 |
| 91. | Minnetonka | 0.44% | 0.58%(-0.134)#91 | 0.57%(-0.123)#3,924 |
| 92. | Northfield | 0.42% | 0.58%(-0.153)#92 | 0.57%(-0.141)#4,035 |
| 93. | Osseo | 0.38% | 0.58%(-0.198)#93 | 0.57%(-0.186)#4,256 |
| 94. | Farmington | 0.37% | 0.58%(-0.211)#94 | 0.57%(-0.199)#4,322 |
| 95. | Cottage Grove | 0.36% | 0.58%(-0.213)#95 | 0.57%(-0.201)#4,333 |
| 96. | Plymouth | 0.34% | 0.58%(-0.242)#96 | 0.57%(-0.230)#4,505 |
| 97. | Cannon Falls | 0.33% | 0.58%(-0.245)#97 | 0.57%(-0.233)#4,515 |
| 98. | Maplewood | 0.33% | 0.58%(-0.246)#98 | 0.57%(-0.234)#4,526 |
| 99. | Sandstone | 0.31% | 0.58%(-0.265)#99 | 0.57%(-0.254)#4,632 |
| 100. | North St Paul | 0.30% | 0.58%(-0.272)#100 | 0.57%(-0.261)#4,675 |
Common Questions
What are the Top 10 Cities with the Highest Percentage of African Population in Minnesota?
Top 10 Cities with the Highest Percentage of African Population in Minnesota are:
#1
8.85%
#2
7.69%
#3
7.37%
#4
3.48%
#5
3.41%
#6
3.38%
#7
3.26%
#8
3.08%
#9
3.05%
#10
3.00%
What city has the Highest Percentage of African Population in Minnesota?
Zemple has the Highest Percentage of African Population in Minnesota with 8.85%.
What is the Percentage of African Population in the State of Minnesota?
Percentage of African Population in Minnesota is 0.58%.
What is the Percentage of African Population in the United States?
Percentage of African Population in the United States is 0.57%.