Wabasha, MN Map & Demographics
Wabasha Map
Wabasha Overview
$41,276
PER CAPITA INCOME
$85,677
AVG FAMILY INCOME
$60,893
AVG HOUSEHOLD INCOME
30.6%
WAGE / INCOME GAP [ % ]
69.4¢/ $1
WAGE / INCOME GAP [ $ ]
$9,193
FAMILY INCOME DEFICIT
0.41
INEQUALITY / GINI INDEX
2,560
TOTAL POPULATION
1,280
MALE POPULATION
1,280
FEMALE POPULATION
100.00
MALES / 100 FEMALES
100.00
FEMALES / 100 MALES
53.9
MEDIAN AGE
2.5
AVG FAMILY SIZE
1.9
AVG HOUSEHOLD SIZE
1,180
LABOR FORCE [ PEOPLE ]
52.3%
PERCENT IN LABOR FORCE
3.8%
UNEMPLOYMENT RATE
Wabasha Zip Codes
Wabasha Area Codes
Income in Wabasha
Income Overview in Wabasha
Per Capita Income in Wabasha is $41,276, while median incomes of families and households are $85,677 and $60,893 respectively.
| Characteristic | Number | Measure |
| Per Capita Income | 2,560 | $41,276 |
| Median Family Income | 687 | $85,677 |
| Mean Family Income | 687 | $106,481 |
| Median Household Income | 1,238 | $60,893 |
| Mean Household Income | 1,238 | $82,123 |
| Income Deficit | 687 | $9,193 |
| Wage / Income Gap (%) | 2,560 | 30.61% |
| Wage / Income Gap ($) | 2,560 | 69.39¢ per $1 |
| Gini / Inequality Index | 2,560 | 0.41 |
Earnings by Sex in Wabasha
Average Earnings in Wabasha are $37,941, $47,813 for men and $33,177 for women, a difference of 30.6%.
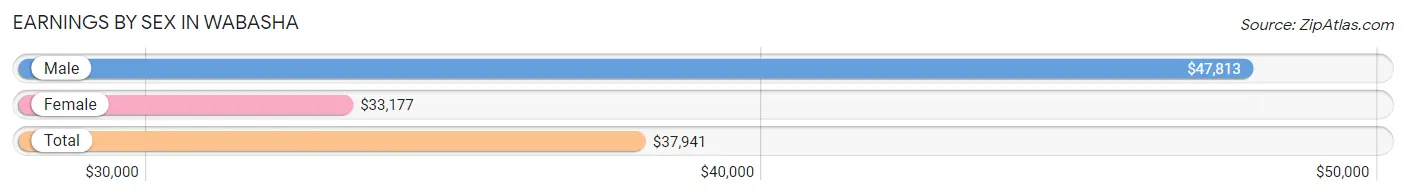
| Sex | Number | Average Earnings |
| Male | 649 (50.7%) | $47,813 |
| Female | 631 (49.3%) | $33,177 |
| Total | 1,280 (100.0%) | $37,941 |
Earnings by Sex by Income Bracket in Wabasha
The most common earnings brackets in Wabasha are $50,000 to $54,999 for men (131 | 20.2%) and $2,499 or less for women (70 | 11.1%).
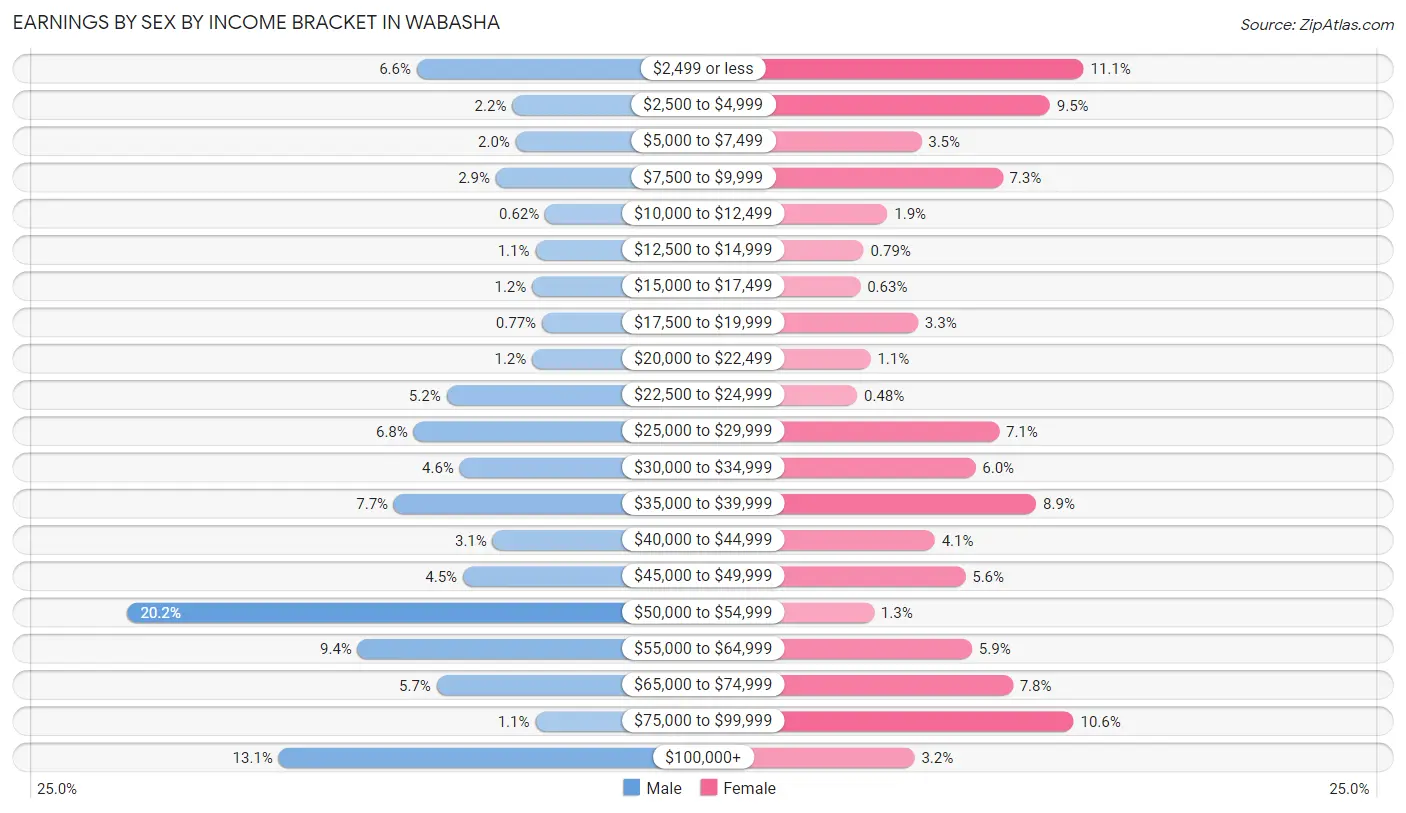
| Income | Male | Female |
| $2,499 or less | 43 (6.6%) | 70 (11.1%) |
| $2,500 to $4,999 | 14 (2.2%) | 60 (9.5%) |
| $5,000 to $7,499 | 13 (2.0%) | 22 (3.5%) |
| $7,500 to $9,999 | 19 (2.9%) | 46 (7.3%) |
| $10,000 to $12,499 | 4 (0.6%) | 12 (1.9%) |
| $12,500 to $14,999 | 7 (1.1%) | 5 (0.8%) |
| $15,000 to $17,499 | 8 (1.2%) | 4 (0.6%) |
| $17,500 to $19,999 | 5 (0.8%) | 21 (3.3%) |
| $20,000 to $22,499 | 8 (1.2%) | 7 (1.1%) |
| $22,500 to $24,999 | 34 (5.2%) | 3 (0.5%) |
| $25,000 to $29,999 | 44 (6.8%) | 45 (7.1%) |
| $30,000 to $34,999 | 30 (4.6%) | 38 (6.0%) |
| $35,000 to $39,999 | 50 (7.7%) | 56 (8.9%) |
| $40,000 to $44,999 | 20 (3.1%) | 26 (4.1%) |
| $45,000 to $49,999 | 29 (4.5%) | 35 (5.6%) |
| $50,000 to $54,999 | 131 (20.2%) | 8 (1.3%) |
| $55,000 to $64,999 | 61 (9.4%) | 37 (5.9%) |
| $65,000 to $74,999 | 37 (5.7%) | 49 (7.8%) |
| $75,000 to $99,999 | 7 (1.1%) | 67 (10.6%) |
| $100,000+ | 85 (13.1%) | 20 (3.2%) |
| Total | 649 (100.0%) | 631 (100.0%) |
Earnings by Sex by Educational Attainment in Wabasha
Average earnings in Wabasha are $52,746 for men and $38,710 for women, a difference of 26.6%. Men with an educational attainment of bachelor's degree enjoy the highest average annual earnings of $250,001, while those with college or associate's degree education earn the least with $37,188. Women with an educational attainment of bachelor's degree earn the most with the average annual earnings of $89,464, while those with less than high school education have the smallest earnings of $8,182.
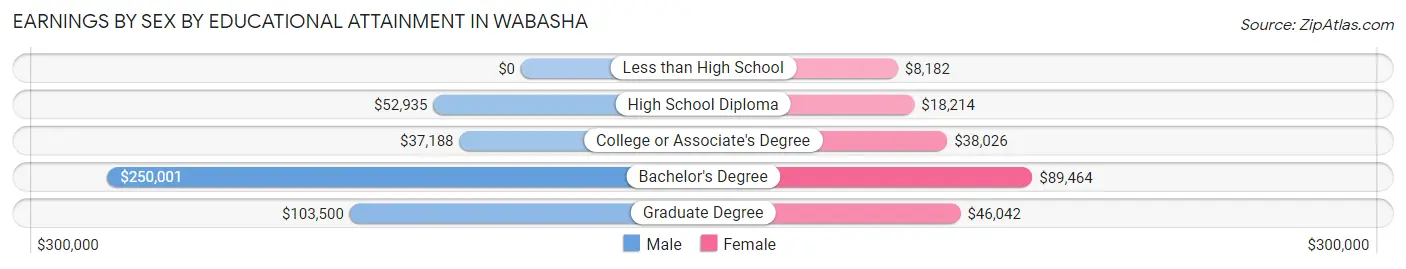
| Educational Attainment | Male Income | Female Income |
| Less than High School | - | - |
| High School Diploma | $52,935 | $18,214 |
| College or Associate's Degree | $37,188 | $38,026 |
| Bachelor's Degree | $250,001 | $89,464 |
| Graduate Degree | $103,500 | $46,042 |
| Total | $52,746 | $38,710 |
Family Income in Wabasha
Family Income Brackets in Wabasha
According to the Wabasha family income data, there are 178 families falling into the $75,000 to $99,999 income range, which is the most common income bracket and makes up 25.9% of all families. Conversely, the $15,000 to $24,999 income bracket is the least frequent group with only 13 families (1.9%) belonging to this category.
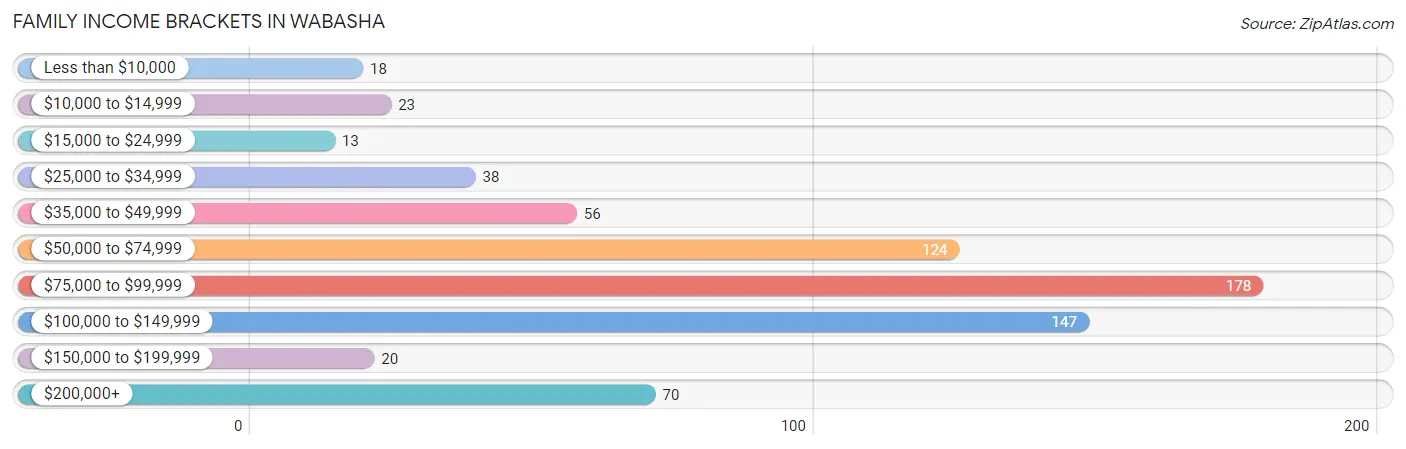
| Income Bracket | # Families | % Families |
| Less than $10,000 | 18 | 2.6% |
| $10,000 to $14,999 | 23 | 3.3% |
| $15,000 to $24,999 | 13 | 1.9% |
| $25,000 to $34,999 | 38 | 5.5% |
| $35,000 to $49,999 | 56 | 8.2% |
| $50,000 to $74,999 | 124 | 18.0% |
| $75,000 to $99,999 | 178 | 25.9% |
| $100,000 to $149,999 | 147 | 21.4% |
| $150,000 to $199,999 | 20 | 2.9% |
| $200,000+ | 70 | 10.2% |
Family Income by Famaliy Size in Wabasha
5-person families (33 | 4.8%) account for the highest median family income in Wabasha with $250,001 per family, while 5-person families (33 | 4.8%) have the highest median income of $50,000 per family member.
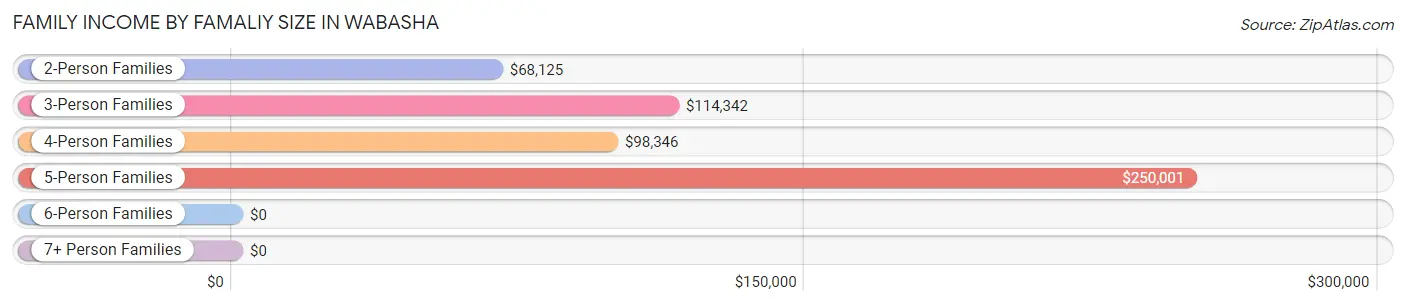
| Income Bracket | # Families | Median Income |
| 2-Person Families | 430 (62.6%) | $68,125 |
| 3-Person Families | 128 (18.6%) | $114,342 |
| 4-Person Families | 77 (11.2%) | $98,346 |
| 5-Person Families | 33 (4.8%) | $250,001 |
| 6-Person Families | 19 (2.8%) | $0 |
| 7+ Person Families | 0 (0.0%) | $0 |
| Total | 687 (100.0%) | $85,677 |
Family Income by Number of Earners in Wabasha
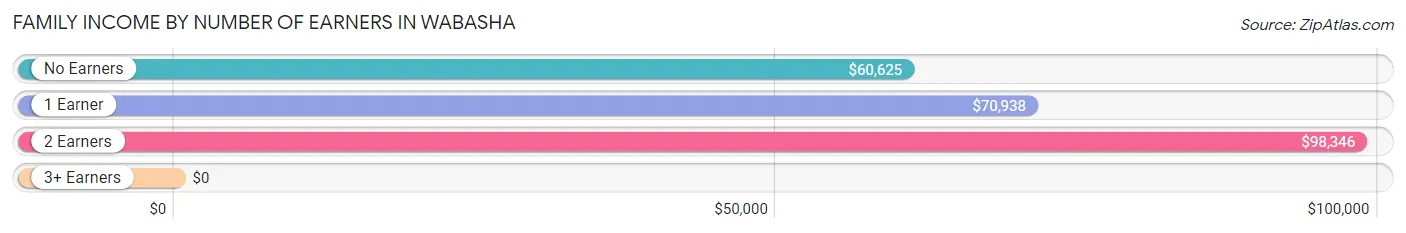
| Number of Earners | # Families | Median Income |
| No Earners | 186 (27.1%) | $60,625 |
| 1 Earner | 177 (25.8%) | $70,938 |
| 2 Earners | 235 (34.2%) | $98,346 |
| 3+ Earners | 89 (13.0%) | $0 |
| Total | 687 (100.0%) | $85,677 |
Household Income in Wabasha
Household Income Brackets in Wabasha
With 322 households falling in the category, the $50,000 to $74,999 income range is the most frequent in Wabasha, accounting for 26.0% of all households. In contrast, only 26 households (2.1%) fall into the less than $10,000 income bracket, making it the least populous group.
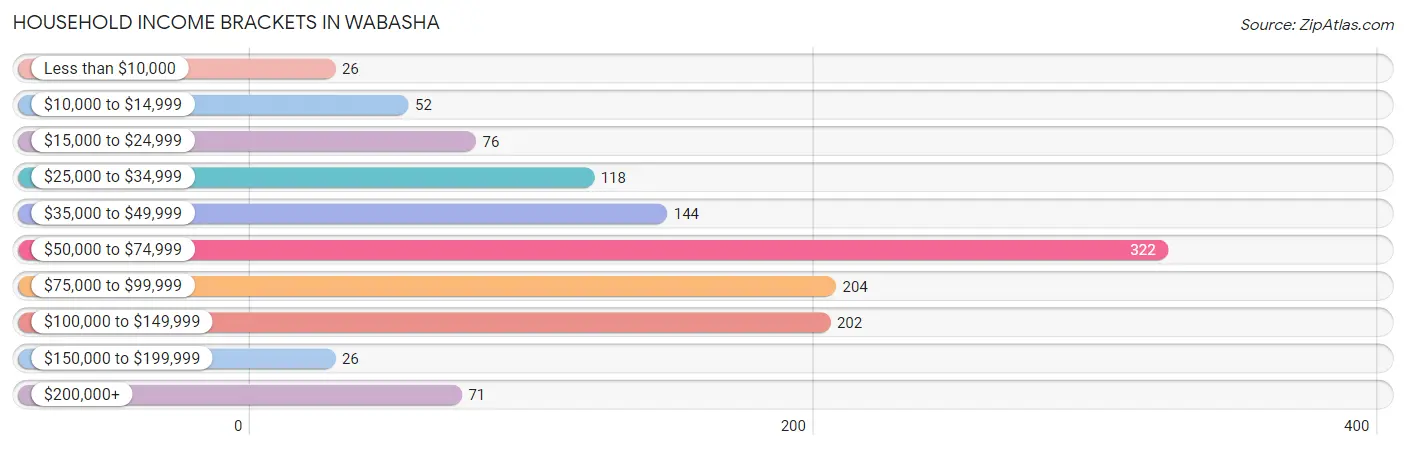
| Income Bracket | # Households | % Households |
| Less than $10,000 | 26 | 2.1% |
| $10,000 to $14,999 | 52 | 4.2% |
| $15,000 to $24,999 | 76 | 6.1% |
| $25,000 to $34,999 | 118 | 9.5% |
| $35,000 to $49,999 | 144 | 11.6% |
| $50,000 to $74,999 | 322 | 26.0% |
| $75,000 to $99,999 | 204 | 16.5% |
| $100,000 to $149,999 | 202 | 16.3% |
| $150,000 to $199,999 | 26 | 2.1% |
| $200,000+ | 71 | 5.7% |
Household Income by Householder Age in Wabasha
The median household income in Wabasha is $60,893, with the highest median household income of $98,015 found in the 25 to 44 years age bracket for the primary householder. A total of 236 households (19.1%) fall into this category. Meanwhile, the 15 to 24 years age bracket for the primary householder has the lowest median household income of $0, with 29 households (2.3%) in this group.
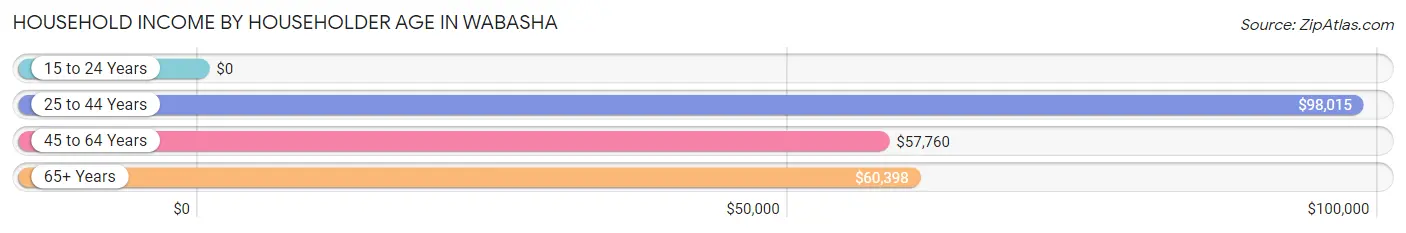
| Income Bracket | # Households | Median Income |
| 15 to 24 Years | 29 (2.3%) | $0 |
| 25 to 44 Years | 236 (19.1%) | $98,015 |
| 45 to 64 Years | 469 (37.9%) | $57,760 |
| 65+ Years | 504 (40.7%) | $60,398 |
| Total | 1,238 (100.0%) | $60,893 |
Poverty in Wabasha
Income Below Poverty by Sex and Age in Wabasha
With 6.2% poverty level for males and 11.0% for females among the residents of Wabasha, 5 year old males and 65 to 74 year old females are the most vulnerable to poverty, with 8 males (47.1%) and 40 females (20.8%) in their respective age groups living below the poverty level.
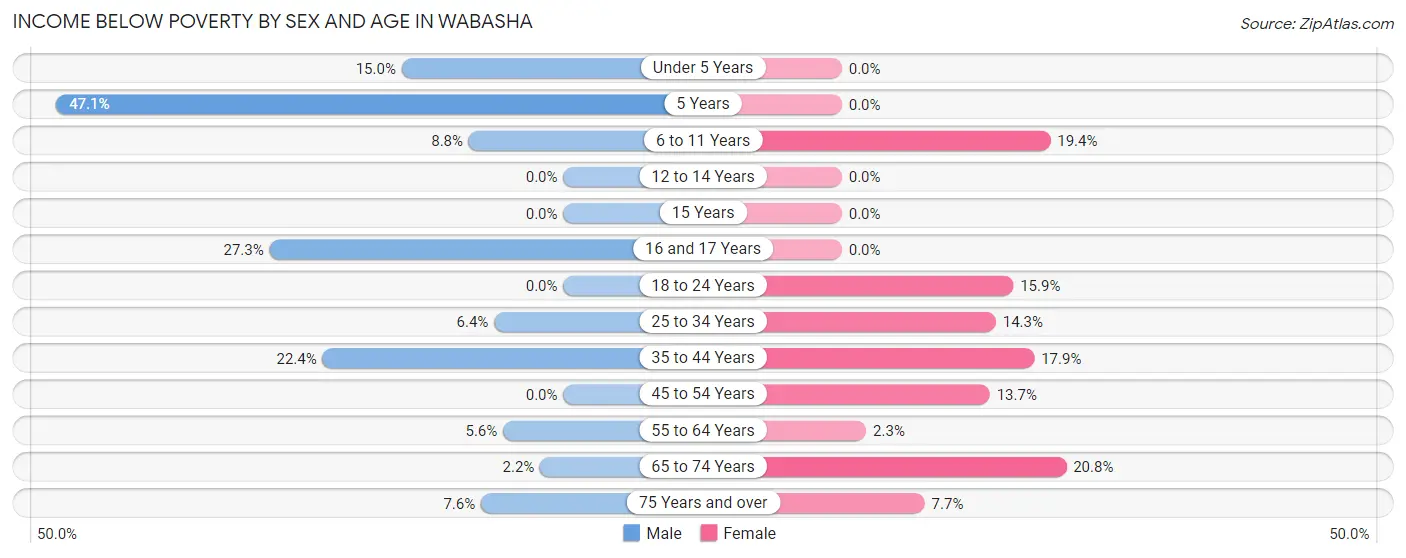
| Age Bracket | Male | Female |
| Under 5 Years | 3 (15.0%) | 0 (0.0%) |
| 5 Years | 8 (47.1%) | 0 (0.0%) |
| 6 to 11 Years | 5 (8.8%) | 6 (19.4%) |
| 12 to 14 Years | 0 (0.0%) | 0 (0.0%) |
| 15 Years | 0 (0.0%) | 0 (0.0%) |
| 16 and 17 Years | 6 (27.3%) | 0 (0.0%) |
| 18 to 24 Years | 0 (0.0%) | 14 (15.9%) |
| 25 to 34 Years | 7 (6.4%) | 14 (14.3%) |
| 35 to 44 Years | 19 (22.4%) | 25 (17.9%) |
| 45 to 54 Years | 0 (0.0%) | 14 (13.7%) |
| 55 to 64 Years | 10 (5.6%) | 5 (2.3%) |
| 65 to 74 Years | 4 (2.1%) | 40 (20.8%) |
| 75 Years and over | 12 (7.6%) | 16 (7.7%) |
| Total | 74 (6.2%) | 134 (11.0%) |
Income Above Poverty by Sex and Age in Wabasha
According to the poverty statistics in Wabasha, males aged 12 to 14 years and females aged under 5 years are the age groups that are most secure financially, with 100.0% of males and 100.0% of females in these age groups living above the poverty line.
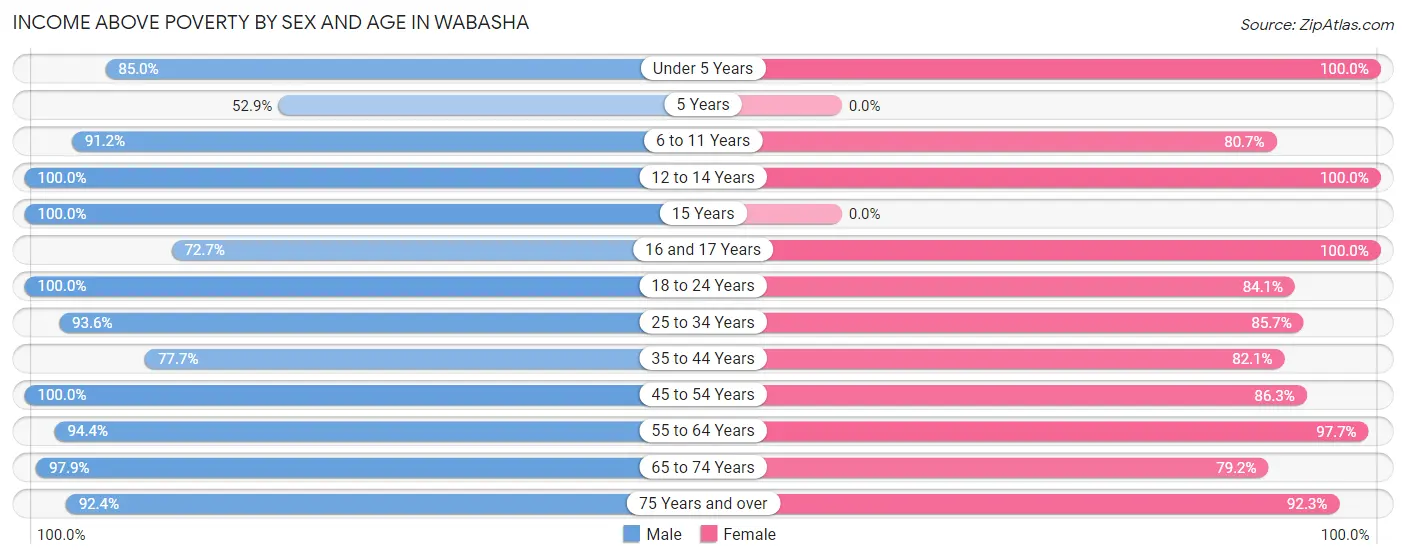
| Age Bracket | Male | Female |
| Under 5 Years | 17 (85.0%) | 52 (100.0%) |
| 5 Years | 9 (52.9%) | 0 (0.0%) |
| 6 to 11 Years | 52 (91.2%) | 25 (80.6%) |
| 12 to 14 Years | 60 (100.0%) | 37 (100.0%) |
| 15 Years | 19 (100.0%) | 0 (0.0%) |
| 16 and 17 Years | 16 (72.7%) | 48 (100.0%) |
| 18 to 24 Years | 40 (100.0%) | 74 (84.1%) |
| 25 to 34 Years | 102 (93.6%) | 84 (85.7%) |
| 35 to 44 Years | 66 (77.6%) | 115 (82.1%) |
| 45 to 54 Years | 250 (100.0%) | 88 (86.3%) |
| 55 to 64 Years | 169 (94.4%) | 216 (97.7%) |
| 65 to 74 Years | 182 (97.9%) | 152 (79.2%) |
| 75 Years and over | 145 (92.4%) | 192 (92.3%) |
| Total | 1,127 (93.8%) | 1,083 (89.0%) |
Income Below Poverty Among Married-Couple Families in Wabasha
The poverty statistics for married-couple families in Wabasha show that 3.9% or 22 of the total 558 families live below the poverty line. Families with no children have the highest poverty rate of 5.6%, comprising of 22 families. On the other hand, families with 1 or 2 children have the lowest poverty rate of 0.0%, which includes 0 families.
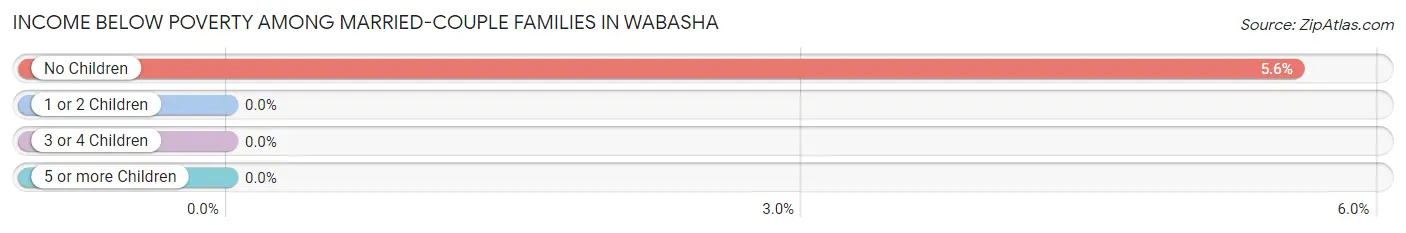
| Children | Above Poverty | Below Poverty |
| No Children | 373 (94.4%) | 22 (5.6%) |
| 1 or 2 Children | 142 (100.0%) | 0 (0.0%) |
| 3 or 4 Children | 21 (100.0%) | 0 (0.0%) |
| 5 or more Children | 0 (0.0%) | 0 (0.0%) |
| Total | 536 (96.1%) | 22 (3.9%) |
Income Below Poverty Among Single-Parent Households in Wabasha
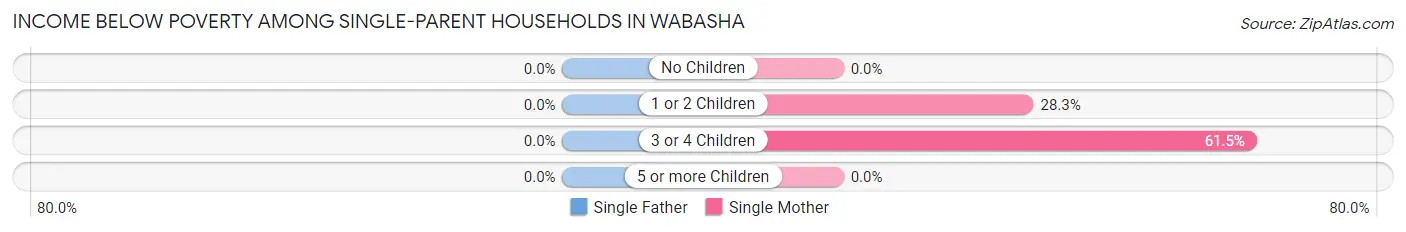
| Children | Single Father | Single Mother |
| No Children | 0 (0.0%) | 0 (0.0%) |
| 1 or 2 Children | 0 (0.0%) | 15 (28.3%) |
| 3 or 4 Children | 0 (0.0%) | 8 (61.5%) |
| 5 or more Children | 0 (0.0%) | 0 (0.0%) |
| Total | 0 (0.0%) | 23 (22.8%) |
Income Below Poverty Among Married-Couple vs Single-Parent Households in Wabasha
The poverty data for Wabasha shows that 22 of the married-couple family households (3.9%) and 23 of the single-parent households (17.8%) are living below the poverty level. Within the married-couple family households, those with no children have the highest poverty rate, with 22 households (5.6%) falling below the poverty line. Among the single-parent households, those with 3 or 4 children have the highest poverty rate, with 8 household (61.5%) living below poverty.
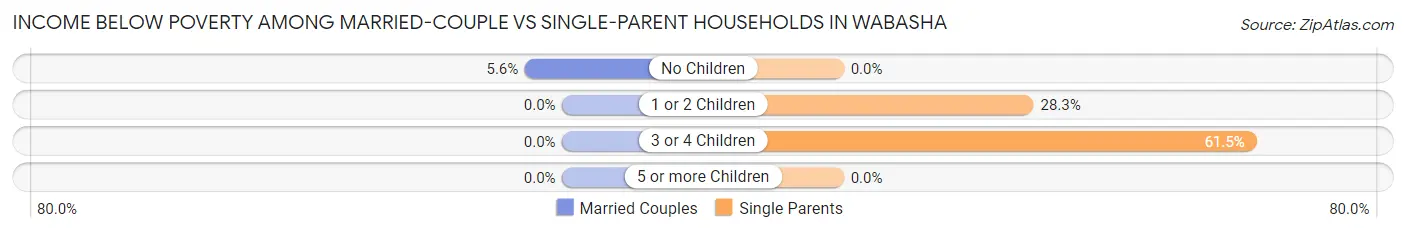
| Children | Married-Couple Families | Single-Parent Households |
| No Children | 22 (5.6%) | 0 (0.0%) |
| 1 or 2 Children | 0 (0.0%) | 15 (28.3%) |
| 3 or 4 Children | 0 (0.0%) | 8 (61.5%) |
| 5 or more Children | 0 (0.0%) | 0 (0.0%) |
| Total | 22 (3.9%) | 23 (17.8%) |
Race in Wabasha
The most populous races in Wabasha are White / Caucasian (2,417 | 94.4%), Hawaiian / Pacific (92 | 3.6%), and Two or more Races (24 | 0.9%).
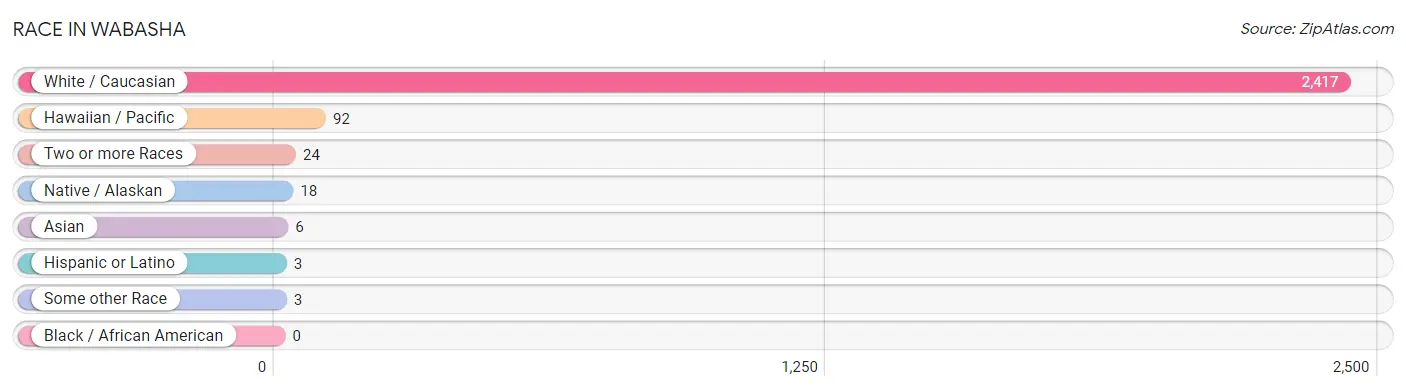
| Race | # Population | % Population |
| Asian | 6 | 0.2% |
| Black / African American | 0 | 0.0% |
| Hawaiian / Pacific | 92 | 3.6% |
| Hispanic or Latino | 3 | 0.1% |
| Native / Alaskan | 18 | 0.7% |
| White / Caucasian | 2,417 | 94.4% |
| Two or more Races | 24 | 0.9% |
| Some other Race | 3 | 0.1% |
| Total | 2,560 | 100.0% |
Ancestry in Wabasha
The most populous ancestries reported in Wabasha are German (1,449 | 56.6%), Irish (521 | 20.3%), Norwegian (207 | 8.1%), English (174 | 6.8%), and Dutch (143 | 5.6%), together accounting for 97.4% of all Wabasha residents.
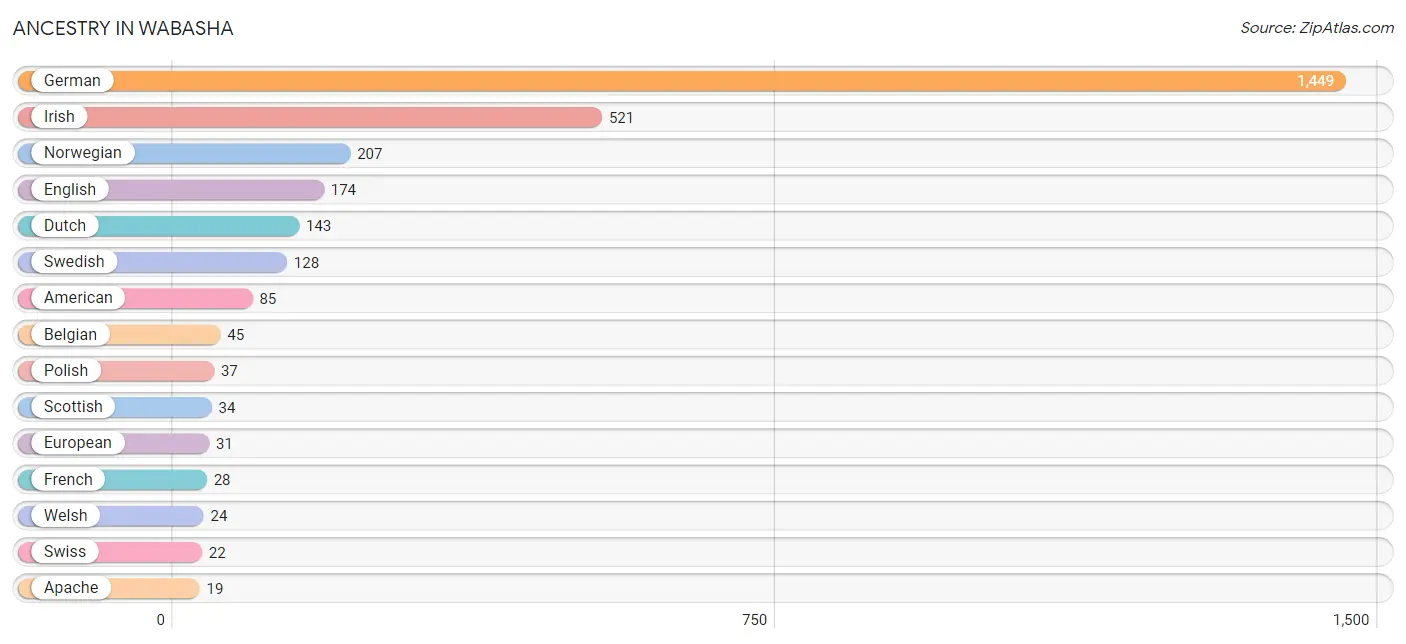
| Ancestry | # Population | % Population |
| American | 85 | 3.3% |
| Apache | 19 | 0.7% |
| Belgian | 45 | 1.8% |
| British | 8 | 0.3% |
| Chippewa | 15 | 0.6% |
| Czech | 11 | 0.4% |
| Danish | 14 | 0.5% |
| Dutch | 143 | 5.6% |
| English | 174 | 6.8% |
| European | 31 | 1.2% |
| Finnish | 13 | 0.5% |
| French | 28 | 1.1% |
| French Canadian | 4 | 0.2% |
| German | 1,449 | 56.6% |
| Indian (Asian) | 6 | 0.2% |
| Irish | 521 | 20.3% |
| Italian | 9 | 0.4% |
| Luxembourger | 5 | 0.2% |
| Mexican | 3 | 0.1% |
| Northern European | 4 | 0.2% |
| Norwegian | 207 | 8.1% |
| Polish | 37 | 1.5% |
| Russian | 10 | 0.4% |
| Scandinavian | 5 | 0.2% |
| Scottish | 34 | 1.3% |
| Swedish | 128 | 5.0% |
| Swiss | 22 | 0.9% |
| Welsh | 24 | 0.9% |
| Yugoslavian | 7 | 0.3% | View All 29 Rows |
Immigrants in Wabasha
The most numerous immigrant groups reported in Wabasha came from Asia (98 | 3.8%), South Eastern Asia (98 | 3.8%), Philippines (92 | 3.6%), and Vietnam (6 | 0.2%), together accounting for 11.5% of all Wabasha residents.
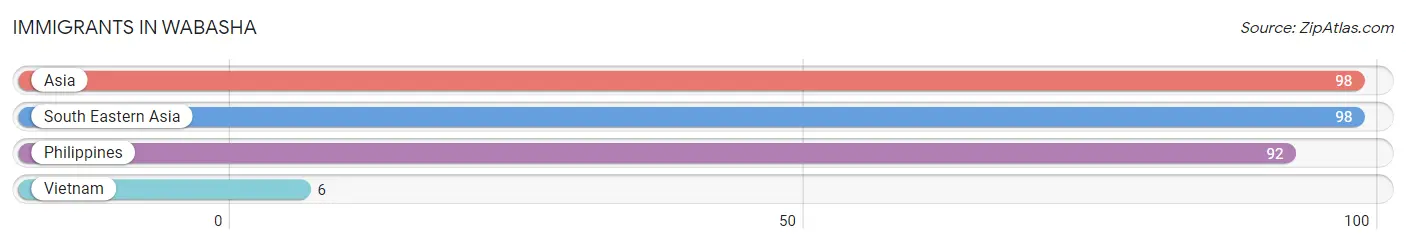
| Immigration Origin | # Population | % Population |
| Asia | 98 | 3.8% |
| Philippines | 92 | 3.6% |
| South Eastern Asia | 98 | 3.8% |
| Vietnam | 6 | 0.2% | View All 4 Rows |
Sex and Age in Wabasha
Sex and Age in Wabasha
The most populous age groups in Wabasha are 50 to 54 Years (143 | 11.2%) for men and 70 to 74 Years (117 | 9.1%) for women.
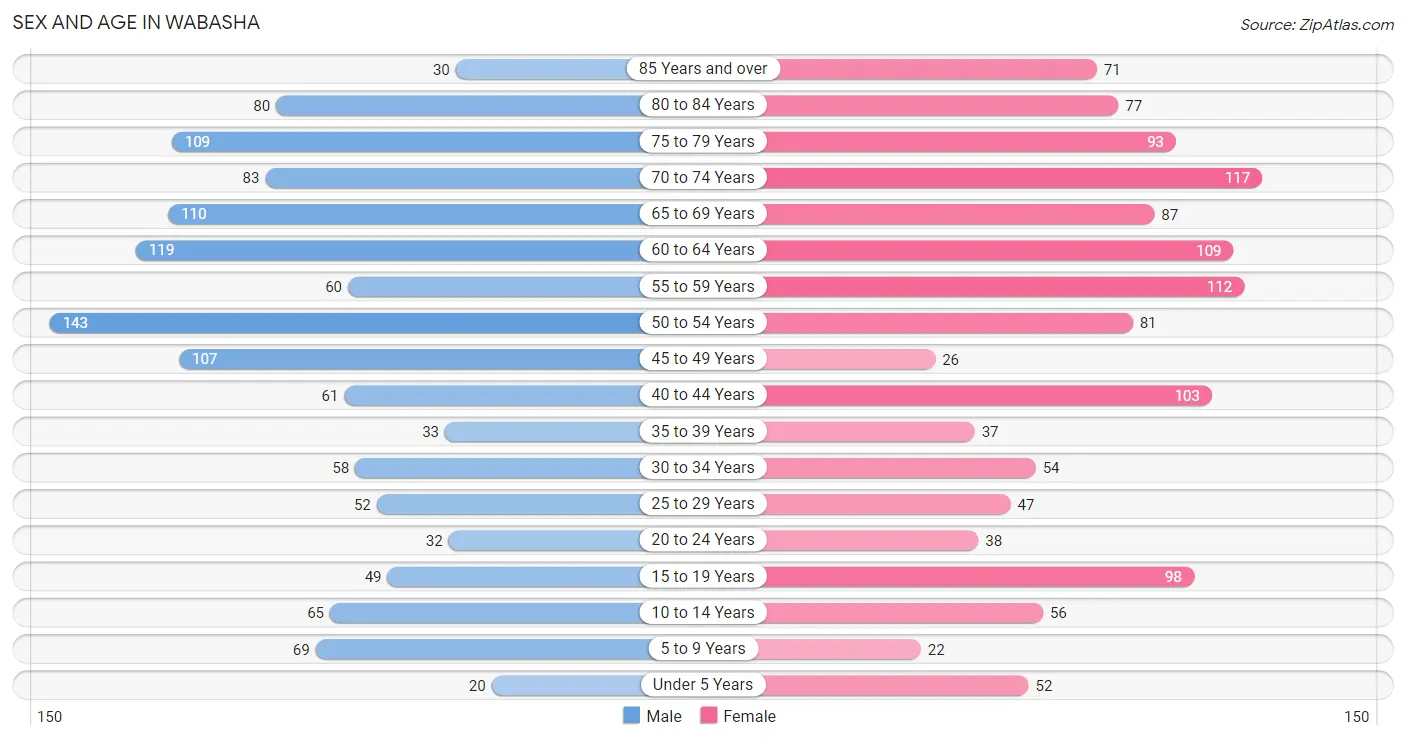
| Age Bracket | Male | Female |
| Under 5 Years | 20 (1.6%) | 52 (4.1%) |
| 5 to 9 Years | 69 (5.4%) | 22 (1.7%) |
| 10 to 14 Years | 65 (5.1%) | 56 (4.4%) |
| 15 to 19 Years | 49 (3.8%) | 98 (7.7%) |
| 20 to 24 Years | 32 (2.5%) | 38 (3.0%) |
| 25 to 29 Years | 52 (4.1%) | 47 (3.7%) |
| 30 to 34 Years | 58 (4.5%) | 54 (4.2%) |
| 35 to 39 Years | 33 (2.6%) | 37 (2.9%) |
| 40 to 44 Years | 61 (4.8%) | 103 (8.1%) |
| 45 to 49 Years | 107 (8.4%) | 26 (2.0%) |
| 50 to 54 Years | 143 (11.2%) | 81 (6.3%) |
| 55 to 59 Years | 60 (4.7%) | 112 (8.7%) |
| 60 to 64 Years | 119 (9.3%) | 109 (8.5%) |
| 65 to 69 Years | 110 (8.6%) | 87 (6.8%) |
| 70 to 74 Years | 83 (6.5%) | 117 (9.1%) |
| 75 to 79 Years | 109 (8.5%) | 93 (7.3%) |
| 80 to 84 Years | 80 (6.2%) | 77 (6.0%) |
| 85 Years and over | 30 (2.3%) | 71 (5.6%) |
| Total | 1,280 (100.0%) | 1,280 (100.0%) |
Families and Households in Wabasha
Median Family Size in Wabasha
The median family size in Wabasha is 2.55 persons per family, with married-couple families (558 | 81.2%) accounting for the largest median family size of 2.63 persons per family. On the other hand, single male/father families (28 | 4.1%) represent the smallest median family size with 1.82 persons per family.
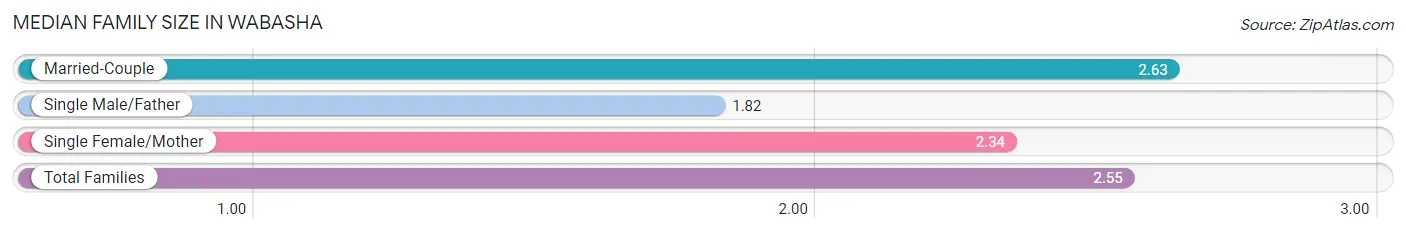
| Family Type | # Families | Family Size |
| Married-Couple | 558 (81.2%) | 2.63 |
| Single Male/Father | 28 (4.1%) | 1.82 |
| Single Female/Mother | 101 (14.7%) | 2.34 |
| Total Families | 687 (100.0%) | 2.55 |
Median Household Size in Wabasha
The median household size in Wabasha is 1.94 persons per household, with married-couple households (558 | 45.1%) accounting for the largest median household size of 2.63 persons per household. non-family households (551 | 44.5%) represent the smallest median household size with 1.13 persons per household.
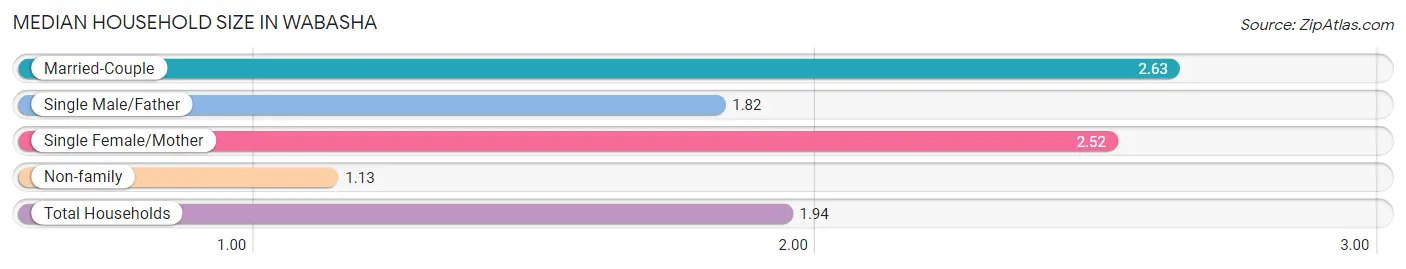
| Household Type | # Households | Household Size |
| Married-Couple | 558 (45.1%) | 2.63 |
| Single Male/Father | 28 (2.3%) | 1.82 |
| Single Female/Mother | 101 (8.2%) | 2.52 |
| Non-family | 551 (44.5%) | 1.13 |
| Total Households | 1,238 (100.0%) | 1.94 |
Household Size by Marriage Status in Wabasha
Out of a total of 1,238 households in Wabasha, 687 (55.5%) are family households, while 551 (44.5%) are nonfamily households. The most numerous type of family households are 2-person households, comprising 430, and the most common type of nonfamily households are 1-person households, comprising 508.
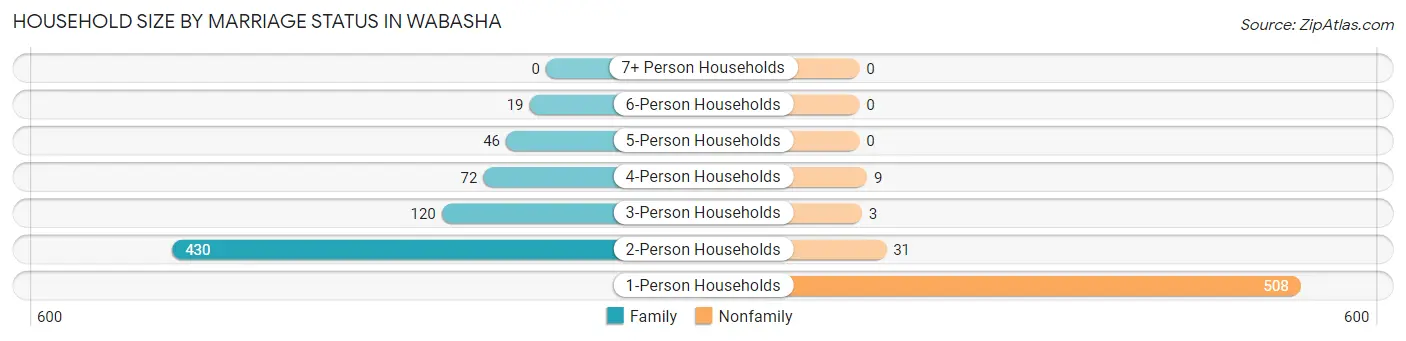
| Household Size | Family Households | Nonfamily Households |
| 1-Person Households | - | 508 (41.0%) |
| 2-Person Households | 430 (34.7%) | 31 (2.5%) |
| 3-Person Households | 120 (9.7%) | 3 (0.2%) |
| 4-Person Households | 72 (5.8%) | 9 (0.7%) |
| 5-Person Households | 46 (3.7%) | 0 (0.0%) |
| 6-Person Households | 19 (1.5%) | 0 (0.0%) |
| 7+ Person Households | 0 (0.0%) | 0 (0.0%) |
| Total | 687 (55.5%) | 551 (44.5%) |
Female Fertility in Wabasha
Fertility by Age in Wabasha
| Age Bracket | Women with Births | Births / 1,000 Women |
| 15 to 19 years | 0 (0.0%) | 0.0 |
| 20 to 34 years | 0 (0.0%) | 0.0 |
| 35 to 50 years | 0 (0.0%) | 0.0 |
| Total | 0 (0.0%) | 0.0 |
Fertility by Age by Marriage Status in Wabasha
| Age Bracket | Married | Unmarried |
| 15 to 19 years | 0 (0.0%) | 0 (0.0%) |
| 20 to 34 years | 0 (0.0%) | 0 (0.0%) |
| 35 to 50 years | 0 (0.0%) | 0 (0.0%) |
| Total | 0 (0.0%) | 0 (0.0%) |
Fertility by Education in Wabasha
| Educational Attainment | Women with Births | Births / 1,000 Women |
| Less than High School | 0 (0.0%) | 0.0 |
| High School Diploma | 0 (0.0%) | 0.0 |
| College or Associate's Degree | 0 (0.0%) | 0.0 |
| Bachelor's Degree | 0 (0.0%) | 0.0 |
| Graduate Degree | 0 (0.0%) | 0.0 |
| Total | 0 (0.0%) | 0.0 |
Fertility by Education by Marriage Status in Wabasha
| Educational Attainment | Married | Unmarried |
| Less than High School | 0 (0.0%) | 0 (0.0%) |
| High School Diploma | 0 (0.0%) | 0 (0.0%) |
| College or Associate's Degree | 0 (0.0%) | 0 (0.0%) |
| Bachelor's Degree | 0 (0.0%) | 0 (0.0%) |
| Graduate Degree | 0 (0.0%) | 0 (0.0%) |
| Total | 0 (0.0%) | 0 (0.0%) |
Employment Characteristics in Wabasha
Employment by Class of Employer in Wabasha
Among the 1,119 employed individuals in Wabasha, private company employees (693 | 61.9%), not-for-profit organizations (178 | 15.9%), and self-employed (not incorporated) (83 | 7.4%) make up the most common classes of employment.
| Employer Class | # Employees | % Employees |
| Private Company Employees | 693 | 61.9% |
| Self-Employed (Incorporated) | 61 | 5.4% |
| Self-Employed (Not Incorporated) | 83 | 7.4% |
| Not-for-profit Organizations | 178 | 15.9% |
| Local Government Employees | 78 | 7.0% |
| State Government Employees | 12 | 1.1% |
| Federal Government Employees | 5 | 0.4% |
| Unpaid Family Workers | 9 | 0.8% |
| Total | 1,119 | 100.0% |
Employment Status by Age in Wabasha
According to the labor force statistics for Wabasha, out of the total population over 16 years of age (2,257), 52.3% or 1,180 individuals are in the labor force, with 3.8% or 45 of them unemployed. The age group with the highest labor force participation rate is 25 to 29 years, with 96.0% or 95 individuals in the labor force. Within the labor force, the 20 to 24 years age range has the highest percentage of unemployed individuals, with 11.1% or 7 of them being unemployed.
| Age Bracket | In Labor Force | Unemployed |
| 16 to 19 Years | 78 (60.9%) | 0 (0.0%) |
| 20 to 24 Years | 63 (90.0%) | 7 (11.1%) |
| 25 to 29 Years | 95 (96.0%) | 0 (0.0%) |
| 30 to 34 Years | 88 (78.6%) | 0 (0.0%) |
| 35 to 44 Years | 209 (89.3%) | 18 (8.6%) |
| 45 to 54 Years | 326 (91.3%) | 12 (3.7%) |
| 55 to 59 Years | 122 (70.9%) | 8 (6.6%) |
| 60 to 64 Years | 97 (42.5%) | 0 (0.0%) |
| 65 to 74 Years | 91 (22.9%) | 0 (0.0%) |
| 75 Years and over | 12 (2.6%) | 0 (0.0%) |
| Total | 1,180 (52.3%) | 45 (3.8%) |
Employment Status by Educational Attainment in Wabasha
According to labor force statistics for Wabasha, 78.0% of individuals (938) out of the total population between 25 and 64 years of age (1,202) are in the labor force, with 4.1% or 38 of them being unemployed. The group with the highest labor force participation rate are those with the educational attainment of less than high school, with 100.0% or 34 individuals in the labor force. Within the labor force, individuals with less than high school education have the highest percentage of unemployment, with 35.3% or 12 of them being unemployed.
| Educational Attainment | In Labor Force | Unemployed |
| Less than High School | 34 (100.0%) | 12 (35.3%) |
| High School Diploma | 296 (82.0%) | 9 (2.4%) |
| College / Associate Degree | 390 (72.6%) | 19 (3.6%) |
| Bachelor's Degree or higher | 217 (80.4%) | 6 (2.3%) |
| Total | 938 (78.0%) | 49 (4.1%) |
Employment Occupations by Sex in Wabasha
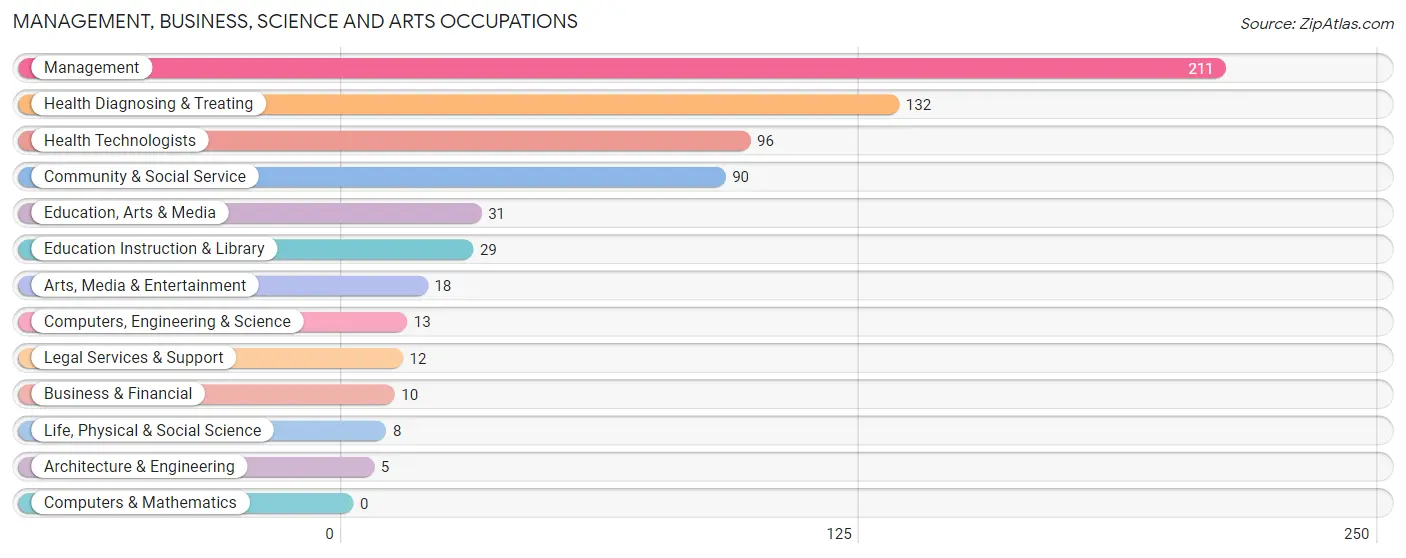
Management, Business, Science and Arts Occupations
The most common Management, Business, Science and Arts occupations in Wabasha are Management (211 | 18.6%), Health Diagnosing & Treating (132 | 11.6%), Health Technologists (96 | 8.5%), Community & Social Service (90 | 7.9%), and Education, Arts & Media (31 | 2.7%).
Management, Business, Science and Arts Occupations by Sex
Within the Management, Business, Science and Arts occupations in Wabasha, the most male-oriented occupations are Computers, Engineering & Science (100.0%), Architecture & Engineering (100.0%), and Life, Physical & Social Science (100.0%), while the most female-oriented occupations are Health Diagnosing & Treating (87.9%), Arts, Media & Entertainment (83.3%), and Health Technologists (83.3%).
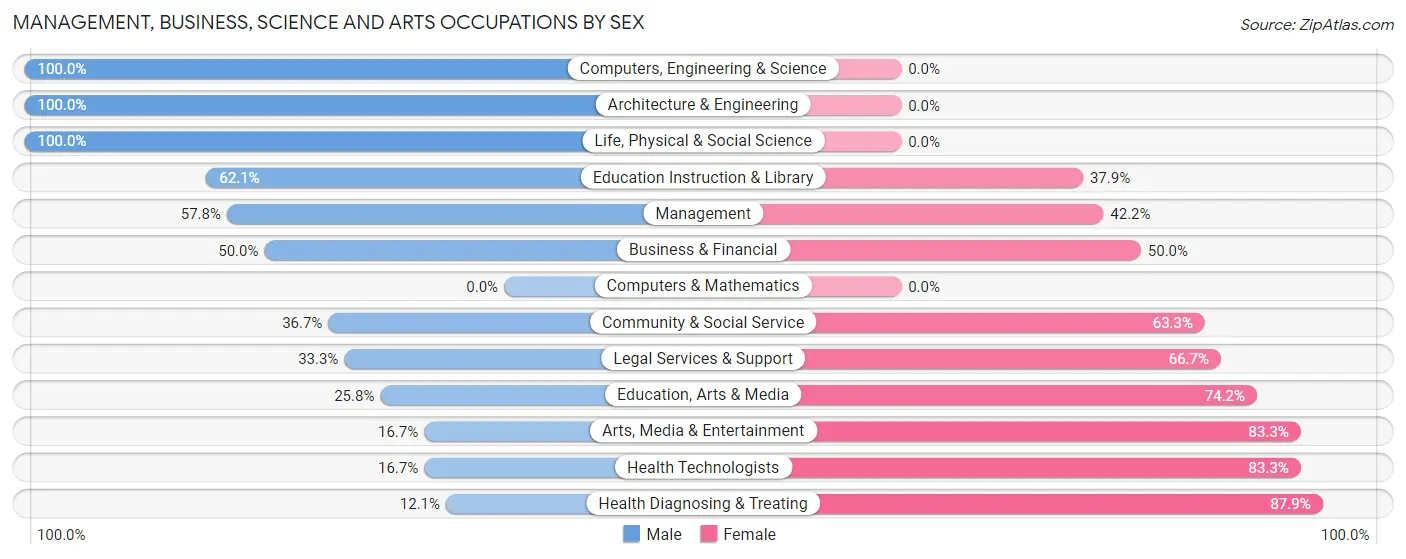
| Occupation | Male | Female |
| Management | 122 (57.8%) | 89 (42.2%) |
| Business & Financial | 5 (50.0%) | 5 (50.0%) |
| Computers, Engineering & Science | 13 (100.0%) | 0 (0.0%) |
| Computers & Mathematics | 0 (0.0%) | 0 (0.0%) |
| Architecture & Engineering | 5 (100.0%) | 0 (0.0%) |
| Life, Physical & Social Science | 8 (100.0%) | 0 (0.0%) |
| Community & Social Service | 33 (36.7%) | 57 (63.3%) |
| Education, Arts & Media | 8 (25.8%) | 23 (74.2%) |
| Legal Services & Support | 4 (33.3%) | 8 (66.7%) |
| Education Instruction & Library | 18 (62.1%) | 11 (37.9%) |
| Arts, Media & Entertainment | 3 (16.7%) | 15 (83.3%) |
| Health Diagnosing & Treating | 16 (12.1%) | 116 (87.9%) |
| Health Technologists | 16 (16.7%) | 80 (83.3%) |
| Total (Category) | 189 (41.4%) | 267 (58.6%) |
| Total (Overall) | 571 (50.3%) | 565 (49.7%) |
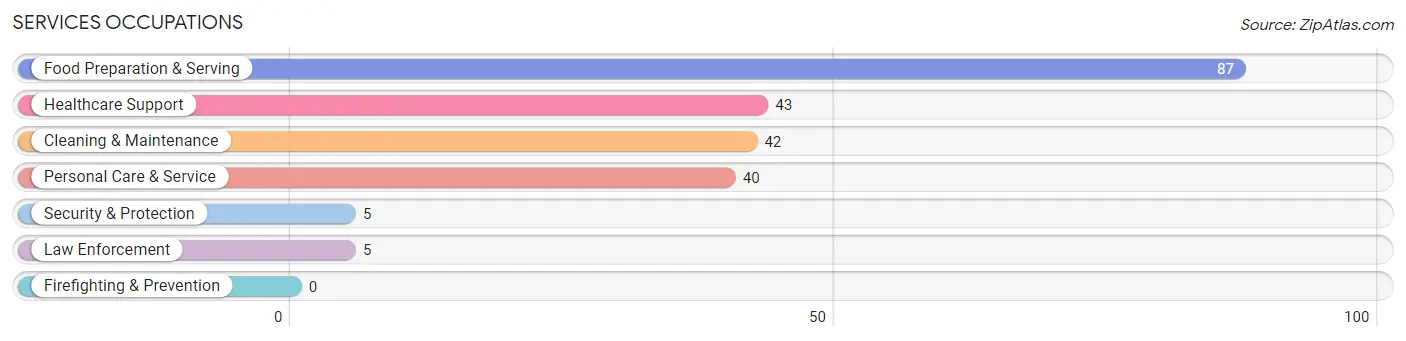
Services Occupations
The most common Services occupations in Wabasha are Food Preparation & Serving (87 | 7.7%), Healthcare Support (43 | 3.8%), Cleaning & Maintenance (42 | 3.7%), Personal Care & Service (40 | 3.5%), and Security & Protection (5 | 0.4%).
Services Occupations by Sex
Within the Services occupations in Wabasha, the most male-oriented occupations are Security & Protection (100.0%), Law Enforcement (100.0%), and Cleaning & Maintenance (30.9%), while the most female-oriented occupations are Healthcare Support (100.0%), Personal Care & Service (92.5%), and Food Preparation & Serving (71.3%).
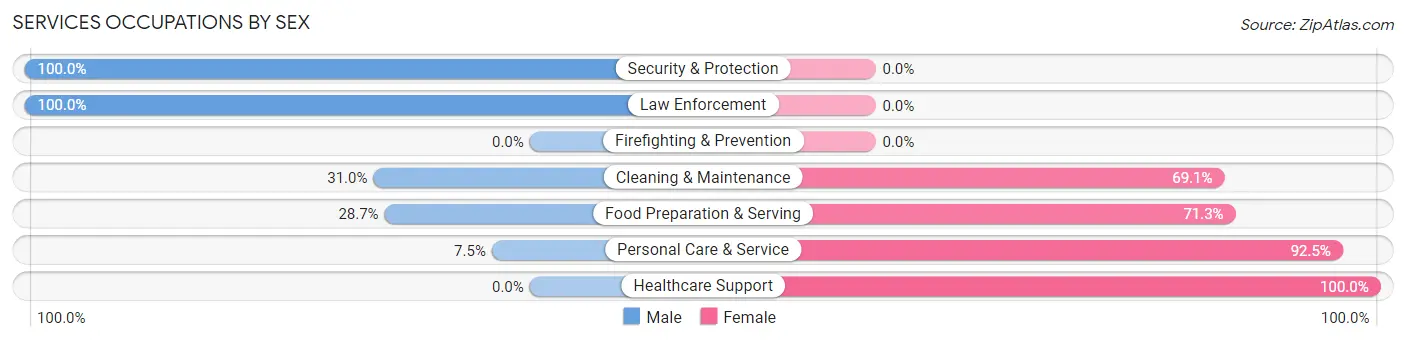
| Occupation | Male | Female |
| Healthcare Support | 0 (0.0%) | 43 (100.0%) |
| Security & Protection | 5 (100.0%) | 0 (0.0%) |
| Firefighting & Prevention | 0 (0.0%) | 0 (0.0%) |
| Law Enforcement | 5 (100.0%) | 0 (0.0%) |
| Food Preparation & Serving | 25 (28.7%) | 62 (71.3%) |
| Cleaning & Maintenance | 13 (30.9%) | 29 (69.1%) |
| Personal Care & Service | 3 (7.5%) | 37 (92.5%) |
| Total (Category) | 46 (21.2%) | 171 (78.8%) |
| Total (Overall) | 571 (50.3%) | 565 (49.7%) |
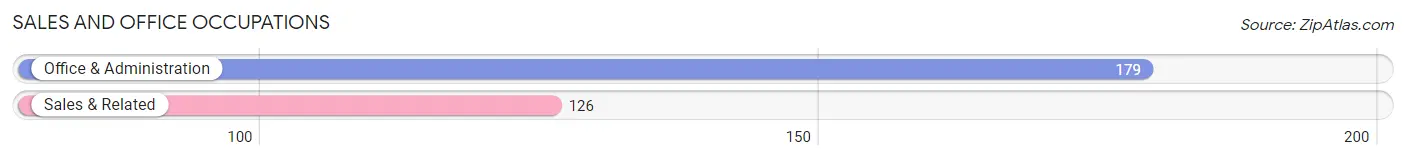
Sales and Office Occupations
The most common Sales and Office occupations in Wabasha are Office & Administration (179 | 15.8%), and Sales & Related (126 | 11.1%).
Sales and Office Occupations by Sex
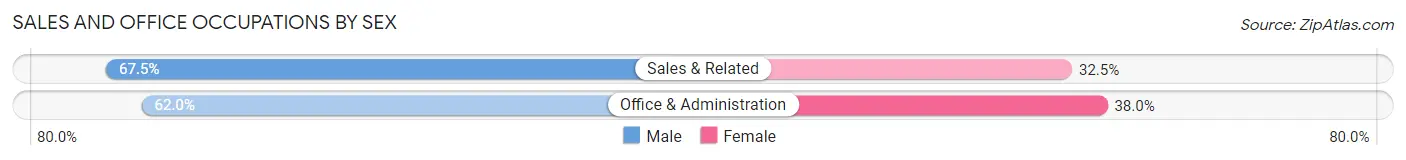
| Occupation | Male | Female |
| Sales & Related | 85 (67.5%) | 41 (32.5%) |
| Office & Administration | 111 (62.0%) | 68 (38.0%) |
| Total (Category) | 196 (64.3%) | 109 (35.7%) |
| Total (Overall) | 571 (50.3%) | 565 (49.7%) |
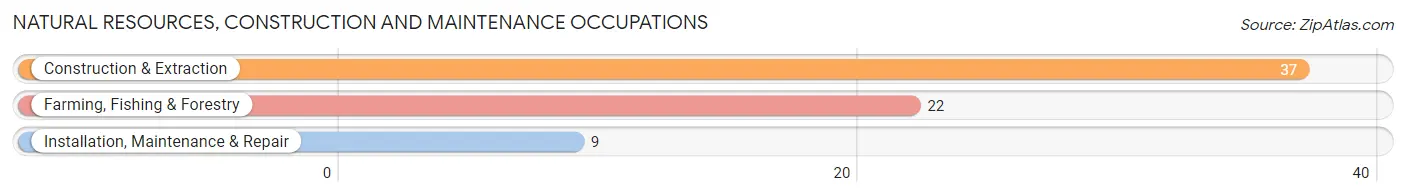
Natural Resources, Construction and Maintenance Occupations
The most common Natural Resources, Construction and Maintenance occupations in Wabasha are Construction & Extraction (37 | 3.3%), Farming, Fishing & Forestry (22 | 1.9%), and Installation, Maintenance & Repair (9 | 0.8%).
Natural Resources, Construction and Maintenance Occupations by Sex
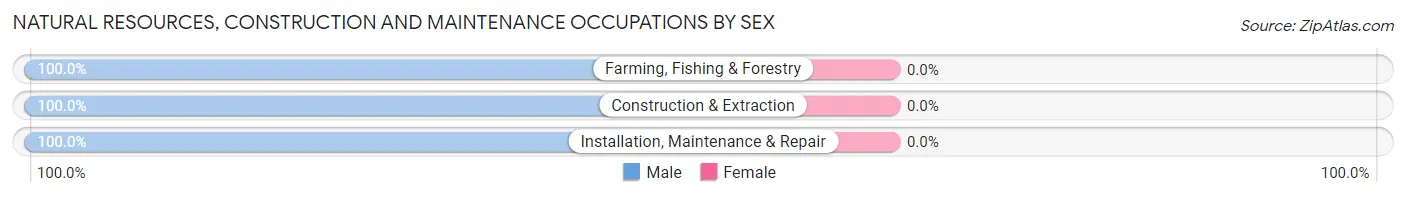
| Occupation | Male | Female |
| Farming, Fishing & Forestry | 22 (100.0%) | 0 (0.0%) |
| Construction & Extraction | 37 (100.0%) | 0 (0.0%) |
| Installation, Maintenance & Repair | 9 (100.0%) | 0 (0.0%) |
| Total (Category) | 68 (100.0%) | 0 (0.0%) |
| Total (Overall) | 571 (50.3%) | 565 (49.7%) |
Production, Transportation and Moving Occupations
The most common Production, Transportation and Moving occupations in Wabasha are Production (70 | 6.2%), and Material Moving (20 | 1.8%).
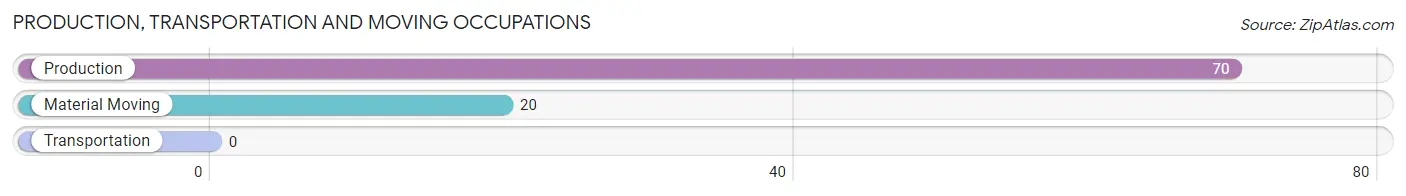
Production, Transportation and Moving Occupations by Sex
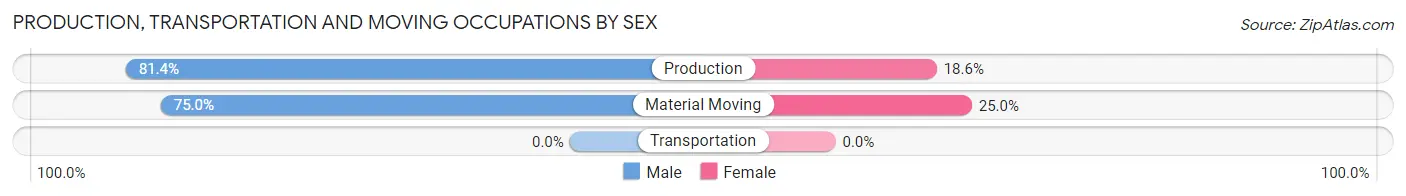
| Occupation | Male | Female |
| Production | 57 (81.4%) | 13 (18.6%) |
| Transportation | 0 (0.0%) | 0 (0.0%) |
| Material Moving | 15 (75.0%) | 5 (25.0%) |
| Total (Category) | 72 (80.0%) | 18 (20.0%) |
| Total (Overall) | 571 (50.3%) | 565 (49.7%) |
Employment Industries by Sex in Wabasha
Employment Industries in Wabasha
The major employment industries in Wabasha include Health Care & Social Assistance (290 | 25.5%), Manufacturing (251 | 22.1%), Retail Trade (113 | 10.0%), Educational Services (102 | 9.0%), and Accommodation & Food Services (87 | 7.7%).
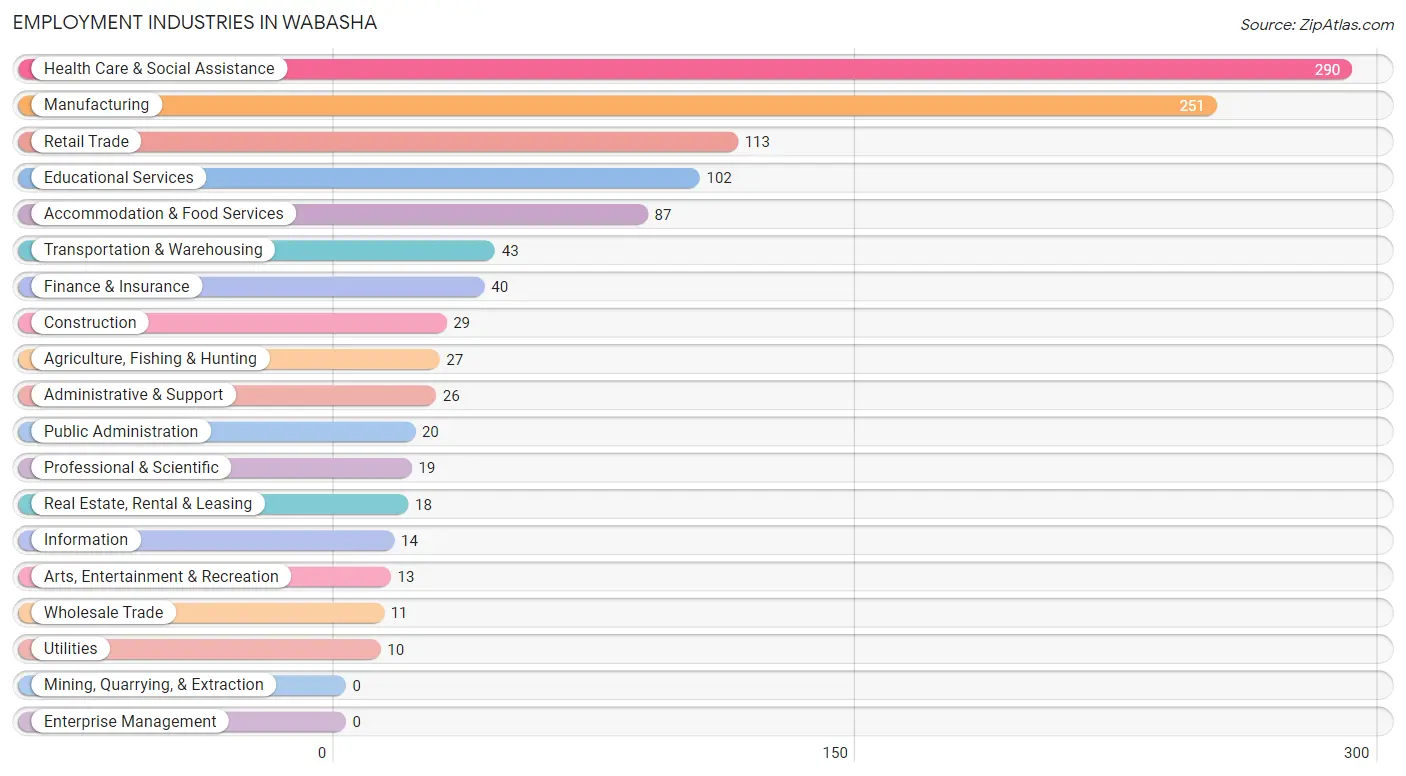
Employment Industries by Sex in Wabasha
The Wabasha industries that see more men than women are Agriculture, Fishing & Hunting (100.0%), Wholesale Trade (100.0%), and Transportation & Warehousing (100.0%), whereas the industries that tend to have a higher number of women are Real Estate, Rental & Leasing (100.0%), Arts, Entertainment & Recreation (100.0%), and Health Care & Social Assistance (83.1%).
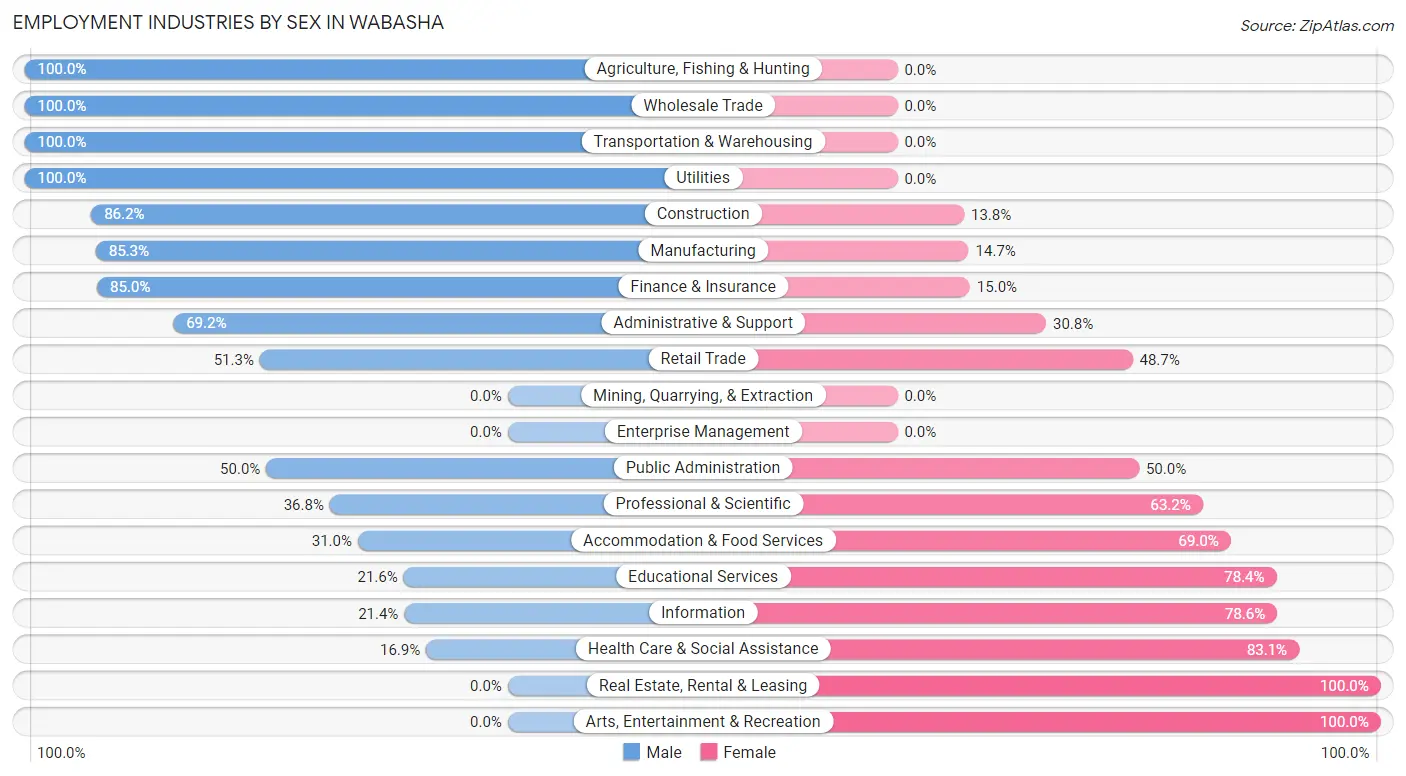
| Industry | Male | Female |
| Agriculture, Fishing & Hunting | 27 (100.0%) | 0 (0.0%) |
| Mining, Quarrying, & Extraction | 0 (0.0%) | 0 (0.0%) |
| Construction | 25 (86.2%) | 4 (13.8%) |
| Manufacturing | 214 (85.3%) | 37 (14.7%) |
| Wholesale Trade | 11 (100.0%) | 0 (0.0%) |
| Retail Trade | 58 (51.3%) | 55 (48.7%) |
| Transportation & Warehousing | 43 (100.0%) | 0 (0.0%) |
| Utilities | 10 (100.0%) | 0 (0.0%) |
| Information | 3 (21.4%) | 11 (78.6%) |
| Finance & Insurance | 34 (85.0%) | 6 (15.0%) |
| Real Estate, Rental & Leasing | 0 (0.0%) | 18 (100.0%) |
| Professional & Scientific | 7 (36.8%) | 12 (63.2%) |
| Enterprise Management | 0 (0.0%) | 0 (0.0%) |
| Administrative & Support | 18 (69.2%) | 8 (30.8%) |
| Educational Services | 22 (21.6%) | 80 (78.4%) |
| Health Care & Social Assistance | 49 (16.9%) | 241 (83.1%) |
| Arts, Entertainment & Recreation | 0 (0.0%) | 13 (100.0%) |
| Accommodation & Food Services | 27 (31.0%) | 60 (69.0%) |
| Public Administration | 10 (50.0%) | 10 (50.0%) |
| Total | 571 (50.3%) | 565 (49.7%) |
Education in Wabasha
School Enrollment in Wabasha
The most common levels of schooling among the 436 students in Wabasha are high school (138 | 31.7%), middle school (80 | 18.3%), and college / undergraduate (80 | 18.3%).
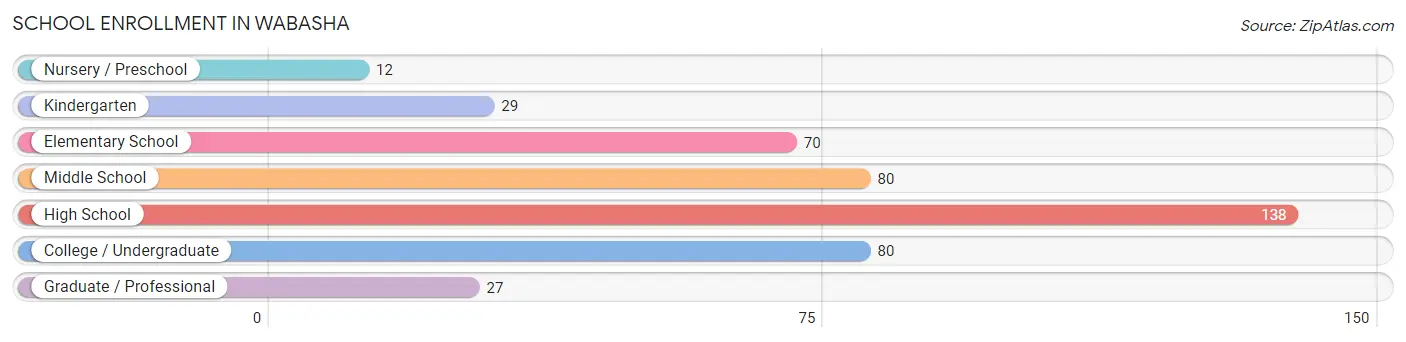
| School Level | # Students | % Students |
| Nursery / Preschool | 12 | 2.8% |
| Kindergarten | 29 | 6.7% |
| Elementary School | 70 | 16.1% |
| Middle School | 80 | 18.3% |
| High School | 138 | 31.7% |
| College / Undergraduate | 80 | 18.3% |
| Graduate / Professional | 27 | 6.2% |
| Total | 436 | 100.0% |
School Enrollment by Age by Funding Source in Wabasha
Out of a total of 436 students who are enrolled in schools in Wabasha, 42 (9.6%) attend a private institution, while the remaining 394 (90.4%) are enrolled in public schools. The age group of 3 to 4 year olds has the highest likelihood of being enrolled in private schools, with 9 (100.0% in the age bracket) enrolled. Conversely, the age group of 5 to 9 year old has the lowest likelihood of being enrolled in a private school, with 85 (100.0% in the age bracket) attending a public institution.
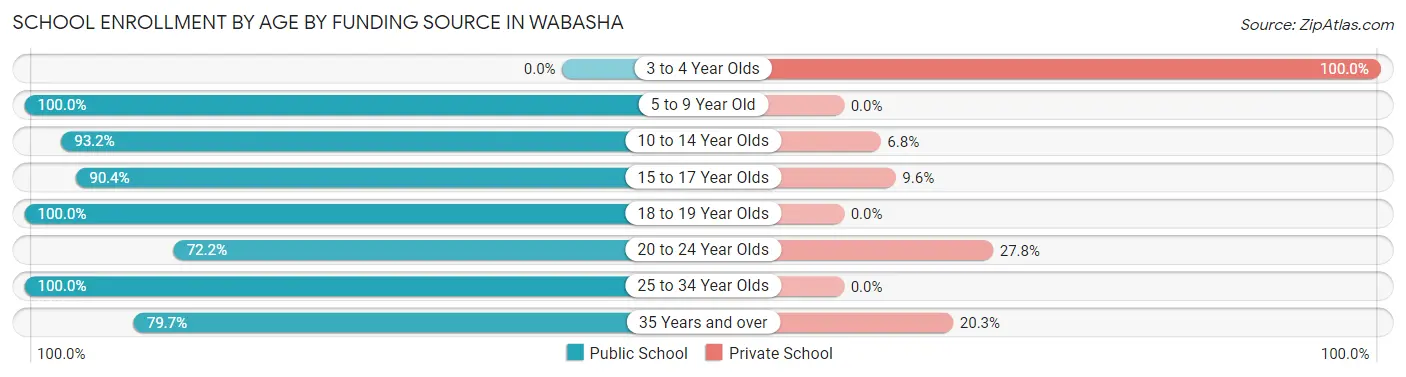
| Age Bracket | Public School | Private School |
| 3 to 4 Year Olds | 0 (0.0%) | 9 (100.0%) |
| 5 to 9 Year Old | 85 (100.0%) | 0 (0.0%) |
| 10 to 14 Year Olds | 109 (93.2%) | 8 (6.8%) |
| 15 to 17 Year Olds | 75 (90.4%) | 8 (9.6%) |
| 18 to 19 Year Olds | 58 (100.0%) | 0 (0.0%) |
| 20 to 24 Year Olds | 13 (72.2%) | 5 (27.8%) |
| 25 to 34 Year Olds | 7 (100.0%) | 0 (0.0%) |
| 35 Years and over | 47 (79.7%) | 12 (20.3%) |
| Total | 394 (90.4%) | 42 (9.6%) |
Educational Attainment by Field of Study in Wabasha
Business (132 | 25.8%), education (108 | 21.1%), science & technology (102 | 20.0%), psychology (39 | 7.6%), and bio, nature & agricultural (23 | 4.5%) are the most common fields of study among 511 individuals in Wabasha who have obtained a bachelor's degree or higher.
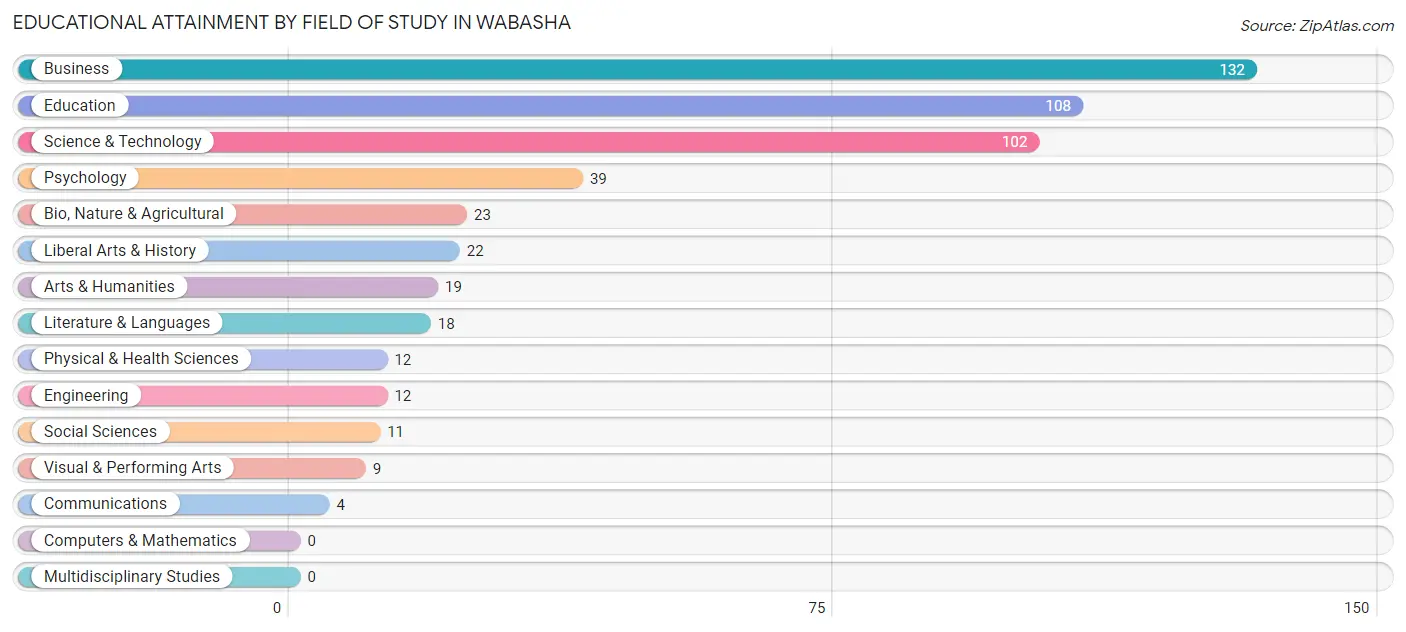
| Field of Study | # Graduates | % Graduates |
| Computers & Mathematics | 0 | 0.0% |
| Bio, Nature & Agricultural | 23 | 4.5% |
| Physical & Health Sciences | 12 | 2.4% |
| Psychology | 39 | 7.6% |
| Social Sciences | 11 | 2.1% |
| Engineering | 12 | 2.4% |
| Multidisciplinary Studies | 0 | 0.0% |
| Science & Technology | 102 | 20.0% |
| Business | 132 | 25.8% |
| Education | 108 | 21.1% |
| Literature & Languages | 18 | 3.5% |
| Liberal Arts & History | 22 | 4.3% |
| Visual & Performing Arts | 9 | 1.8% |
| Communications | 4 | 0.8% |
| Arts & Humanities | 19 | 3.7% |
| Total | 511 | 100.0% |
Transportation & Commute in Wabasha
Vehicle Availability by Sex in Wabasha
The most prevalent vehicle ownership categories in Wabasha are males with 3 vehicles (201, accounting for 35.4%) and females with 3 vehicles (175, making up 36.8%).
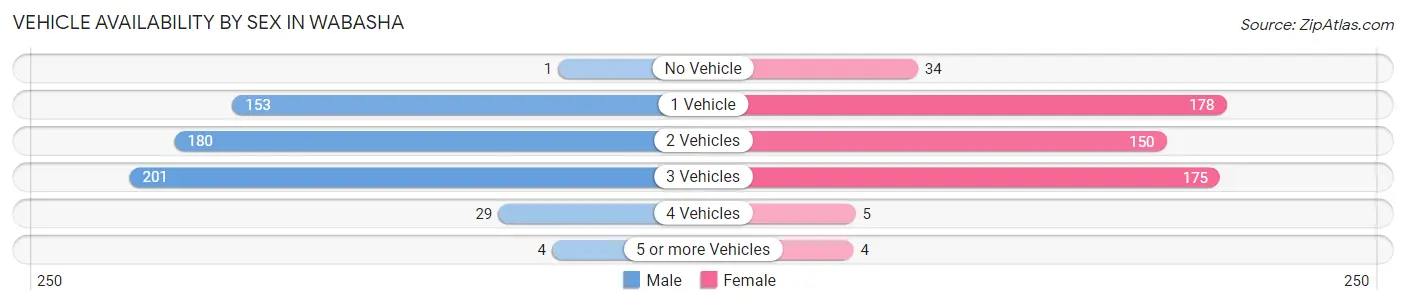
| Vehicles Available | Male | Female |
| No Vehicle | 1 (0.2%) | 34 (6.2%) |
| 1 Vehicle | 153 (26.9%) | 178 (32.6%) |
| 2 Vehicles | 180 (31.7%) | 150 (27.5%) |
| 3 Vehicles | 201 (35.4%) | 175 (32.1%) |
| 4 Vehicles | 29 (5.1%) | 5 (0.9%) |
| 5 or more Vehicles | 4 (0.7%) | 4 (0.7%) |
| Total | 568 (100.0%) | 546 (100.0%) |
Commute Time in Wabasha
The most frequently occuring commute durations in Wabasha are 5 to 9 minutes (238 commuters, 22.4%), 10 to 14 minutes (197 commuters, 18.5%), and 35 to 39 minutes (151 commuters, 14.2%).
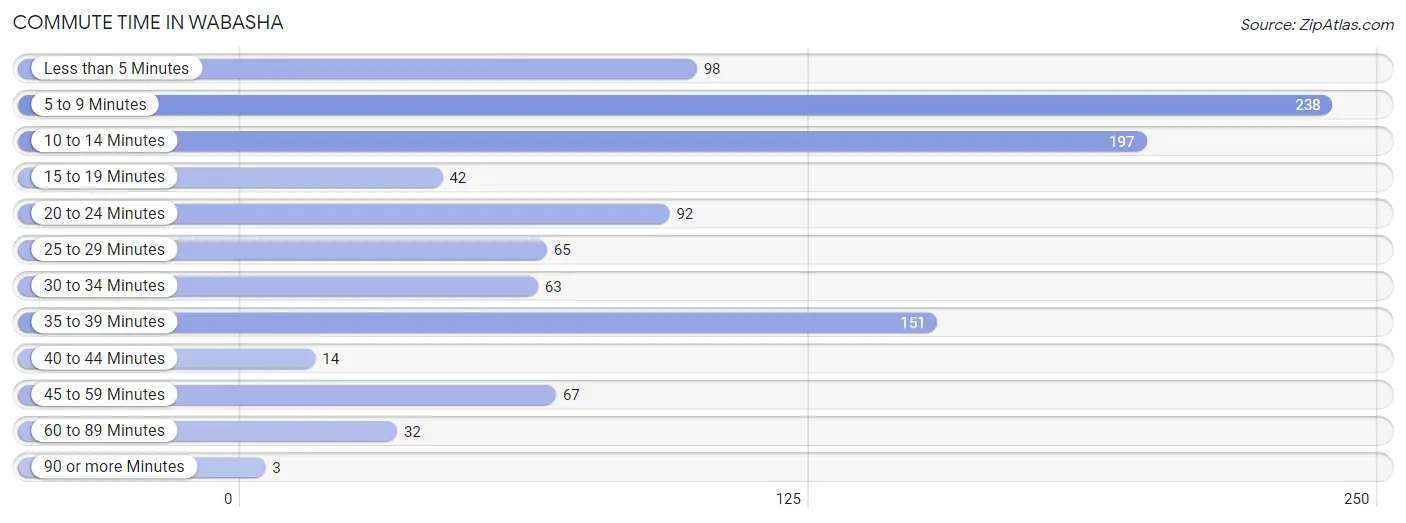
| Commute Time | # Commuters | % Commuters |
| Less than 5 Minutes | 98 | 9.2% |
| 5 to 9 Minutes | 238 | 22.4% |
| 10 to 14 Minutes | 197 | 18.5% |
| 15 to 19 Minutes | 42 | 4.0% |
| 20 to 24 Minutes | 92 | 8.7% |
| 25 to 29 Minutes | 65 | 6.1% |
| 30 to 34 Minutes | 63 | 5.9% |
| 35 to 39 Minutes | 151 | 14.2% |
| 40 to 44 Minutes | 14 | 1.3% |
| 45 to 59 Minutes | 67 | 6.3% |
| 60 to 89 Minutes | 32 | 3.0% |
| 90 or more Minutes | 3 | 0.3% |
Commute Time by Sex in Wabasha
The most common commute times in Wabasha are 35 to 39 minutes (151 commuters, 28.6%) for males and 5 to 9 minutes (144 commuters, 27.0%) for females.
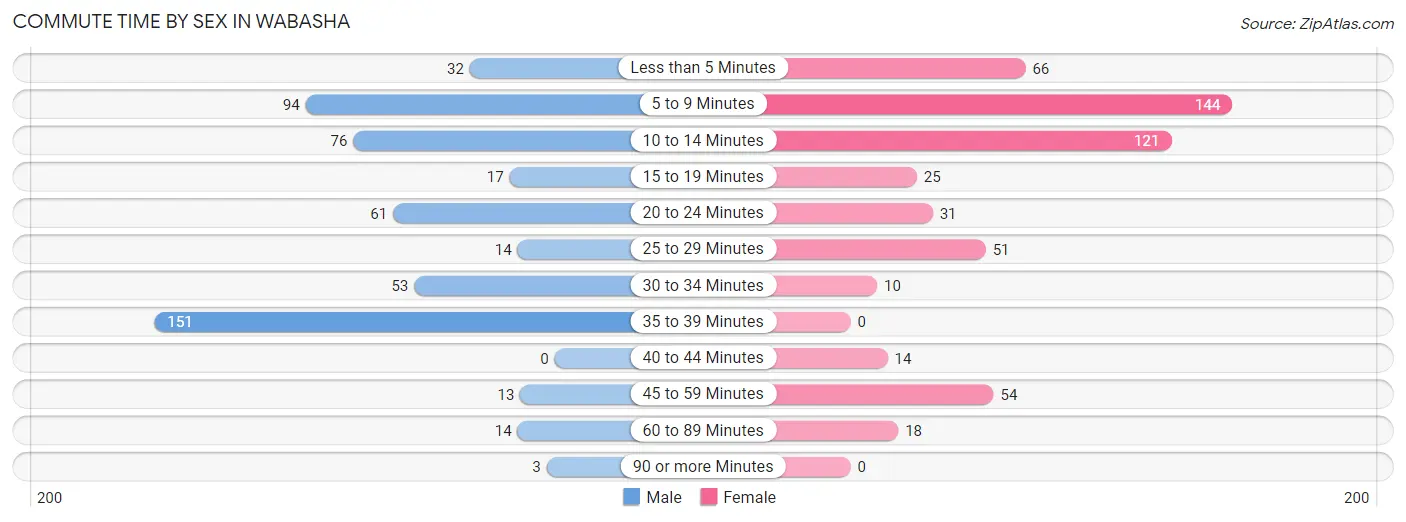
| Commute Time | Male | Female |
| Less than 5 Minutes | 32 (6.1%) | 66 (12.4%) |
| 5 to 9 Minutes | 94 (17.8%) | 144 (27.0%) |
| 10 to 14 Minutes | 76 (14.4%) | 121 (22.7%) |
| 15 to 19 Minutes | 17 (3.2%) | 25 (4.7%) |
| 20 to 24 Minutes | 61 (11.6%) | 31 (5.8%) |
| 25 to 29 Minutes | 14 (2.6%) | 51 (9.6%) |
| 30 to 34 Minutes | 53 (10.0%) | 10 (1.9%) |
| 35 to 39 Minutes | 151 (28.6%) | 0 (0.0%) |
| 40 to 44 Minutes | 0 (0.0%) | 14 (2.6%) |
| 45 to 59 Minutes | 13 (2.5%) | 54 (10.1%) |
| 60 to 89 Minutes | 14 (2.6%) | 18 (3.4%) |
| 90 or more Minutes | 3 (0.6%) | 0 (0.0%) |
Time of Departure to Work by Sex in Wabasha
The most frequent times of departure to work in Wabasha are 12:00 PM to 3:59 PM (114, 21.6%) for males and 5:30 AM to 5:59 AM (126, 23.6%) for females.
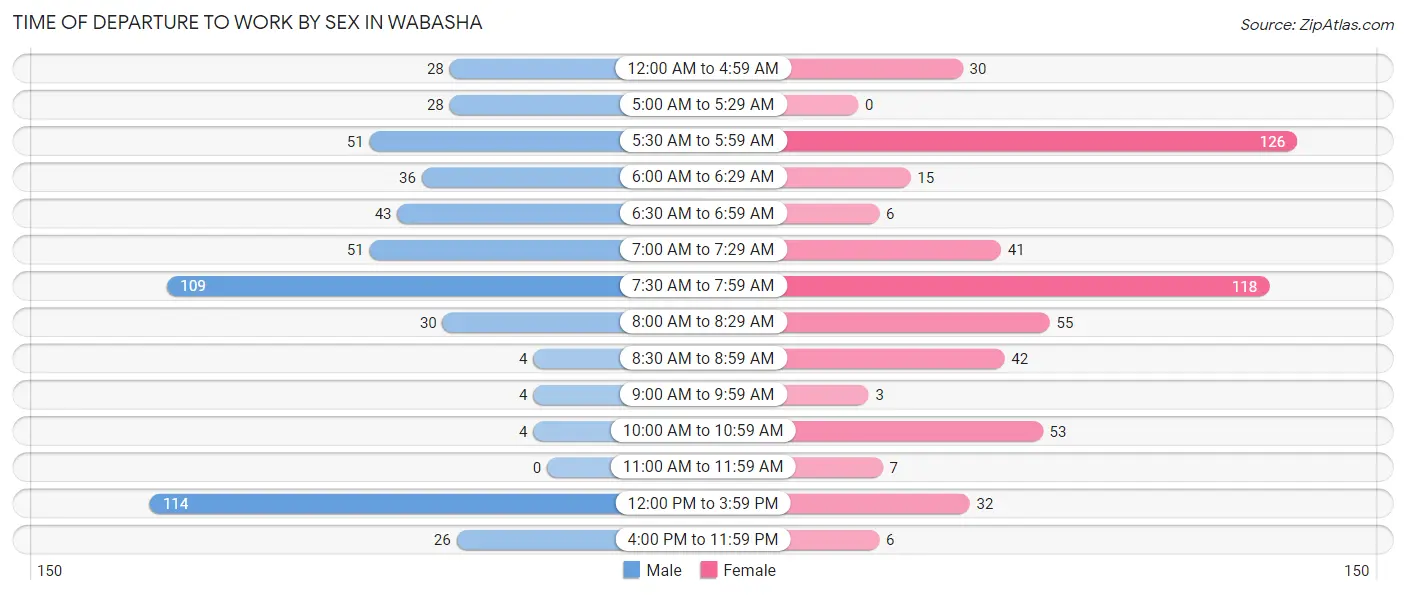
| Time of Departure | Male | Female |
| 12:00 AM to 4:59 AM | 28 (5.3%) | 30 (5.6%) |
| 5:00 AM to 5:29 AM | 28 (5.3%) | 0 (0.0%) |
| 5:30 AM to 5:59 AM | 51 (9.7%) | 126 (23.6%) |
| 6:00 AM to 6:29 AM | 36 (6.8%) | 15 (2.8%) |
| 6:30 AM to 6:59 AM | 43 (8.1%) | 6 (1.1%) |
| 7:00 AM to 7:29 AM | 51 (9.7%) | 41 (7.7%) |
| 7:30 AM to 7:59 AM | 109 (20.6%) | 118 (22.1%) |
| 8:00 AM to 8:29 AM | 30 (5.7%) | 55 (10.3%) |
| 8:30 AM to 8:59 AM | 4 (0.8%) | 42 (7.9%) |
| 9:00 AM to 9:59 AM | 4 (0.8%) | 3 (0.6%) |
| 10:00 AM to 10:59 AM | 4 (0.8%) | 53 (9.9%) |
| 11:00 AM to 11:59 AM | 0 (0.0%) | 7 (1.3%) |
| 12:00 PM to 3:59 PM | 114 (21.6%) | 32 (6.0%) |
| 4:00 PM to 11:59 PM | 26 (4.9%) | 6 (1.1%) |
| Total | 528 (100.0%) | 534 (100.0%) |
Housing Occupancy in Wabasha
Occupancy by Ownership in Wabasha
Of the total 1,238 dwellings in Wabasha, owner-occupied units account for 890 (71.9%), while renter-occupied units make up 348 (28.1%).
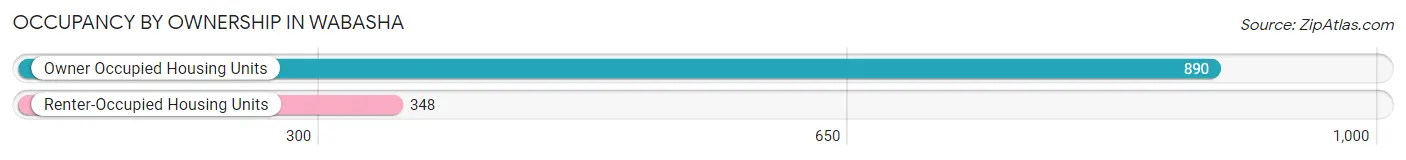
| Occupancy | # Housing Units | % Housing Units |
| Owner Occupied Housing Units | 890 | 71.9% |
| Renter-Occupied Housing Units | 348 | 28.1% |
| Total Occupied Housing Units | 1,238 | 100.0% |
Occupancy by Household Size in Wabasha
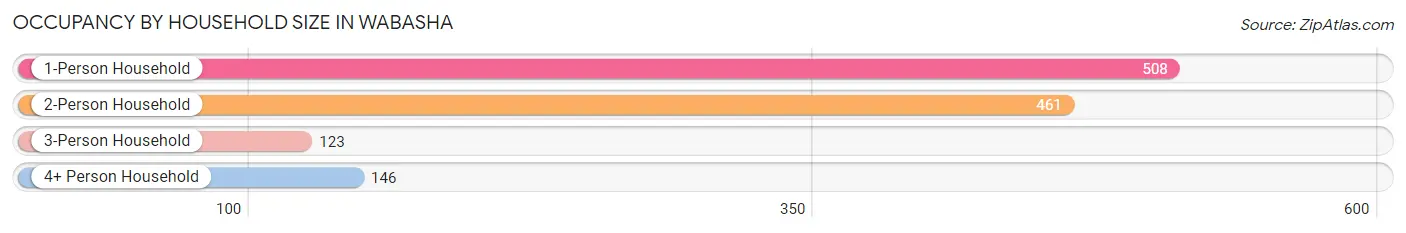
| Household Size | # Housing Units | % Housing Units |
| 1-Person Household | 508 | 41.0% |
| 2-Person Household | 461 | 37.2% |
| 3-Person Household | 123 | 9.9% |
| 4+ Person Household | 146 | 11.8% |
| Total Housing Units | 1,238 | 100.0% |
Occupancy by Ownership by Household Size in Wabasha
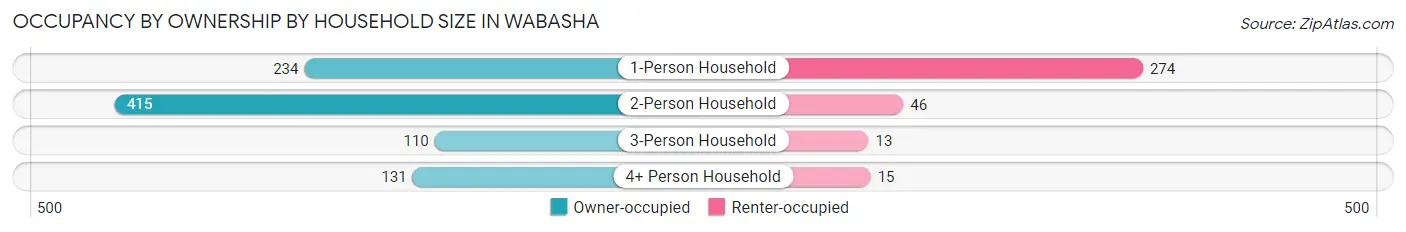
| Household Size | Owner-occupied | Renter-occupied |
| 1-Person Household | 234 (46.1%) | 274 (53.9%) |
| 2-Person Household | 415 (90.0%) | 46 (10.0%) |
| 3-Person Household | 110 (89.4%) | 13 (10.6%) |
| 4+ Person Household | 131 (89.7%) | 15 (10.3%) |
| Total Housing Units | 890 (71.9%) | 348 (28.1%) |
Occupancy by Educational Attainment in Wabasha
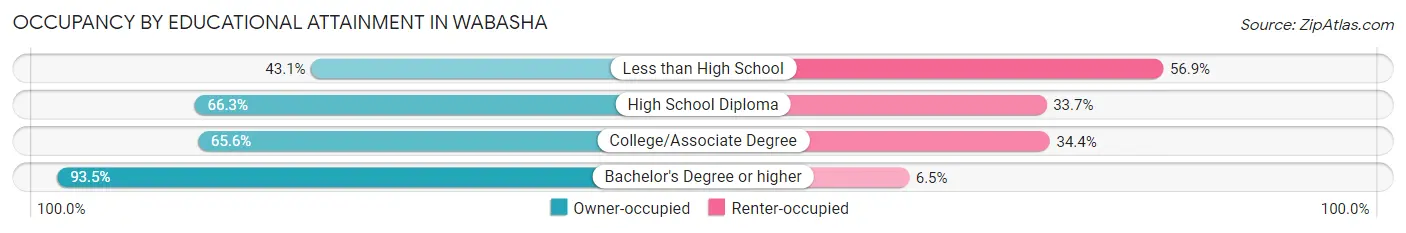
| Household Size | Owner-occupied | Renter-occupied |
| Less than High School | 22 (43.1%) | 29 (56.9%) |
| High School Diploma | 283 (66.3%) | 144 (33.7%) |
| College/Associate Degree | 296 (65.6%) | 155 (34.4%) |
| Bachelor's Degree or higher | 289 (93.5%) | 20 (6.5%) |
Occupancy by Age of Householder in Wabasha
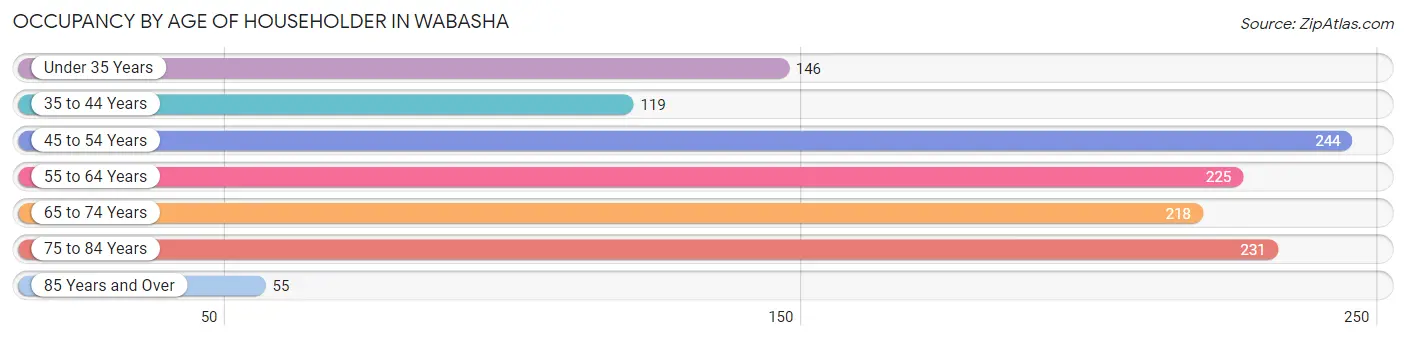
| Age Bracket | # Households | % Households |
| Under 35 Years | 146 | 11.8% |
| 35 to 44 Years | 119 | 9.6% |
| 45 to 54 Years | 244 | 19.7% |
| 55 to 64 Years | 225 | 18.2% |
| 65 to 74 Years | 218 | 17.6% |
| 75 to 84 Years | 231 | 18.7% |
| 85 Years and Over | 55 | 4.4% |
| Total | 1,238 | 100.0% |
Housing Finances in Wabasha
Median Income by Occupancy in Wabasha
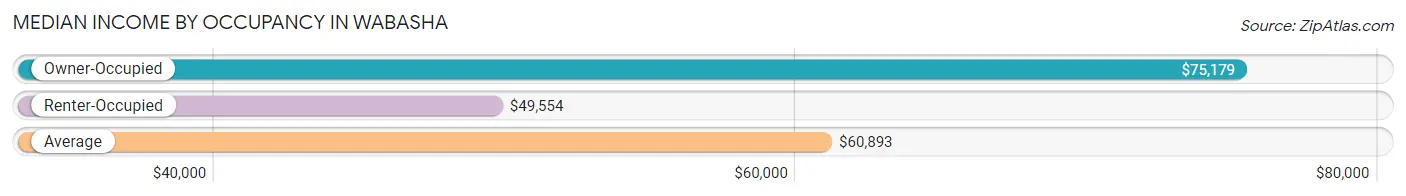
| Occupancy Type | # Households | Median Income |
| Owner-Occupied | 890 (71.9%) | $75,179 |
| Renter-Occupied | 348 (28.1%) | $49,554 |
| Average | 1,238 (100.0%) | $60,893 |
Occupancy by Householder Income Bracket in Wabasha
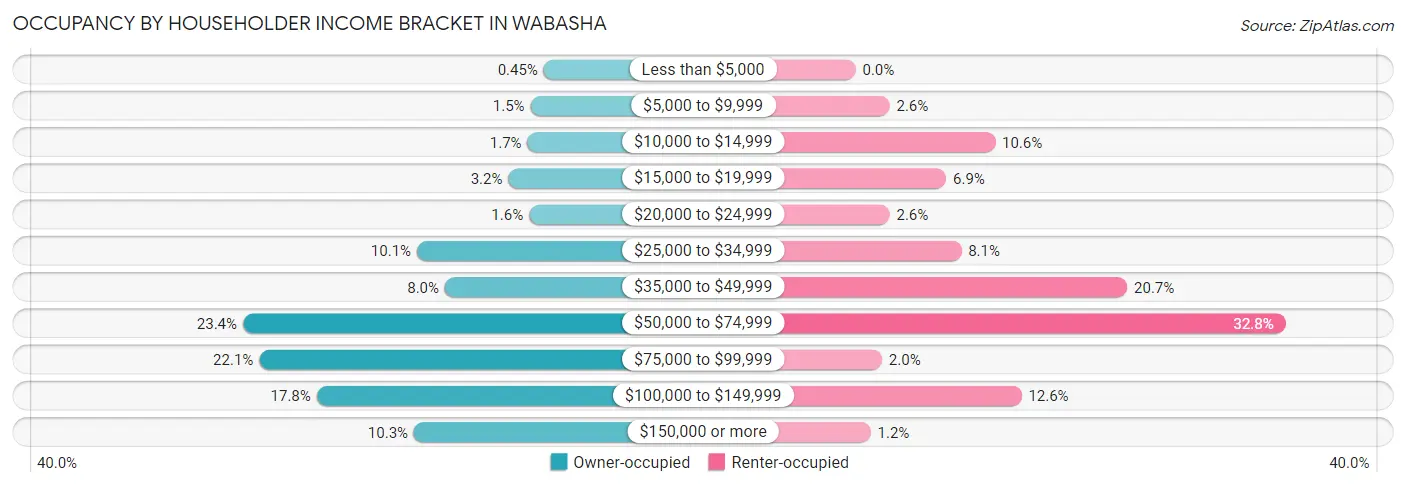
| Income Bracket | Owner-occupied | Renter-occupied |
| Less than $5,000 | 4 (0.4%) | 0 (0.0%) |
| $5,000 to $9,999 | 13 (1.5%) | 9 (2.6%) |
| $10,000 to $14,999 | 15 (1.7%) | 37 (10.6%) |
| $15,000 to $19,999 | 28 (3.2%) | 24 (6.9%) |
| $20,000 to $24,999 | 14 (1.6%) | 9 (2.6%) |
| $25,000 to $34,999 | 90 (10.1%) | 28 (8.1%) |
| $35,000 to $49,999 | 71 (8.0%) | 72 (20.7%) |
| $50,000 to $74,999 | 208 (23.4%) | 114 (32.8%) |
| $75,000 to $99,999 | 197 (22.1%) | 7 (2.0%) |
| $100,000 to $149,999 | 158 (17.7%) | 44 (12.6%) |
| $150,000 or more | 92 (10.3%) | 4 (1.1%) |
| Total | 890 (100.0%) | 348 (100.0%) |
Monthly Housing Cost Tiers in Wabasha
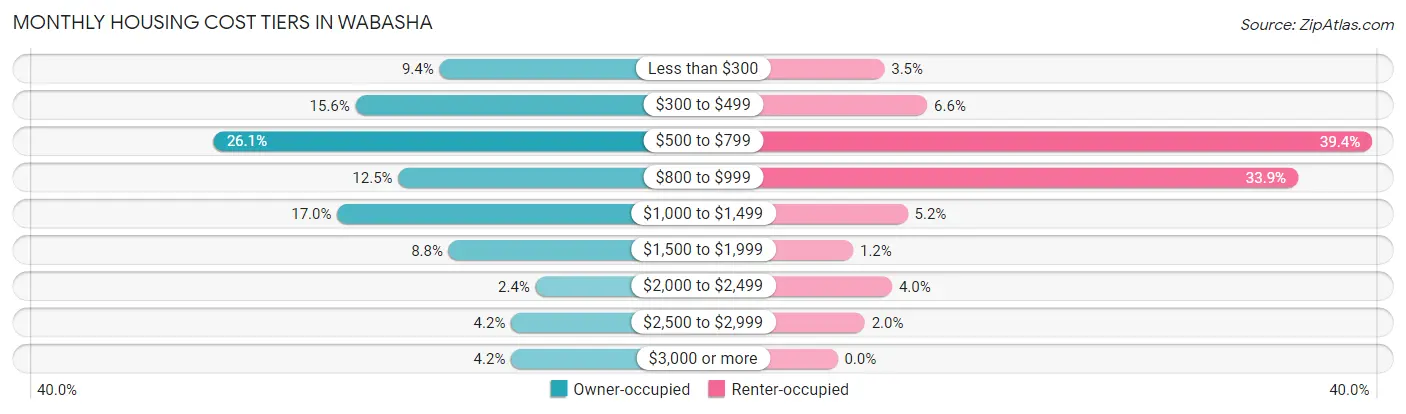
| Monthly Cost | Owner-occupied | Renter-occupied |
| Less than $300 | 84 (9.4%) | 12 (3.5%) |
| $300 to $499 | 139 (15.6%) | 23 (6.6%) |
| $500 to $799 | 232 (26.1%) | 137 (39.4%) |
| $800 to $999 | 111 (12.5%) | 118 (33.9%) |
| $1,000 to $1,499 | 151 (17.0%) | 18 (5.2%) |
| $1,500 to $1,999 | 78 (8.8%) | 4 (1.1%) |
| $2,000 to $2,499 | 21 (2.4%) | 14 (4.0%) |
| $2,500 to $2,999 | 37 (4.2%) | 7 (2.0%) |
| $3,000 or more | 37 (4.2%) | 0 (0.0%) |
| Total | 890 (100.0%) | 348 (100.0%) |
Physical Housing Characteristics in Wabasha
Housing Structures in Wabasha
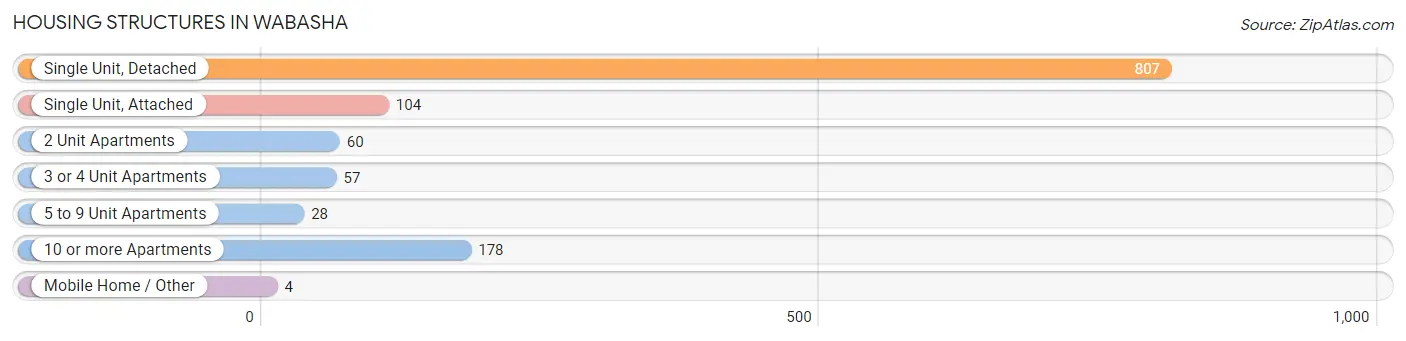
| Structure Type | # Housing Units | % Housing Units |
| Single Unit, Detached | 807 | 65.2% |
| Single Unit, Attached | 104 | 8.4% |
| 2 Unit Apartments | 60 | 4.9% |
| 3 or 4 Unit Apartments | 57 | 4.6% |
| 5 to 9 Unit Apartments | 28 | 2.3% |
| 10 or more Apartments | 178 | 14.4% |
| Mobile Home / Other | 4 | 0.3% |
| Total | 1,238 | 100.0% |
Housing Structures by Occupancy in Wabasha
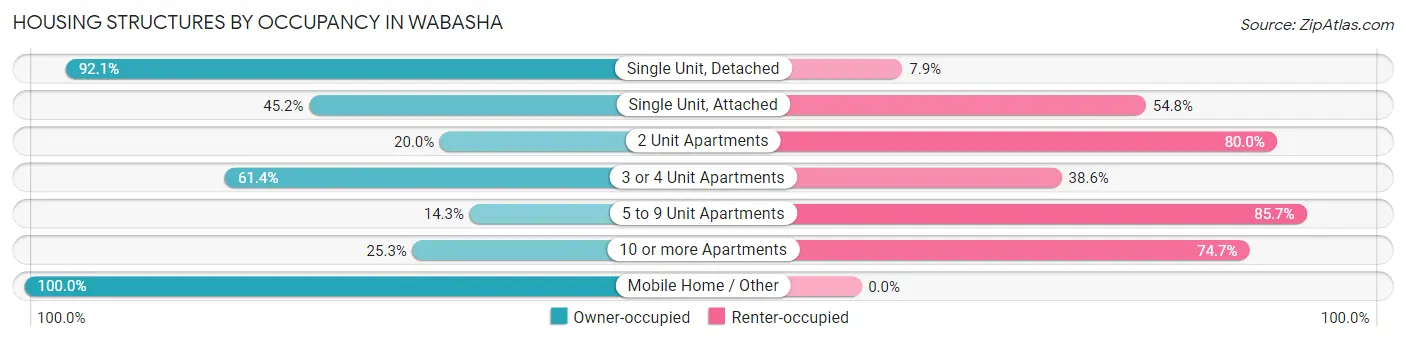
| Structure Type | Owner-occupied | Renter-occupied |
| Single Unit, Detached | 743 (92.1%) | 64 (7.9%) |
| Single Unit, Attached | 47 (45.2%) | 57 (54.8%) |
| 2 Unit Apartments | 12 (20.0%) | 48 (80.0%) |
| 3 or 4 Unit Apartments | 35 (61.4%) | 22 (38.6%) |
| 5 to 9 Unit Apartments | 4 (14.3%) | 24 (85.7%) |
| 10 or more Apartments | 45 (25.3%) | 133 (74.7%) |
| Mobile Home / Other | 4 (100.0%) | 0 (0.0%) |
| Total | 890 (71.9%) | 348 (28.1%) |
Housing Structures by Number of Rooms in Wabasha
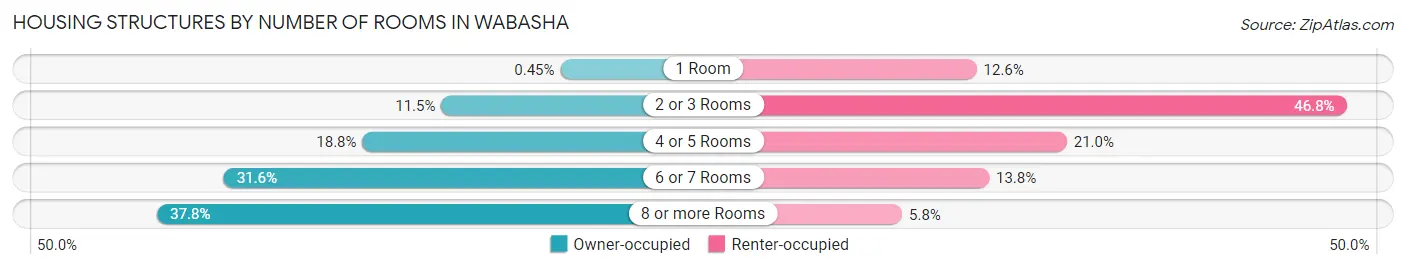
| Number of Rooms | Owner-occupied | Renter-occupied |
| 1 Room | 4 (0.4%) | 44 (12.6%) |
| 2 or 3 Rooms | 102 (11.5%) | 163 (46.8%) |
| 4 or 5 Rooms | 167 (18.8%) | 73 (21.0%) |
| 6 or 7 Rooms | 281 (31.6%) | 48 (13.8%) |
| 8 or more Rooms | 336 (37.8%) | 20 (5.8%) |
| Total | 890 (100.0%) | 348 (100.0%) |
Housing Structure by Heating Type in Wabasha
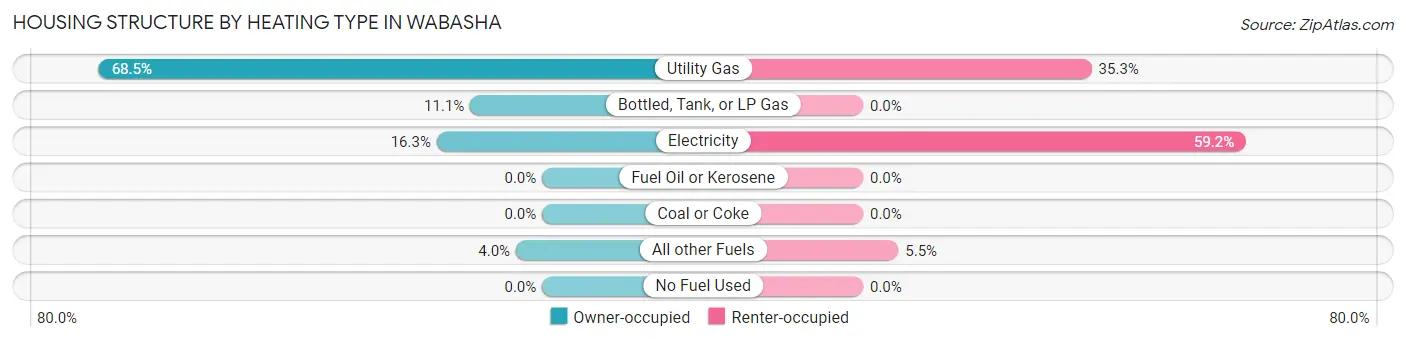
| Heating Type | Owner-occupied | Renter-occupied |
| Utility Gas | 610 (68.5%) | 123 (35.3%) |
| Bottled, Tank, or LP Gas | 99 (11.1%) | 0 (0.0%) |
| Electricity | 145 (16.3%) | 206 (59.2%) |
| Fuel Oil or Kerosene | 0 (0.0%) | 0 (0.0%) |
| Coal or Coke | 0 (0.0%) | 0 (0.0%) |
| All other Fuels | 36 (4.0%) | 19 (5.5%) |
| No Fuel Used | 0 (0.0%) | 0 (0.0%) |
| Total | 890 (100.0%) | 348 (100.0%) |
Household Vehicle Usage in Wabasha
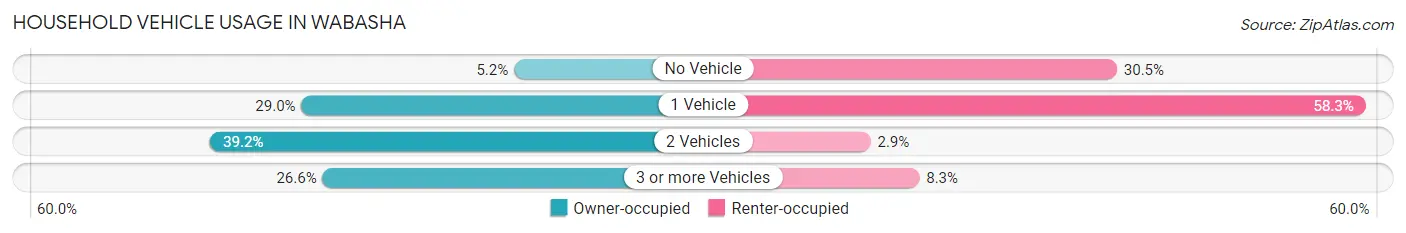
| Vehicles per Household | Owner-occupied | Renter-occupied |
| No Vehicle | 46 (5.2%) | 106 (30.5%) |
| 1 Vehicle | 258 (29.0%) | 203 (58.3%) |
| 2 Vehicles | 349 (39.2%) | 10 (2.9%) |
| 3 or more Vehicles | 237 (26.6%) | 29 (8.3%) |
| Total | 890 (100.0%) | 348 (100.0%) |
Real Estate & Mortgages in Wabasha
Real Estate and Mortgage Overview in Wabasha
| Characteristic | Without Mortgage | With Mortgage |
| Housing Units | 442 | 448 |
| Median Property Value | $186,000 | $205,100 |
| Median Household Income | $62,143 | $84 |
| Monthly Housing Costs | $497 | $37 |
| Real Estate Taxes | $2,103 | $38 |
Property Value by Mortgage Status in Wabasha
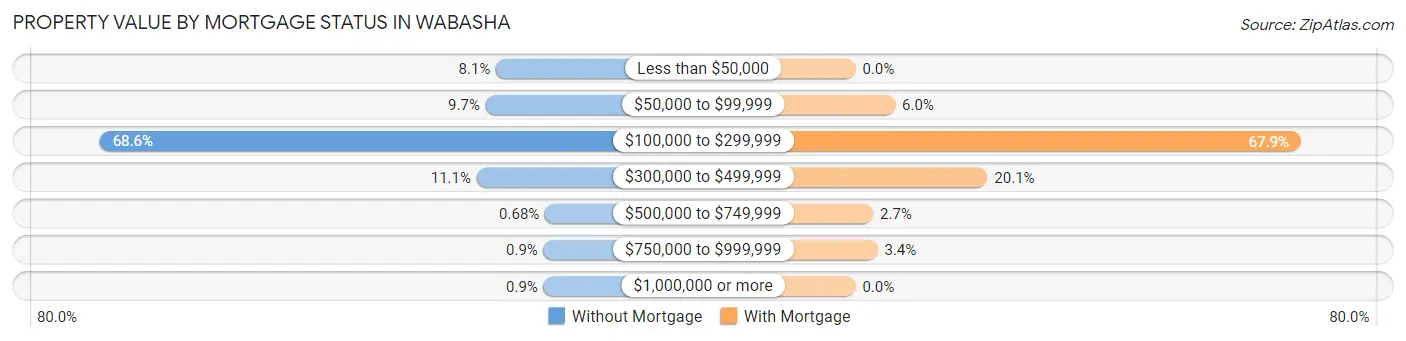
| Property Value | Without Mortgage | With Mortgage |
| Less than $50,000 | 36 (8.1%) | 0 (0.0%) |
| $50,000 to $99,999 | 43 (9.7%) | 27 (6.0%) |
| $100,000 to $299,999 | 303 (68.5%) | 304 (67.9%) |
| $300,000 to $499,999 | 49 (11.1%) | 90 (20.1%) |
| $500,000 to $749,999 | 3 (0.7%) | 12 (2.7%) |
| $750,000 to $999,999 | 4 (0.9%) | 15 (3.4%) |
| $1,000,000 or more | 4 (0.9%) | 0 (0.0%) |
| Total | 442 (100.0%) | 448 (100.0%) |
Household Income by Mortgage Status in Wabasha
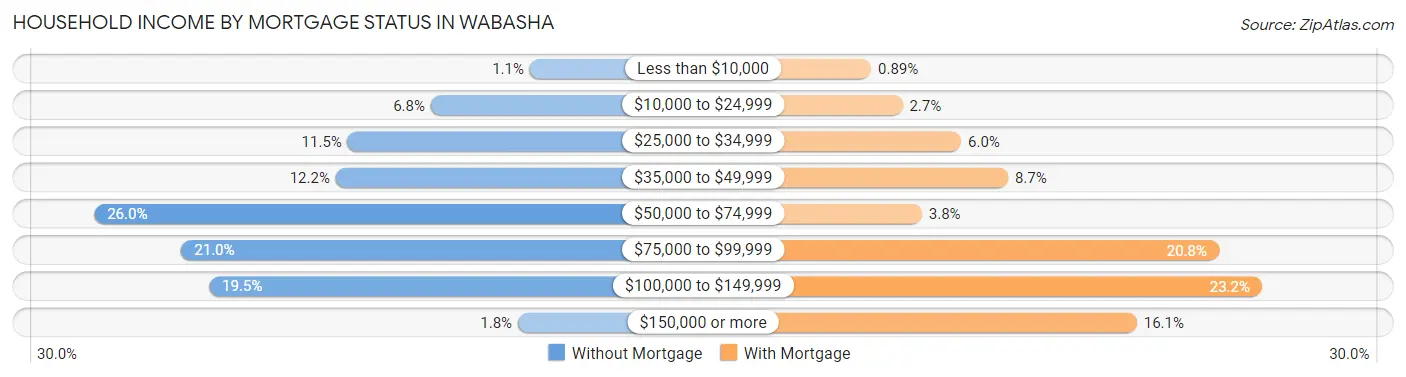
| Household Income | Without Mortgage | With Mortgage |
| Less than $10,000 | 5 (1.1%) | 4 (0.9%) |
| $10,000 to $24,999 | 30 (6.8%) | 12 (2.7%) |
| $25,000 to $34,999 | 51 (11.5%) | 27 (6.0%) |
| $35,000 to $49,999 | 54 (12.2%) | 39 (8.7%) |
| $50,000 to $74,999 | 115 (26.0%) | 17 (3.8%) |
| $75,000 to $99,999 | 93 (21.0%) | 93 (20.8%) |
| $100,000 to $149,999 | 86 (19.5%) | 104 (23.2%) |
| $150,000 or more | 8 (1.8%) | 72 (16.1%) |
| Total | 442 (100.0%) | 448 (100.0%) |
Property Value to Household Income Ratio in Wabasha
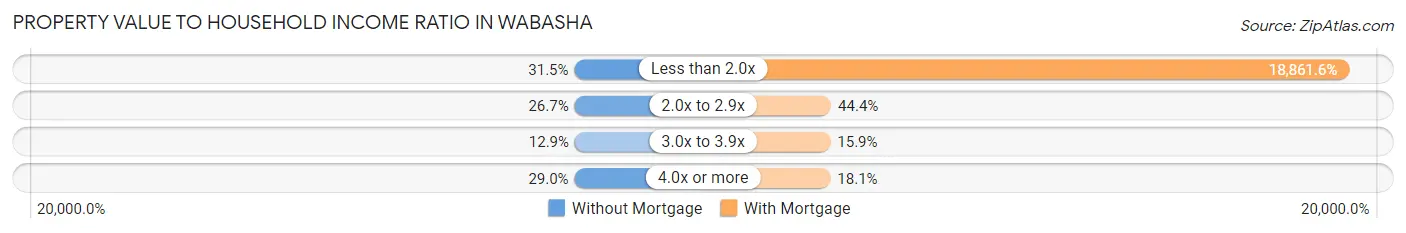
| Value-to-Income Ratio | Without Mortgage | With Mortgage |
| Less than 2.0x | 139 (31.5%) | 84,500 (18,861.6%) |
| 2.0x to 2.9x | 118 (26.7%) | 199 (44.4%) |
| 3.0x to 3.9x | 57 (12.9%) | 71 (15.9%) |
| 4.0x or more | 128 (29.0%) | 81 (18.1%) |
| Total | 442 (100.0%) | 448 (100.0%) |
Real Estate Taxes by Mortgage Status in Wabasha
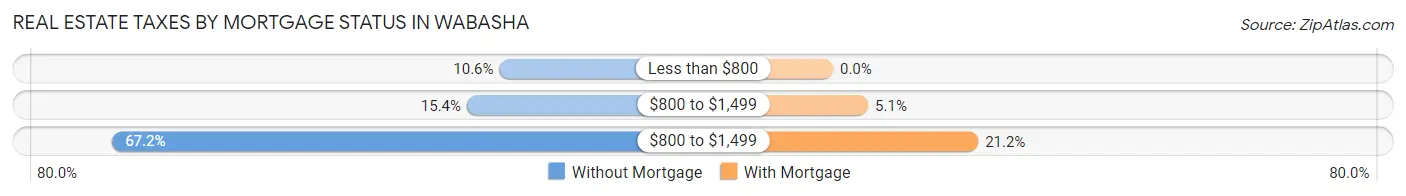
| Property Taxes | Without Mortgage | With Mortgage |
| Less than $800 | 47 (10.6%) | 0 (0.0%) |
| $800 to $1,499 | 68 (15.4%) | 23 (5.1%) |
| $800 to $1,499 | 297 (67.2%) | 95 (21.2%) |
| Total | 442 (100.0%) | 448 (100.0%) |
Health & Disability in Wabasha
Health Insurance Coverage by Age in Wabasha
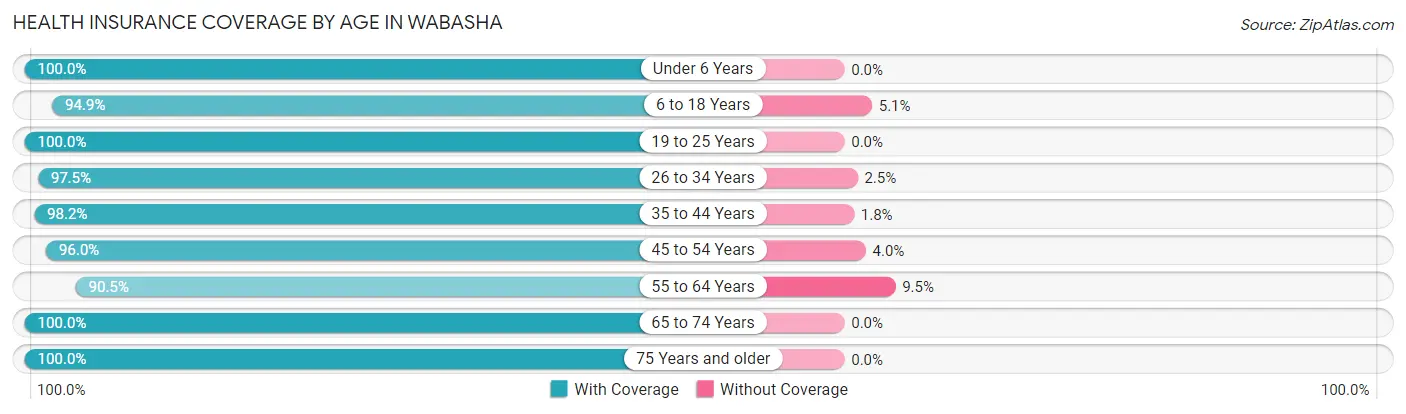
| Age Bracket | With Coverage | Without Coverage |
| Under 6 Years | 89 (100.0%) | 0 (0.0%) |
| 6 to 18 Years | 296 (94.9%) | 16 (5.1%) |
| 19 to 25 Years | 104 (100.0%) | 0 (0.0%) |
| 26 to 34 Years | 198 (97.5%) | 5 (2.5%) |
| 35 to 44 Years | 221 (98.2%) | 4 (1.8%) |
| 45 to 54 Years | 338 (96.0%) | 14 (4.0%) |
| 55 to 64 Years | 362 (90.5%) | 38 (9.5%) |
| 65 to 74 Years | 378 (100.0%) | 0 (0.0%) |
| 75 Years and older | 365 (100.0%) | 0 (0.0%) |
| Total | 2,351 (96.8%) | 77 (3.2%) |
Health Insurance Coverage by Citizenship Status in Wabasha
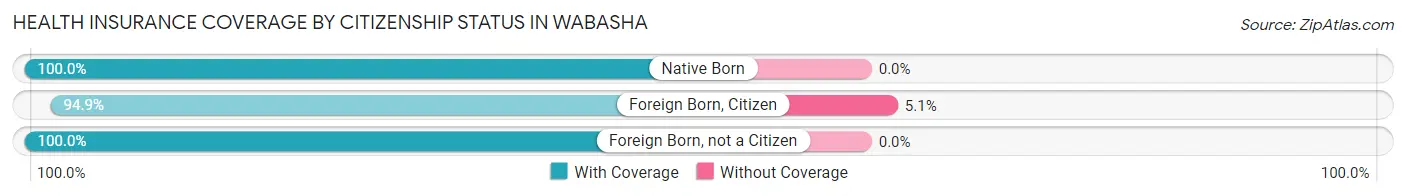
| Citizenship Status | With Coverage | Without Coverage |
| Native Born | 89 (100.0%) | 0 (0.0%) |
| Foreign Born, Citizen | 296 (94.9%) | 16 (5.1%) |
| Foreign Born, not a Citizen | 104 (100.0%) | 0 (0.0%) |
Health Insurance Coverage by Household Income in Wabasha
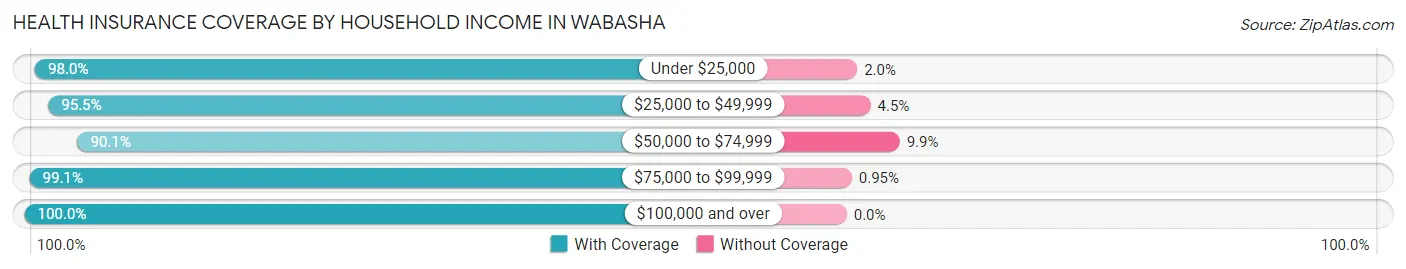
| Household Income | With Coverage | Without Coverage |
| Under $25,000 | 200 (98.0%) | 4 (2.0%) |
| $25,000 to $49,999 | 343 (95.5%) | 16 (4.5%) |
| $50,000 to $74,999 | 472 (90.1%) | 52 (9.9%) |
| $75,000 to $99,999 | 522 (99.1%) | 5 (0.9%) |
| $100,000 and over | 782 (100.0%) | 0 (0.0%) |
Public vs Private Health Insurance Coverage by Age in Wabasha
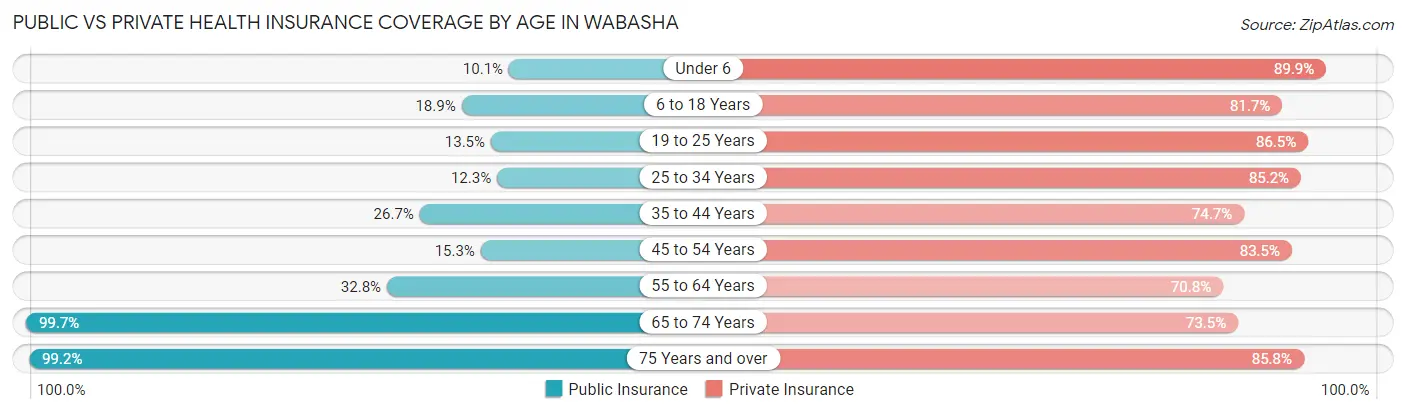
| Age Bracket | Public Insurance | Private Insurance |
| Under 6 | 9 (10.1%) | 80 (89.9%) |
| 6 to 18 Years | 59 (18.9%) | 255 (81.7%) |
| 19 to 25 Years | 14 (13.5%) | 90 (86.5%) |
| 25 to 34 Years | 25 (12.3%) | 173 (85.2%) |
| 35 to 44 Years | 60 (26.7%) | 168 (74.7%) |
| 45 to 54 Years | 54 (15.3%) | 294 (83.5%) |
| 55 to 64 Years | 131 (32.8%) | 283 (70.8%) |
| 65 to 74 Years | 377 (99.7%) | 278 (73.5%) |
| 75 Years and over | 362 (99.2%) | 313 (85.8%) |
| Total | 1,091 (44.9%) | 1,934 (79.6%) |
Disability Status by Sex by Age in Wabasha
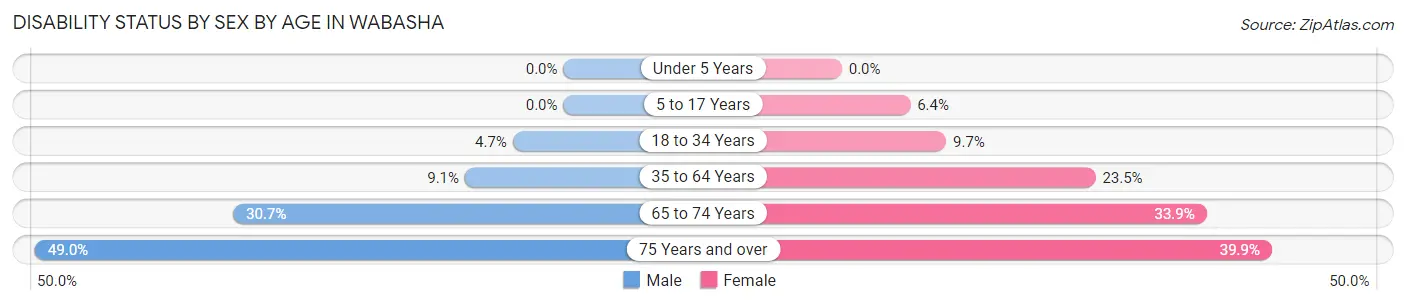
| Age Bracket | Male | Female |
| Under 5 Years | 0 (0.0%) | 0 (0.0%) |
| 5 to 17 Years | 0 (0.0%) | 8 (6.4%) |
| 18 to 34 Years | 7 (4.7%) | 18 (9.7%) |
| 35 to 64 Years | 47 (9.1%) | 109 (23.5%) |
| 65 to 74 Years | 57 (30.6%) | 65 (33.9%) |
| 75 Years and over | 77 (49.0%) | 83 (39.9%) |
Disability Class by Sex by Age in Wabasha
Disability Class: Hearing Difficulty
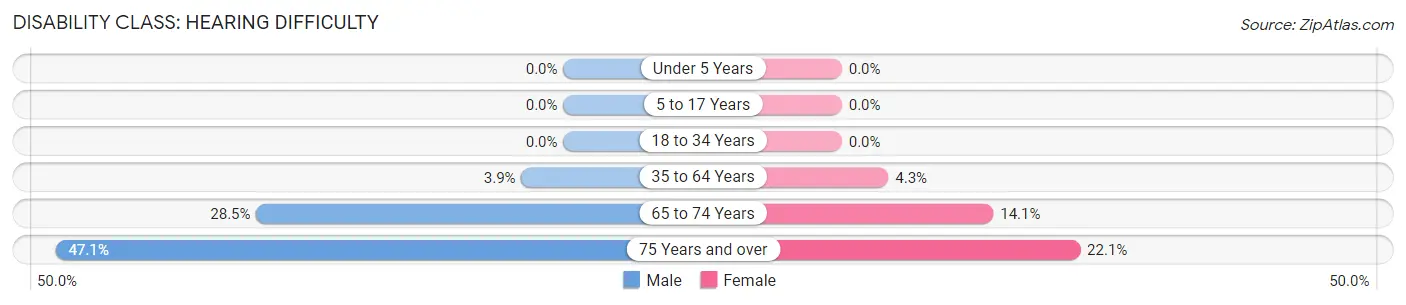
| Age Bracket | Male | Female |
| Under 5 Years | 0 (0.0%) | 0 (0.0%) |
| 5 to 17 Years | 0 (0.0%) | 0 (0.0%) |
| 18 to 34 Years | 0 (0.0%) | 0 (0.0%) |
| 35 to 64 Years | 20 (3.9%) | 20 (4.3%) |
| 65 to 74 Years | 53 (28.5%) | 27 (14.1%) |
| 75 Years and over | 74 (47.1%) | 46 (22.1%) |
Disability Class: Vision Difficulty
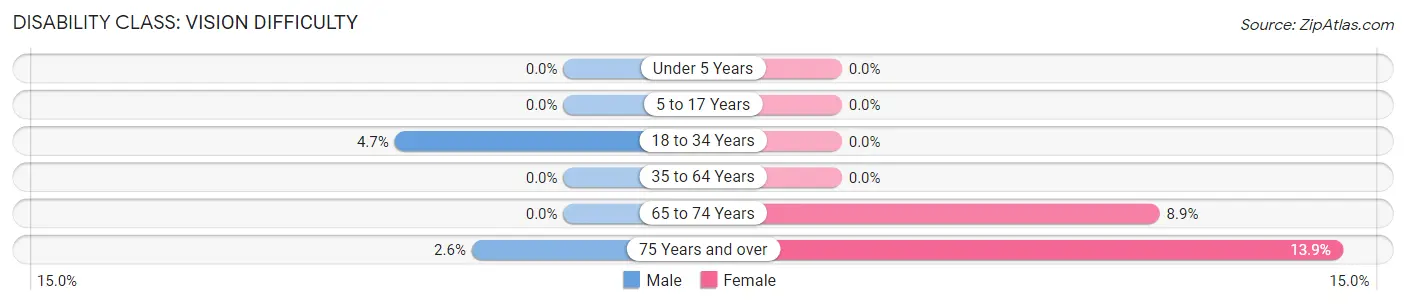
| Age Bracket | Male | Female |
| Under 5 Years | 0 (0.0%) | 0 (0.0%) |
| 5 to 17 Years | 0 (0.0%) | 0 (0.0%) |
| 18 to 34 Years | 7 (4.7%) | 0 (0.0%) |
| 35 to 64 Years | 0 (0.0%) | 0 (0.0%) |
| 65 to 74 Years | 0 (0.0%) | 17 (8.8%) |
| 75 Years and over | 4 (2.5%) | 29 (13.9%) |
Disability Class: Cognitive Difficulty
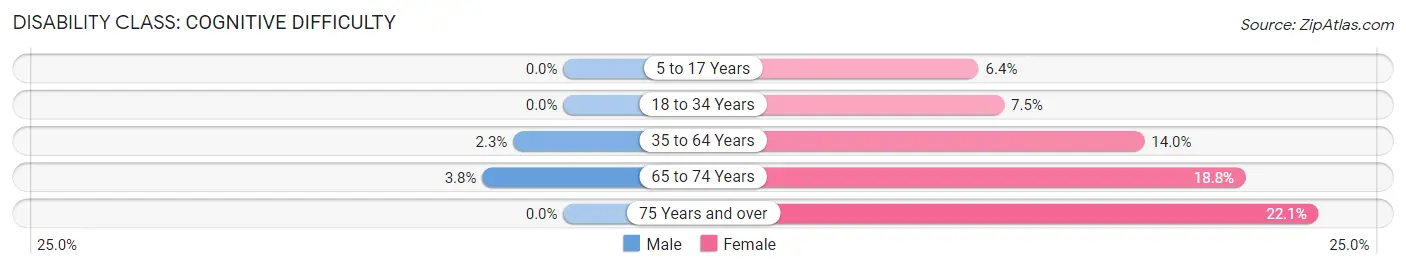
| Age Bracket | Male | Female |
| 5 to 17 Years | 0 (0.0%) | 8 (6.4%) |
| 18 to 34 Years | 0 (0.0%) | 14 (7.5%) |
| 35 to 64 Years | 12 (2.3%) | 65 (14.0%) |
| 65 to 74 Years | 7 (3.8%) | 36 (18.8%) |
| 75 Years and over | 0 (0.0%) | 46 (22.1%) |
Disability Class: Ambulatory Difficulty
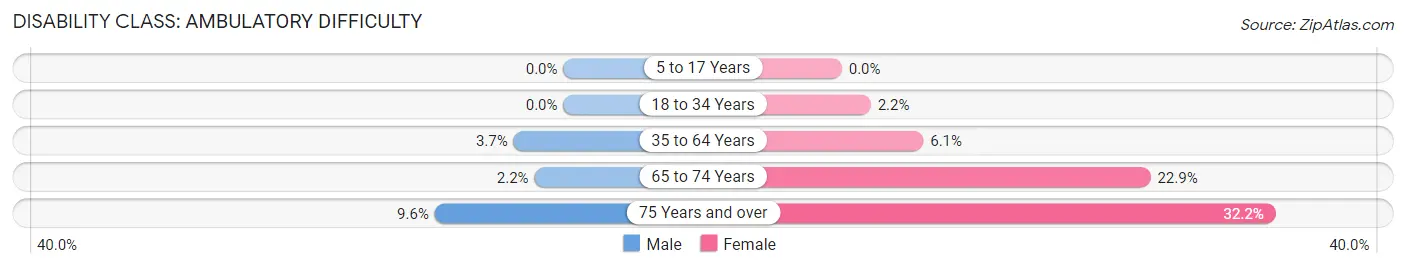
| Age Bracket | Male | Female |
| 5 to 17 Years | 0 (0.0%) | 0 (0.0%) |
| 18 to 34 Years | 0 (0.0%) | 4 (2.1%) |
| 35 to 64 Years | 19 (3.7%) | 28 (6.0%) |
| 65 to 74 Years | 4 (2.1%) | 44 (22.9%) |
| 75 Years and over | 15 (9.6%) | 67 (32.2%) |
Disability Class: Self-Care Difficulty
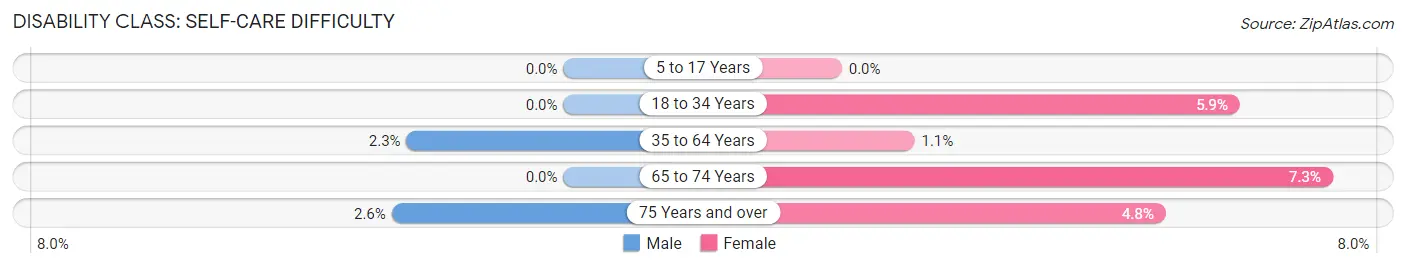
| Age Bracket | Male | Female |
| 5 to 17 Years | 0 (0.0%) | 0 (0.0%) |
| 18 to 34 Years | 0 (0.0%) | 11 (5.9%) |
| 35 to 64 Years | 12 (2.3%) | 5 (1.1%) |
| 65 to 74 Years | 0 (0.0%) | 14 (7.3%) |
| 75 Years and over | 4 (2.5%) | 10 (4.8%) |
Technology Access in Wabasha
Computing Device Access in Wabasha
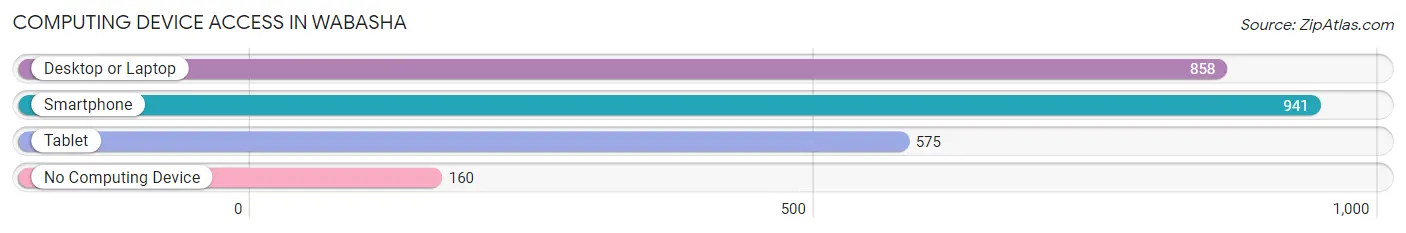
| Device Type | # Households | % Households |
| Desktop or Laptop | 858 | 69.3% |
| Smartphone | 941 | 76.0% |
| Tablet | 575 | 46.5% |
| No Computing Device | 160 | 12.9% |
| Total | 1,238 | 100.0% |
Internet Access in Wabasha
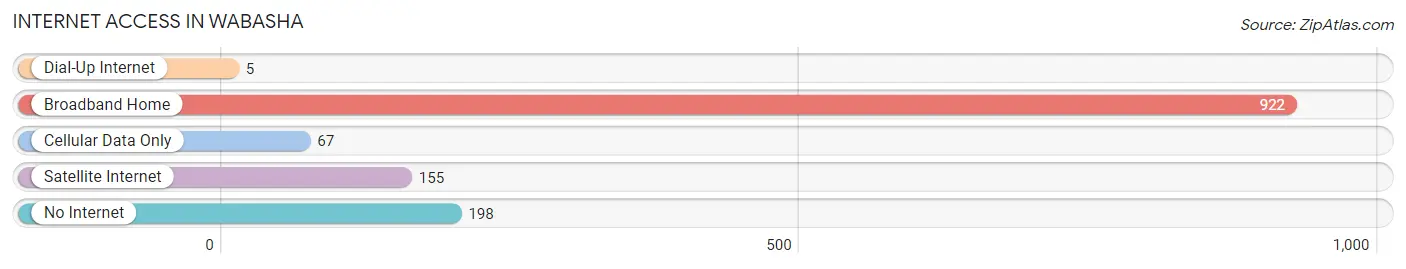
| Internet Type | # Households | % Households |
| Dial-Up Internet | 5 | 0.4% |
| Broadband Home | 922 | 74.5% |
| Cellular Data Only | 67 | 5.4% |
| Satellite Internet | 155 | 12.5% |
| No Internet | 198 | 16.0% |
| Total | 1,238 | 100.0% |
Wabasha Summary
Wabasha, Minnesota is a small city located in the southeastern corner of the state, along the Mississippi River. It is the county seat of Wabasha County and has a population of 2,521 as of the 2010 census. The city is known for its historic downtown, which is listed on the National Register of Historic Places, and its scenic views of the Mississippi River.
Geography
Wabasha is located in the southeastern corner of Minnesota, along the Mississippi River. It is situated at the intersection of U.S. Route 61 and Minnesota State Highway 60. The city is located approximately 50 miles southeast of the Twin Cities of Minneapolis and St. Paul. The city is surrounded by rolling hills and bluffs, and is situated on the banks of the Mississippi River.
History
The area that is now Wabasha was first settled in 1854 by a group of settlers from Wisconsin. The city was named after the Wabasha Indians, who were a part of the Sioux Nation. The city was officially incorporated in 1858.
In the late 19th century, Wabasha was a major port on the Mississippi River, and was home to a number of lumber mills and other industries. The city was also home to a number of saloons and brothels, which were popular with riverboat crews.
In the early 20th century, Wabasha was a popular tourist destination, and was home to a number of resorts and hotels. The city was also home to a number of movie theaters, which were popular with locals and tourists alike.
Economy
The economy of Wabasha is largely based on tourism and agriculture. The city is home to a number of tourist attractions, including the National Eagle Center, the Wabasha Street Caves, and the Wabasha County Historical Society. The city is also home to a number of wineries and breweries, which are popular with tourists.
Agriculture is also an important part of the local economy. The city is home to a number of farms, which produce a variety of crops, including corn, soybeans, and wheat.
Demographics
As of the 2010 census, the population of Wabasha was 2,521. The racial makeup of the city was 97.2% White, 0.7% African American, 0.3% Native American, 0.3% Asian, 0.1% Pacific Islander, 0.3% from other races, and 1.2% from two or more races. Hispanic or Latino of any race were 1.2% of the population.
The median household income in Wabasha was $41,944, and the median family income was $50,938. The per capita income for the city was $20,945. About 8.2% of families and 10.3% of the population were below the poverty line, including 14.2% of those under age 18 and 8.2% of those age 65 or over.
Conclusion
Wabasha, Minnesota is a small city located in the southeastern corner of the state, along the Mississippi River. It is the county seat of Wabasha County and has a population of 2,521 as of the 2010 census. The city is known for its historic downtown, which is listed on the National Register of Historic Places, and its scenic views of the Mississippi River. The economy of Wabasha is largely based on tourism and agriculture, and the city is home to a number of tourist attractions, wineries, and breweries. The racial makeup of the city is predominantly White, with a small percentage of African American, Native American, Asian, and Pacific Islander residents. The median household income in Wabasha is $41,944, and the median family income is $50,938.
Common Questions
What is Per Capita Income in Wabasha?
Per Capita income in Wabasha is $41,276.
What is the Median Family Income in Wabasha?
Median Family Income in Wabasha is $85,677.
What is the Median Household income in Wabasha?
Median Household Income in Wabasha is $60,893.
What is Income or Wage Gap in Wabasha?
Income or Wage Gap in Wabasha is 30.6%.
Women in Wabasha earn 69.4 cents for every dollar earned by a man.
What is Family Income Deficit in Wabasha?
Family Income Deficit in Wabasha is $9,193.
Families that are below poverty line in Wabasha earn $9,193 less on average than the poverty threshold level.
What is Inequality or Gini Index in Wabasha?
Inequality or Gini Index in Wabasha is 0.41.
What is the Total Population of Wabasha?
Total Population of Wabasha is 2,560.
What is the Total Male Population of Wabasha?
Total Male Population of Wabasha is 1,280.
What is the Total Female Population of Wabasha?
Total Female Population of Wabasha is 1,280.
What is the Ratio of Males per 100 Females in Wabasha?
There are 100.00 Males per 100 Females in Wabasha.
What is the Ratio of Females per 100 Males in Wabasha?
There are 100.00 Females per 100 Males in Wabasha.
What is the Median Population Age in Wabasha?
Median Population Age in Wabasha is 53.9 Years.
What is the Average Family Size in Wabasha
Average Family Size in Wabasha is 2.5 People.
What is the Average Household Size in Wabasha
Average Household Size in Wabasha is 1.9 People.
How Large is the Labor Force in Wabasha?
There are 1,180 People in the Labor Forcein in Wabasha.
What is the Percentage of People in the Labor Force in Wabasha?
52.3% of People are in the Labor Force in Wabasha.
What is the Unemployment Rate in Wabasha?
Unemployment Rate in Wabasha is 3.8%.