Cities with the Highest Percentage of Chilean Population in Minnesota

RELATED REPORTS & OPTIONS

Chilean
Population
Families and Households
Female Fertility
Female Fertility (Unmarried)
Race (Community Size)
Race (Percentage)
Ancestry (Community Size)
AfghanAfricanAlaska NativeAlaskan AthabascanAlbanianAleutAlsatianAmericanApacheArabArapahoArgentineanArmenianAssyrian / Chaldean / SyriacAustralianAustrianBahamianBangladeshiBarbadianBasqueBelgianBelizeanBermudanBhutaneseBlackfeetBolivianBrazilianBritishBritish West IndianBulgarianBurmeseCajunCambodianCanadianCape VerdeanCarpatho RusynCelticCentral AmericanCentral American IndianCherokeeCheyenneChickasawChileanChineseChippewaChoctawColombianColvilleComancheCosta RicanCreeCreekCroatianCrowCubanCypriotCzechCzechoslovakianDanishDelawareDominicanDutchDutch West IndianEastern EuropeanEcuadorianEgyptianEnglishEstonianEthiopianEuropeanFijianFilipinoFinnishFrenchFrench American IndianFrench CanadianGermanGerman RussianGhanaianGreekGuamanian / ChamorroGuatemalanGuyaneseHaitianHmongHonduranHopiHoumaHungarianIcelanderIndian (Asian)IndonesianInupiatIranianIraqiIrishIroquoisIsraeliItalianJamaicanJapaneseJordanianKenyanKiowaKoreanLaotianLatvianLebaneseLiberianLithuanianLumbeeLuxembourgerMacedonianMalaysianMalteseMarshalleseMenomineeMexicanMexican American IndianMongolianMoroccanNative HawaiianNavajoNepaleseNew ZealanderNicaraguanNigerianNorthern EuropeanNorwegianOkinawanOsageOttawaPaiutePakistaniPalestinianPanamanianParaguayanPennsylvania GermanPeruvianPimaPolishPortuguesePotawatomiPuebloPuerto RicanPuget Sound SalishRomanianRussianSalvadoranSamoanScandinavianScotch-IrishScottishSeminoleSenegaleseSerbianShoshoneSierra LeoneanSiouxSlavicSlovakSloveneSomaliSouth AfricanSouth AmericanSouth American IndianSoviet UnionSpaniardSpanishSpanish AmericanSpanish American IndianSri LankanSubsaharan AfricanSudaneseSwedishSwissSyrianTaiwaneseThaiTlingit-HaidaTohono O'OdhamTonganTrinidadian and TobagonianTsimshianTurkishU.S. Virgin IslanderUgandanUkrainianUruguayanUteVenezuelanVietnameseWelshWest IndianYakamaYaquiYugoslavianYumanYup'ikZimbabwean
Ancestry (Percentage)
AfghanAfricanAlaska NativeAlaskan AthabascanAlbanianAleutAlsatianAmericanApacheArabArapahoArgentineanArmenianAssyrian / Chaldean / SyriacAustralianAustrianBahamianBangladeshiBarbadianBasqueBelgianBelizeanBermudanBhutaneseBlackfeetBolivianBrazilianBritishBritish West IndianBulgarianBurmeseCajunCambodianCanadianCape VerdeanCarpatho RusynCelticCentral AmericanCentral American IndianCherokeeCheyenneChickasawChileanChineseChippewaChoctawColombianColvilleComancheCosta RicanCreeCreekCroatianCrowCubanCypriotCzechCzechoslovakianDanishDelawareDominicanDutchDutch West IndianEastern EuropeanEcuadorianEgyptianEnglishEstonianEthiopianEuropeanFijianFilipinoFinnishFrenchFrench American IndianFrench CanadianGermanGerman RussianGhanaianGreekGuamanian / ChamorroGuatemalanGuyaneseHaitianHmongHonduranHopiHoumaHungarianIcelanderIndian (Asian)IndonesianInupiatIranianIraqiIrishIroquoisIsraeliItalianJamaicanJapaneseJordanianKenyanKiowaKoreanLaotianLatvianLebaneseLiberianLithuanianLumbeeLuxembourgerMacedonianMalaysianMalteseMarshalleseMenomineeMexicanMexican American IndianMongolianMoroccanNative HawaiianNavajoNepaleseNew ZealanderNicaraguanNigerianNorthern EuropeanNorwegianOkinawanOsageOttawaPaiutePakistaniPalestinianPanamanianParaguayanPennsylvania GermanPeruvianPimaPolishPortuguesePotawatomiPuebloPuerto RicanPuget Sound SalishRomanianRussianSalvadoranSamoanScandinavianScotch-IrishScottishSeminoleSenegaleseSerbianShoshoneSierra LeoneanSiouxSlavicSlovakSloveneSomaliSouth AfricanSouth AmericanSouth American IndianSoviet UnionSpaniardSpanishSpanish AmericanSpanish American IndianSri LankanSubsaharan AfricanSudaneseSwedishSwissSyrianTaiwaneseThaiTlingit-HaidaTohono O'OdhamTonganTrinidadian and TobagonianTsimshianTurkishU.S. Virgin IslanderUgandanUkrainianUruguayanUteVenezuelanVietnameseWelshWest IndianYakamaYaquiYugoslavianYumanYup'ikZimbabwean
Immigrant Origin (Total)
AfghanistanAfricaAlbaniaArgentinaArmeniaAsiaAustraliaAustriaAzoresBahamasBangladeshBarbadosBelarusBelgiumBelizeBoliviaBosnia and HerzegovinaBrazilBulgariaBurma / MyanmarCabo VerdeCambodiaCameroonCanadaCaribbeanCentral AmericaChileChinaColombiaCongoCosta RicaCroatiaCubaCzechoslovakiaDenmarkDominicaDominican RepublicEastern AfricaEastern AsiaEastern EuropeEcuadorEgyptEl SalvadorEnglandEritreaEthiopiaEuropeFijiFranceGermanyGhanaGreeceGrenadaGuatemalaGuyanaHaitiHondurasHong KongHungaryIndiaIndonesiaIranIraqIrelandIsraelItalyJamaicaJapanJordanKazakhstanKenyaKoreaKuwaitLaosLatin AmericaLatviaLebanonLiberiaLithuaniaMalaysiaMexicoMicronesiaMiddle AfricaMoldovaMoroccoNepalNetherlandsNicaraguaNigeriaNorth MacedoniaNorthern AfricaNorthern EuropeNorwayOceaniaPakistanPanamaPeruPhilippinesPolandPortugalRomaniaRussiaSaudi ArabiaScotlandSenegalSerbiaSierra LeoneSingaporeSomaliaSouth AfricaSouth AmericaSouth Central AsiaSouth Eastern AsiaSouthern EuropeSpainSri LankaSt. Vincent and the GrenadinesSudanSwedenSwitzerlandSyriaTaiwanThailandTrinidad and TobagoTurkeyUgandaUkraineUruguayUzbekistanVenezuelaVietnamWest IndiesWestern AfricaWestern AsiaWestern EuropeYemenZaireZimbabwe
Immigrant Origin (Percentage)
AfghanistanAfricaAlbaniaArgentinaArmeniaAsiaAustraliaAustriaAzoresBahamasBangladeshBarbadosBelarusBelgiumBelizeBoliviaBosnia and HerzegovinaBrazilBulgariaBurma / MyanmarCabo VerdeCambodiaCameroonCanadaCaribbeanCentral AmericaChileChinaColombiaCongoCosta RicaCroatiaCubaCzechoslovakiaDenmarkDominicaDominican RepublicEastern AfricaEastern AsiaEastern EuropeEcuadorEgyptEl SalvadorEnglandEritreaEthiopiaEuropeFijiFranceGermanyGhanaGreeceGrenadaGuatemalaGuyanaHaitiHondurasHong KongHungaryIndiaIndonesiaIranIraqIrelandIsraelItalyJamaicaJapanJordanKazakhstanKenyaKoreaKuwaitLaosLatin AmericaLatviaLebanonLiberiaLithuaniaMalaysiaMexicoMicronesiaMiddle AfricaMoldovaMoroccoNepalNetherlandsNicaraguaNigeriaNorth MacedoniaNorthern AfricaNorthern EuropeNorwayOceaniaPakistanPanamaPeruPhilippinesPolandPortugalRomaniaRussiaSaudi ArabiaScotlandSenegalSerbiaSierra LeoneSingaporeSomaliaSouth AfricaSouth AmericaSouth Central AsiaSouth Eastern AsiaSouthern EuropeSpainSri LankaSt. Vincent and the GrenadinesSudanSwedenSwitzerlandSyriaTaiwanThailandTrinidad and TobagoTurkeyUgandaUkraineUruguayUzbekistanVenezuelaVietnamWest IndiesWestern AfricaWestern AsiaWestern EuropeYemenZaireZimbabwe
Income
Income (Families)
Income (Households)
Poverty
Poverty (Families)
Unemployment
Employment Occupations
Employment Industries
Employer Class
Commute Time
Commute Means
School Enrollment
Education by Degree Field
Occupancy
Finances
Physical Characteristics
Minnesota
Compare Cities
Comparison Subject

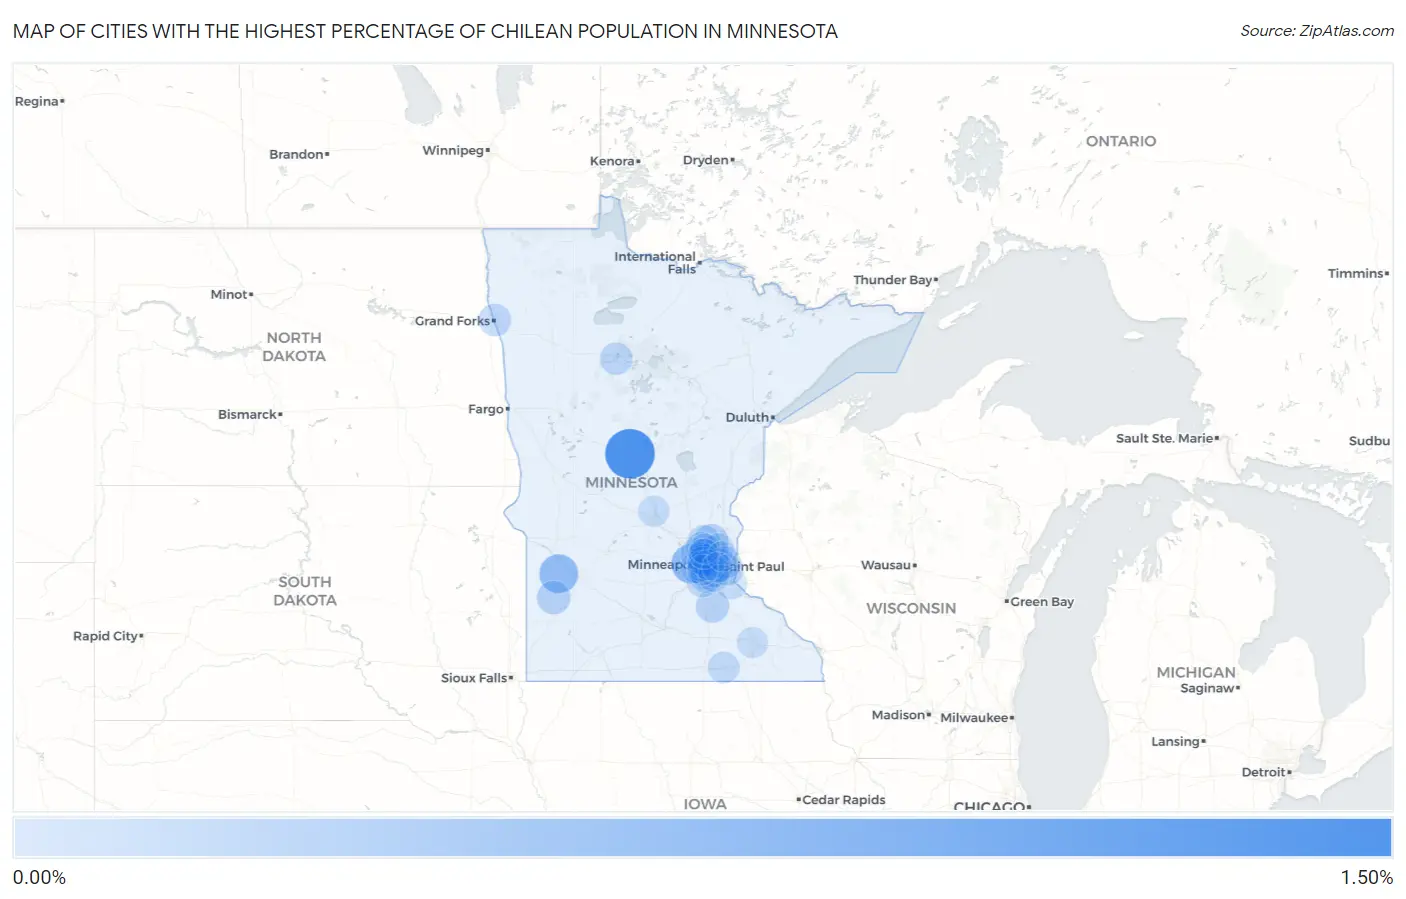
Map of Cities with the Highest Percentage of Chilean Population in Minnesota

0.00%
1.50%
Cities with the Highest Percentage of Chilean Population in Minnesota Map

Cities with the Highest Percentage of Chilean Population in Minnesota

City Chilean vs State vs National
1.Motley1.24%0.026%(+1.21)#10.055%(+1.18)#108
2.Long Lake0.58%0.026%(+0.558)#20.055%(+0.529)#291
3.Boyd0.53%0.026%(+0.509)#30.055%(+0.480)#316
4.Brooklyn Center0.29%0.026%(+0.267)#40.055%(+0.238)#557
5.Mounds View0.29%0.026%(+0.264)#50.055%(+0.235)#566
6.Ham Lake0.26%0.026%(+0.235)#60.055%(+0.206)#627
7.Richfield0.26%0.026%(+0.232)#70.055%(+0.203)#636
8.Minneota0.21%0.026%(+0.186)#80.055%(+0.156)#743
9.Northfield0.19%0.026%(+0.159)#90.055%(+0.130)#815
10.New Hope0.18%0.026%(+0.155)#100.055%(+0.125)#832
11.Maplewood0.16%0.026%(+0.139)#110.055%(+0.109)#884
12.Bloomington0.16%0.026%(+0.133)#120.055%(+0.104)#902
13.Bemidji0.15%0.026%(+0.123)#130.055%(+0.094)#932
14.East Grand Forks0.14%0.026%(+0.117)#140.055%(+0.087)#960
15.St Anthony City Hennepin And Ramsey Counties0.14%0.026%(+0.114)#150.055%(+0.084)#972
16.Andover0.13%0.026%(+0.109)#160.055%(+0.080)#987
17.Oakdale0.13%0.026%(+0.106)#170.055%(+0.077)#997
18.Crystal0.12%0.026%(+0.092)#180.055%(+0.062)#1,068
19.Savage0.10%0.026%(+0.079)#190.055%(+0.050)#1,138
20.Austin0.099%0.026%(+0.074)#200.055%(+0.044)#1,172
21.Minnetonka0.086%0.026%(+0.060)#210.055%(+0.031)#1,258
22.Mendota Heights0.086%0.026%(+0.060)#220.055%(+0.031)#1,259
23.Maple Grove0.080%0.026%(+0.054)#230.055%(+0.025)#1,291
24.Robbinsdale0.076%0.026%(+0.050)#240.055%(+0.021)#1,316
25.Hastings0.073%0.026%(+0.047)#250.055%(+0.017)#1,350
26.Woodbury0.071%0.026%(+0.046)#260.055%(+0.016)#1,356
27.Sartell0.062%0.026%(+0.036)#270.055%(+0.007)#1,437
28.Rochester0.056%0.026%(+0.031)#280.055%(+0.001)#1,498
29.Golden Valley0.054%0.026%(+0.028)#290.055%(-0.001)#1,518
30.Eagan0.051%0.026%(+0.026)#300.055%(-0.004)#1,552
31.Champlin0.046%0.026%(+0.021)#310.055%(-0.009)#1,593
32.St Louis Park0.044%0.026%(+0.019)#320.055%(-0.011)#1,610
33.Lino Lakes0.042%0.026%(+0.016)#330.055%(-0.013)#1,634
34.Minneapolis0.037%0.026%(+0.011)#340.055%(-0.018)#1,672
35.Edina0.030%0.026%(+0.004)#350.055%(-0.025)#1,741
36.Coon Rapids0.0095%0.026%(-0.016)#360.055%(-0.046)#1,944
37.Brooklyn Park0.0082%0.026%(-0.017)#370.055%(-0.047)#1,954
38.White Bear Lake0.0082%0.026%(-0.017)#380.055%(-0.047)#1,955
39.St Paul0.0055%0.026%(-0.020)#390.055%(-0.050)#1,988

Common Questions

What are the Top 10 Cities with the Highest Percentage of Chilean Population in Minnesota?
Top 10 Cities with the Highest Percentage of Chilean Population in Minnesota are:
#1
1.24%
#2
0.58%
#3
0.53%
#4
0.29%
#5
0.29%
#6
0.26%
#7
0.26%
#8
0.21%
#9
0.19%
#10
0.18%
What city has the Highest Percentage of Chilean Population in Minnesota?
Motley has the Highest Percentage of Chilean Population in Minnesota with 1.24%.
What is the Percentage of Chilean Population in the State of Minnesota?
Percentage of Chilean Population in Minnesota is 0.026%.
What is the Percentage of Chilean Population in the United States?
Percentage of Chilean Population in the United States is 0.055%.