Hutchinson, MN Map & Demographics
Hutchinson Map
Hutchinson Overview
$41,360
PER CAPITA INCOME
$94,111
AVG FAMILY INCOME
$64,635
AVG HOUSEHOLD INCOME
32.1%
WAGE / INCOME GAP [ % ]
67.9¢/ $1
WAGE / INCOME GAP [ $ ]
$11,983
FAMILY INCOME DEFICIT
0.47
INEQUALITY / GINI INDEX
14,588
TOTAL POPULATION
7,157
MALE POPULATION
7,431
FEMALE POPULATION
96.31
MALES / 100 FEMALES
103.83
FEMALES / 100 MALES
41.9
MEDIAN AGE
3.0
AVG FAMILY SIZE
2.3
AVG HOUSEHOLD SIZE
7,689
LABOR FORCE [ PEOPLE ]
64.9%
PERCENT IN LABOR FORCE
4.6%
UNEMPLOYMENT RATE
Hutchinson Zip Codes
Hutchinson Area Codes
Income in Hutchinson
Income Overview in Hutchinson
Per Capita Income in Hutchinson is $41,360, while median incomes of families and households are $94,111 and $64,635 respectively.
| Characteristic | Number | Measure |
| Per Capita Income | 14,588 | $41,360 |
| Median Family Income | 3,534 | $94,111 |
| Mean Family Income | 3,534 | $122,156 |
| Median Household Income | 6,368 | $64,635 |
| Mean Household Income | 6,368 | $90,377 |
| Income Deficit | 3,534 | $11,983 |
| Wage / Income Gap (%) | 14,588 | 32.09% |
| Wage / Income Gap ($) | 14,588 | 67.91¢ per $1 |
| Gini / Inequality Index | 14,588 | 0.47 |
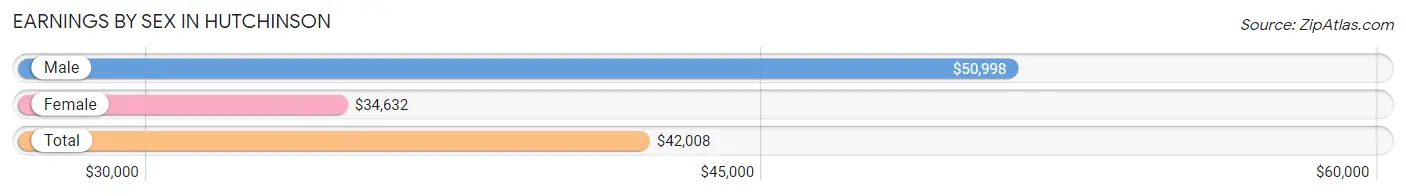
Earnings by Sex in Hutchinson
Average Earnings in Hutchinson are $42,008, $50,998 for men and $34,632 for women, a difference of 32.1%.
| Sex | Number | Average Earnings |
| Male | 4,205 (52.5%) | $50,998 |
| Female | 3,804 (47.5%) | $34,632 |
| Total | 8,009 (100.0%) | $42,008 |
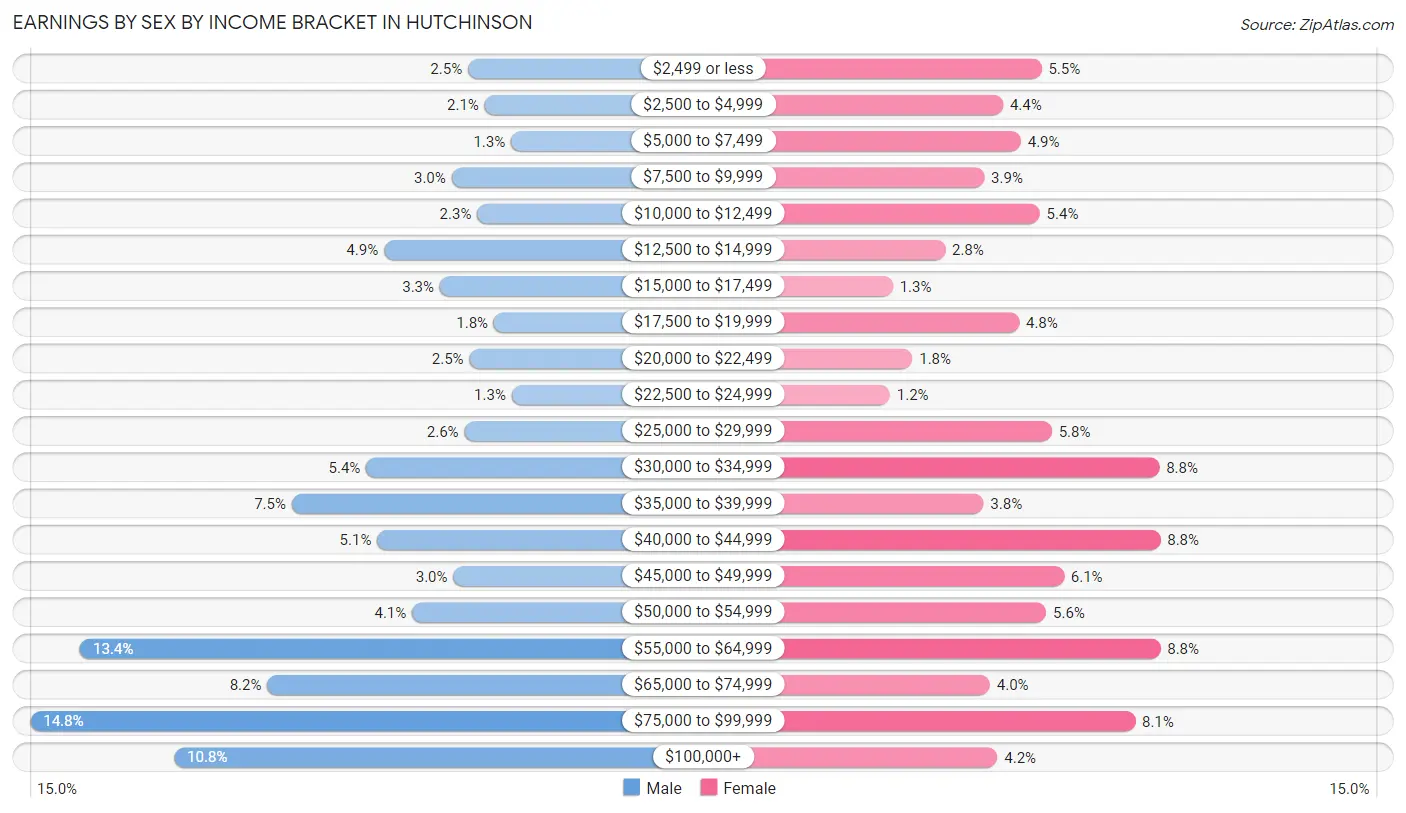
Earnings by Sex by Income Bracket in Hutchinson
The most common earnings brackets in Hutchinson are $75,000 to $99,999 for men (624 | 14.8%) and $40,000 to $44,999 for women (335 | 8.8%).
| Income | Male | Female |
| $2,499 or less | 107 (2.5%) | 208 (5.5%) |
| $2,500 to $4,999 | 87 (2.1%) | 167 (4.4%) |
| $5,000 to $7,499 | 56 (1.3%) | 186 (4.9%) |
| $7,500 to $9,999 | 126 (3.0%) | 147 (3.9%) |
| $10,000 to $12,499 | 96 (2.3%) | 206 (5.4%) |
| $12,500 to $14,999 | 206 (4.9%) | 105 (2.8%) |
| $15,000 to $17,499 | 140 (3.3%) | 49 (1.3%) |
| $17,500 to $19,999 | 76 (1.8%) | 184 (4.8%) |
| $20,000 to $22,499 | 105 (2.5%) | 70 (1.8%) |
| $22,500 to $24,999 | 55 (1.3%) | 46 (1.2%) |
| $25,000 to $29,999 | 111 (2.6%) | 219 (5.8%) |
| $30,000 to $34,999 | 227 (5.4%) | 334 (8.8%) |
| $35,000 to $39,999 | 315 (7.5%) | 146 (3.8%) |
| $40,000 to $44,999 | 214 (5.1%) | 335 (8.8%) |
| $45,000 to $49,999 | 124 (2.9%) | 232 (6.1%) |
| $50,000 to $54,999 | 173 (4.1%) | 213 (5.6%) |
| $55,000 to $64,999 | 565 (13.4%) | 335 (8.8%) |
| $65,000 to $74,999 | 344 (8.2%) | 153 (4.0%) |
| $75,000 to $99,999 | 624 (14.8%) | 308 (8.1%) |
| $100,000+ | 454 (10.8%) | 161 (4.2%) |
| Total | 4,205 (100.0%) | 3,804 (100.0%) |
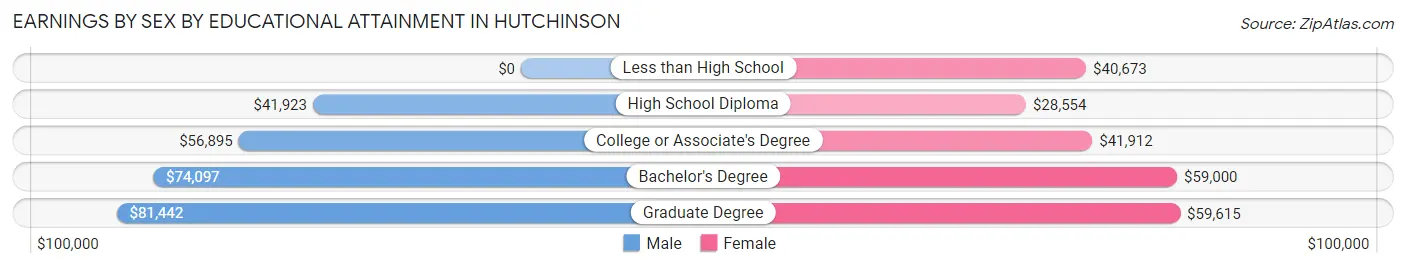
Earnings by Sex by Educational Attainment in Hutchinson
Average earnings in Hutchinson are $56,814 for men and $41,313 for women, a difference of 27.3%. Men with an educational attainment of graduate degree enjoy the highest average annual earnings of $81,442, while those with high school diploma education earn the least with $41,923. Women with an educational attainment of graduate degree earn the most with the average annual earnings of $59,615, while those with high school diploma education have the smallest earnings of $28,554.
| Educational Attainment | Male Income | Female Income |
| Less than High School | - | - |
| High School Diploma | $41,923 | $28,554 |
| College or Associate's Degree | $56,895 | $41,912 |
| Bachelor's Degree | $74,097 | $59,000 |
| Graduate Degree | $81,442 | $59,615 |
| Total | $56,814 | $41,313 |
Family Income in Hutchinson
Family Income Brackets in Hutchinson
According to the Hutchinson family income data, there are 926 families falling into the $100,000 to $149,999 income range, which is the most common income bracket and makes up 26.2% of all families. Conversely, the $15,000 to $24,999 income bracket is the least frequent group with only 67 families (1.9%) belonging to this category.
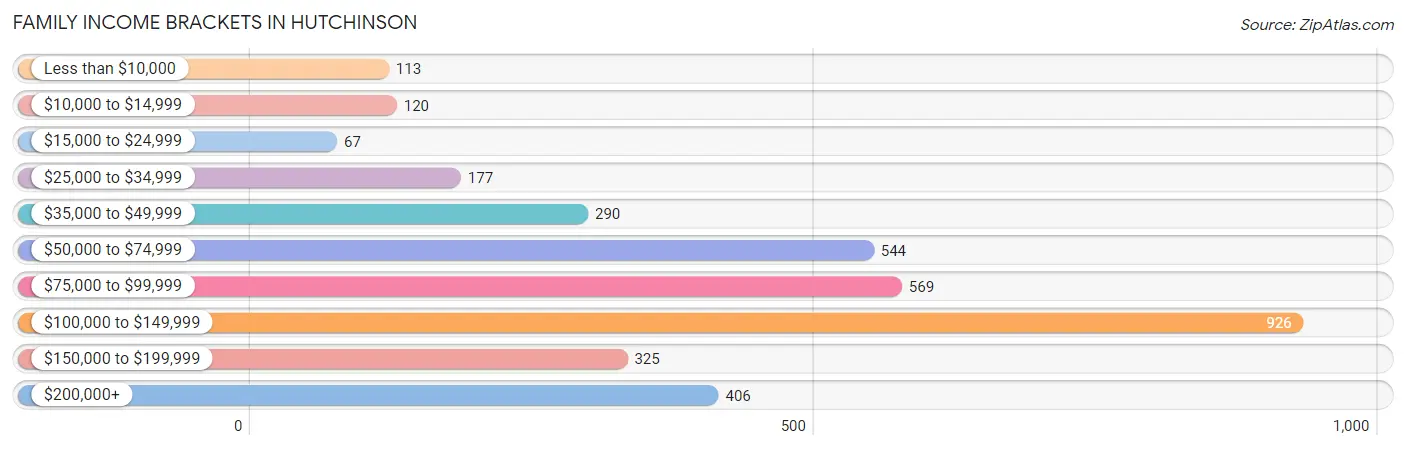
| Income Bracket | # Families | % Families |
| Less than $10,000 | 113 | 3.2% |
| $10,000 to $14,999 | 120 | 3.4% |
| $15,000 to $24,999 | 67 | 1.9% |
| $25,000 to $34,999 | 177 | 5.0% |
| $35,000 to $49,999 | 290 | 8.2% |
| $50,000 to $74,999 | 544 | 15.4% |
| $75,000 to $99,999 | 569 | 16.1% |
| $100,000 to $149,999 | 926 | 26.2% |
| $150,000 to $199,999 | 325 | 9.2% |
| $200,000+ | 406 | 11.5% |
Family Income by Famaliy Size in Hutchinson
4-person families (694 | 19.6%) account for the highest median family income in Hutchinson with $113,446 per family, while 2-person families (1,967 | 55.7%) have the highest median income of $39,840 per family member.
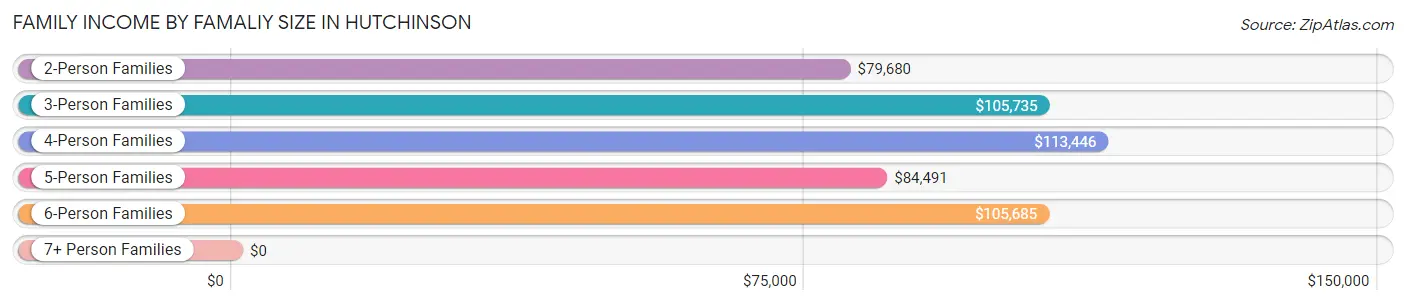
| Income Bracket | # Families | Median Income |
| 2-Person Families | 1,967 (55.7%) | $79,680 |
| 3-Person Families | 570 (16.1%) | $105,735 |
| 4-Person Families | 694 (19.6%) | $113,446 |
| 5-Person Families | 139 (3.9%) | $84,491 |
| 6-Person Families | 125 (3.5%) | $105,685 |
| 7+ Person Families | 39 (1.1%) | $0 |
| Total | 3,534 (100.0%) | $94,111 |
Family Income by Number of Earners in Hutchinson
The median family income in Hutchinson is $94,111, with families comprising 3+ earners (422) having the highest median family income of $151,810, while families with no earners (592) have the lowest median family income of $61,917, accounting for 11.9% and 16.8% of families, respectively.
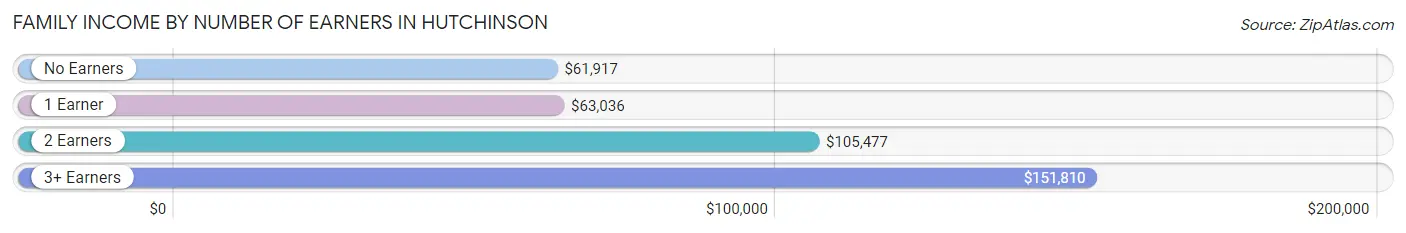
| Number of Earners | # Families | Median Income |
| No Earners | 592 (16.8%) | $61,917 |
| 1 Earner | 955 (27.0%) | $63,036 |
| 2 Earners | 1,565 (44.3%) | $105,477 |
| 3+ Earners | 422 (11.9%) | $151,810 |
| Total | 3,534 (100.0%) | $94,111 |
Household Income in Hutchinson
Household Income Brackets in Hutchinson
With 1,331 households falling in the category, the $50,000 to $74,999 income range is the most frequent in Hutchinson, accounting for 20.9% of all households. In contrast, only 191 households (3.0%) fall into the $10,000 to $14,999 income bracket, making it the least populous group.
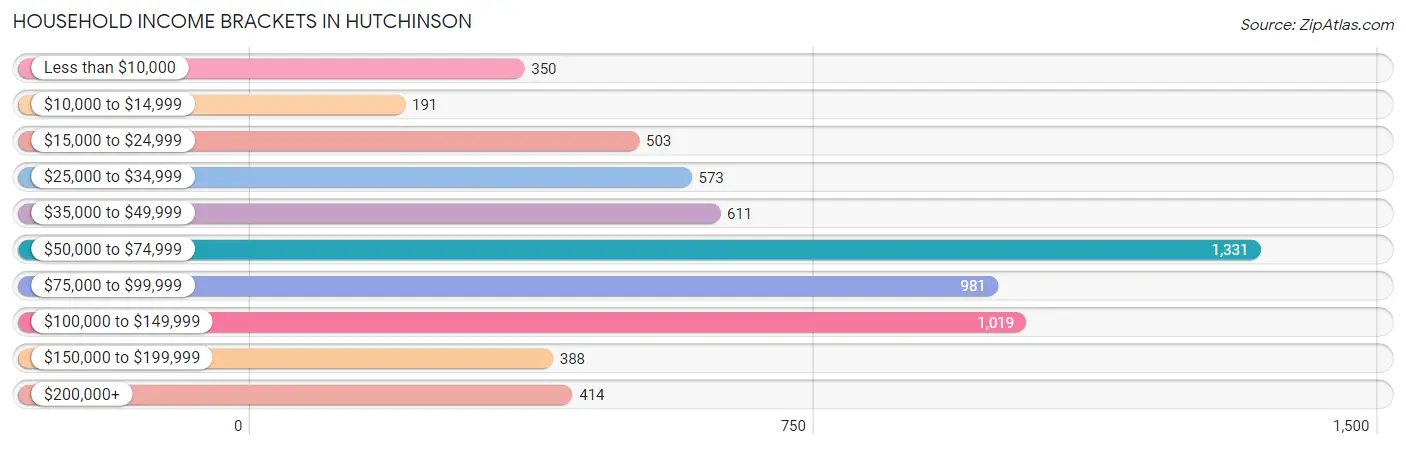
| Income Bracket | # Households | % Households |
| Less than $10,000 | 350 | 5.5% |
| $10,000 to $14,999 | 191 | 3.0% |
| $15,000 to $24,999 | 503 | 7.9% |
| $25,000 to $34,999 | 573 | 9.0% |
| $35,000 to $49,999 | 611 | 9.6% |
| $50,000 to $74,999 | 1,331 | 20.9% |
| $75,000 to $99,999 | 981 | 15.4% |
| $100,000 to $149,999 | 1,019 | 16.0% |
| $150,000 to $199,999 | 388 | 6.1% |
| $200,000+ | 414 | 6.5% |
Household Income by Householder Age in Hutchinson
The median household income in Hutchinson is $64,635, with the highest median household income of $84,491 found in the 25 to 44 years age bracket for the primary householder. A total of 1,749 households (27.5%) fall into this category. Meanwhile, the 15 to 24 years age bracket for the primary householder has the lowest median household income of $32,778, with 380 households (6.0%) in this group.
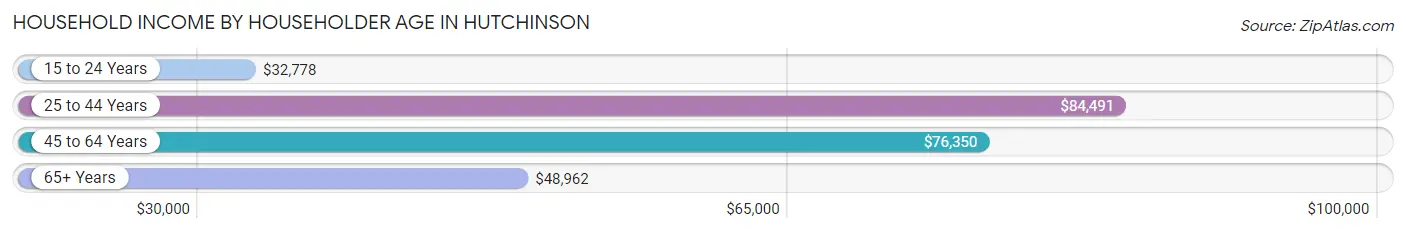
| Income Bracket | # Households | Median Income |
| 15 to 24 Years | 380 (6.0%) | $32,778 |
| 25 to 44 Years | 1,749 (27.5%) | $84,491 |
| 45 to 64 Years | 2,202 (34.6%) | $76,350 |
| 65+ Years | 2,037 (32.0%) | $48,962 |
| Total | 6,368 (100.0%) | $64,635 |
Poverty in Hutchinson
Income Below Poverty by Sex and Age in Hutchinson
With 8.3% poverty level for males and 10.8% for females among the residents of Hutchinson, 15 year old males and 16 and 17 year old females are the most vulnerable to poverty, with 15 males (40.5%) and 23 females (24.2%) in their respective age groups living below the poverty level.
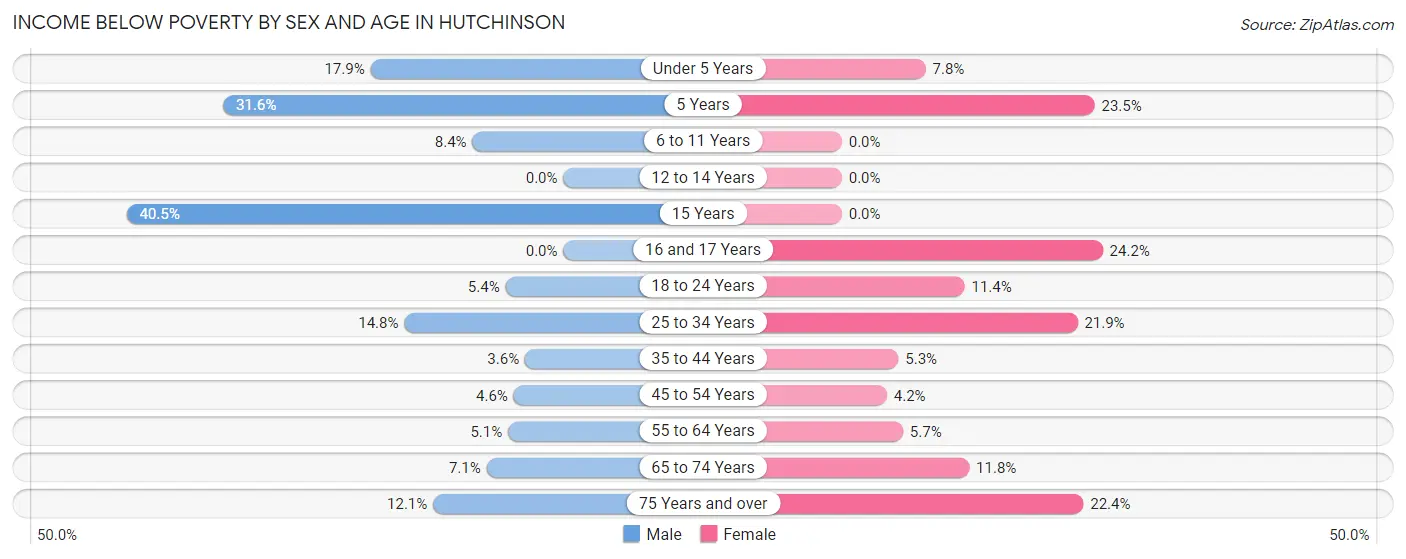
| Age Bracket | Male | Female |
| Under 5 Years | 94 (17.9%) | 41 (7.8%) |
| 5 Years | 30 (31.6%) | 19 (23.5%) |
| 6 to 11 Years | 45 (8.4%) | 0 (0.0%) |
| 12 to 14 Years | 0 (0.0%) | 0 (0.0%) |
| 15 Years | 15 (40.5%) | 0 (0.0%) |
| 16 and 17 Years | 0 (0.0%) | 23 (24.2%) |
| 18 to 24 Years | 34 (5.4%) | 78 (11.4%) |
| 25 to 34 Years | 138 (14.8%) | 194 (21.9%) |
| 35 to 44 Years | 32 (3.6%) | 39 (5.2%) |
| 45 to 54 Years | 40 (4.6%) | 38 (4.2%) |
| 55 to 64 Years | 45 (5.1%) | 57 (5.7%) |
| 65 to 74 Years | 52 (7.1%) | 109 (11.8%) |
| 75 Years and over | 62 (12.1%) | 203 (22.4%) |
| Total | 587 (8.3%) | 801 (10.8%) |
Income Above Poverty by Sex and Age in Hutchinson
According to the poverty statistics in Hutchinson, males aged 12 to 14 years and females aged 6 to 11 years are the age groups that are most secure financially, with 100.0% of males and 100.0% of females in these age groups living above the poverty line.
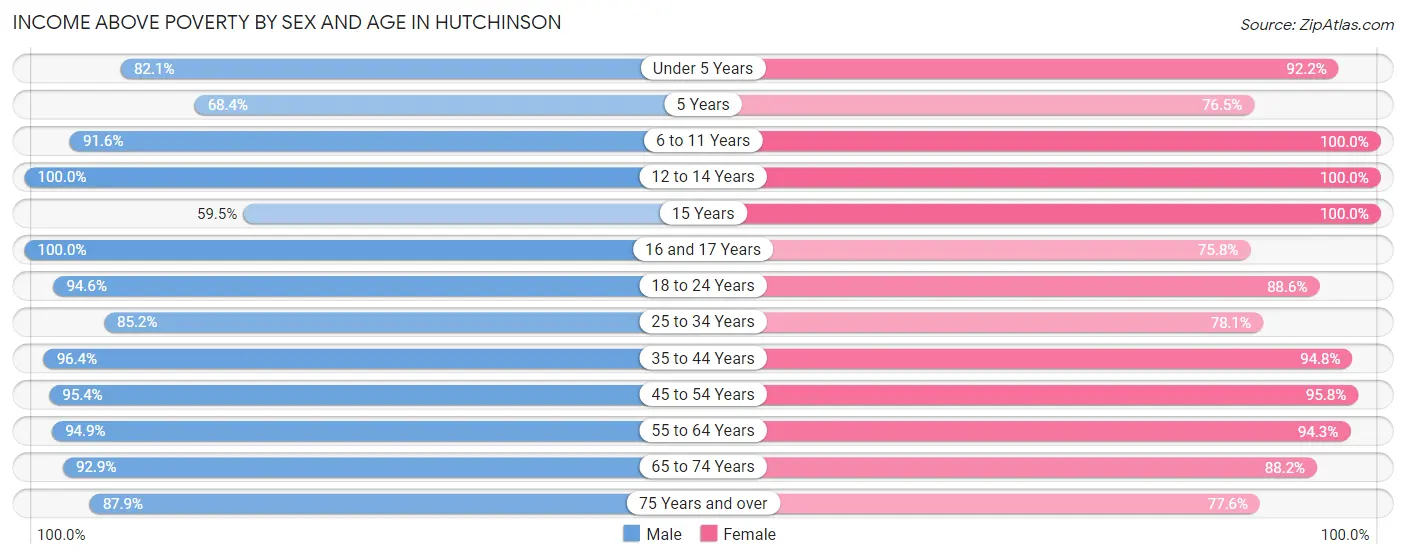
| Age Bracket | Male | Female |
| Under 5 Years | 431 (82.1%) | 486 (92.2%) |
| 5 Years | 65 (68.4%) | 62 (76.5%) |
| 6 to 11 Years | 488 (91.6%) | 328 (100.0%) |
| 12 to 14 Years | 293 (100.0%) | 163 (100.0%) |
| 15 Years | 22 (59.5%) | 130 (100.0%) |
| 16 and 17 Years | 175 (100.0%) | 72 (75.8%) |
| 18 to 24 Years | 599 (94.6%) | 607 (88.6%) |
| 25 to 34 Years | 797 (85.2%) | 693 (78.1%) |
| 35 to 44 Years | 867 (96.4%) | 704 (94.8%) |
| 45 to 54 Years | 827 (95.4%) | 872 (95.8%) |
| 55 to 64 Years | 832 (94.9%) | 948 (94.3%) |
| 65 to 74 Years | 677 (92.9%) | 813 (88.2%) |
| 75 Years and over | 451 (87.9%) | 703 (77.6%) |
| Total | 6,524 (91.7%) | 6,581 (89.1%) |
Income Below Poverty Among Married-Couple Families in Hutchinson
The poverty statistics for married-couple families in Hutchinson show that 3.5% or 100 of the total 2,899 families live below the poverty line. Families with no children have the highest poverty rate of 4.1%, comprising of 79 families. On the other hand, families with 3 or 4 children have the lowest poverty rate of 0.0%, which includes 0 families.
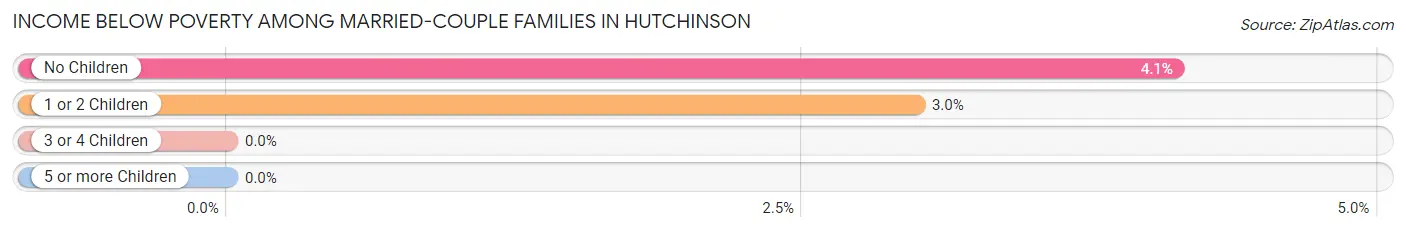
| Children | Above Poverty | Below Poverty |
| No Children | 1,839 (95.9%) | 79 (4.1%) |
| 1 or 2 Children | 681 (97.0%) | 21 (3.0%) |
| 3 or 4 Children | 240 (100.0%) | 0 (0.0%) |
| 5 or more Children | 39 (100.0%) | 0 (0.0%) |
| Total | 2,799 (96.6%) | 100 (3.5%) |
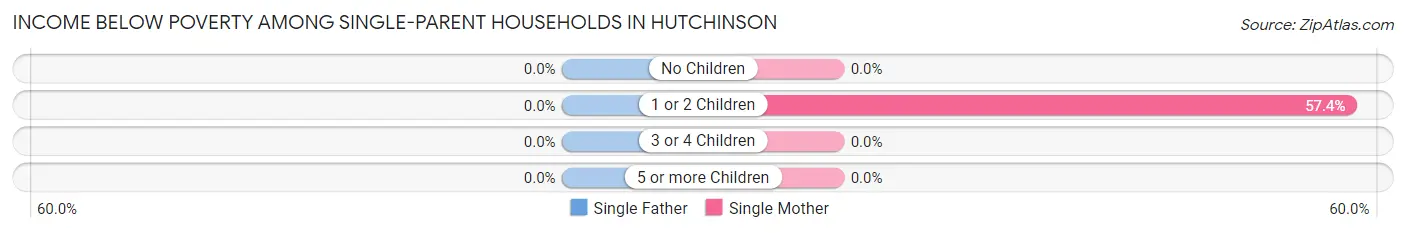
Income Below Poverty Among Single-Parent Households in Hutchinson
| Children | Single Father | Single Mother |
| No Children | 0 (0.0%) | 0 (0.0%) |
| 1 or 2 Children | 0 (0.0%) | 163 (57.4%) |
| 3 or 4 Children | 0 (0.0%) | 0 (0.0%) |
| 5 or more Children | 0 (0.0%) | 0 (0.0%) |
| Total | 0 (0.0%) | 163 (28.9%) |
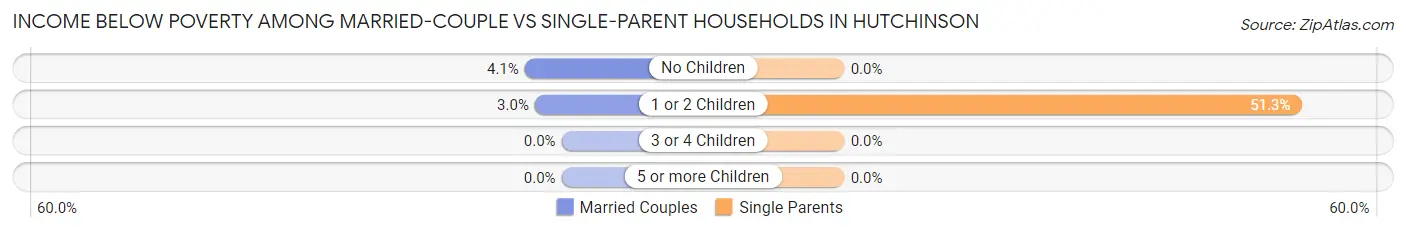
Income Below Poverty Among Married-Couple vs Single-Parent Households in Hutchinson
The poverty data for Hutchinson shows that 100 of the married-couple family households (3.5%) and 163 of the single-parent households (25.7%) are living below the poverty level. Within the married-couple family households, those with no children have the highest poverty rate, with 79 households (4.1%) falling below the poverty line. Among the single-parent households, those with 1 or 2 children have the highest poverty rate, with 163 household (51.3%) living below poverty.
| Children | Married-Couple Families | Single-Parent Households |
| No Children | 79 (4.1%) | 0 (0.0%) |
| 1 or 2 Children | 21 (3.0%) | 163 (51.3%) |
| 3 or 4 Children | 0 (0.0%) | 0 (0.0%) |
| 5 or more Children | 0 (0.0%) | 0 (0.0%) |
| Total | 100 (3.5%) | 163 (25.7%) |
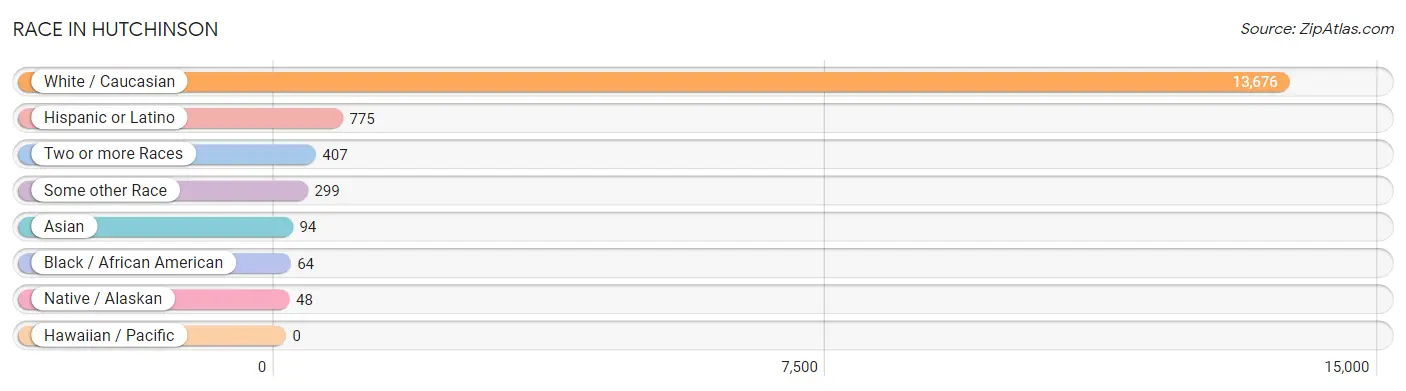
Race in Hutchinson
The most populous races in Hutchinson are White / Caucasian (13,676 | 93.8%), Hispanic or Latino (775 | 5.3%), and Two or more Races (407 | 2.8%).
| Race | # Population | % Population |
| Asian | 94 | 0.6% |
| Black / African American | 64 | 0.4% |
| Hawaiian / Pacific | 0 | 0.0% |
| Hispanic or Latino | 775 | 5.3% |
| Native / Alaskan | 48 | 0.3% |
| White / Caucasian | 13,676 | 93.8% |
| Two or more Races | 407 | 2.8% |
| Some other Race | 299 | 2.1% |
| Total | 14,588 | 100.0% |
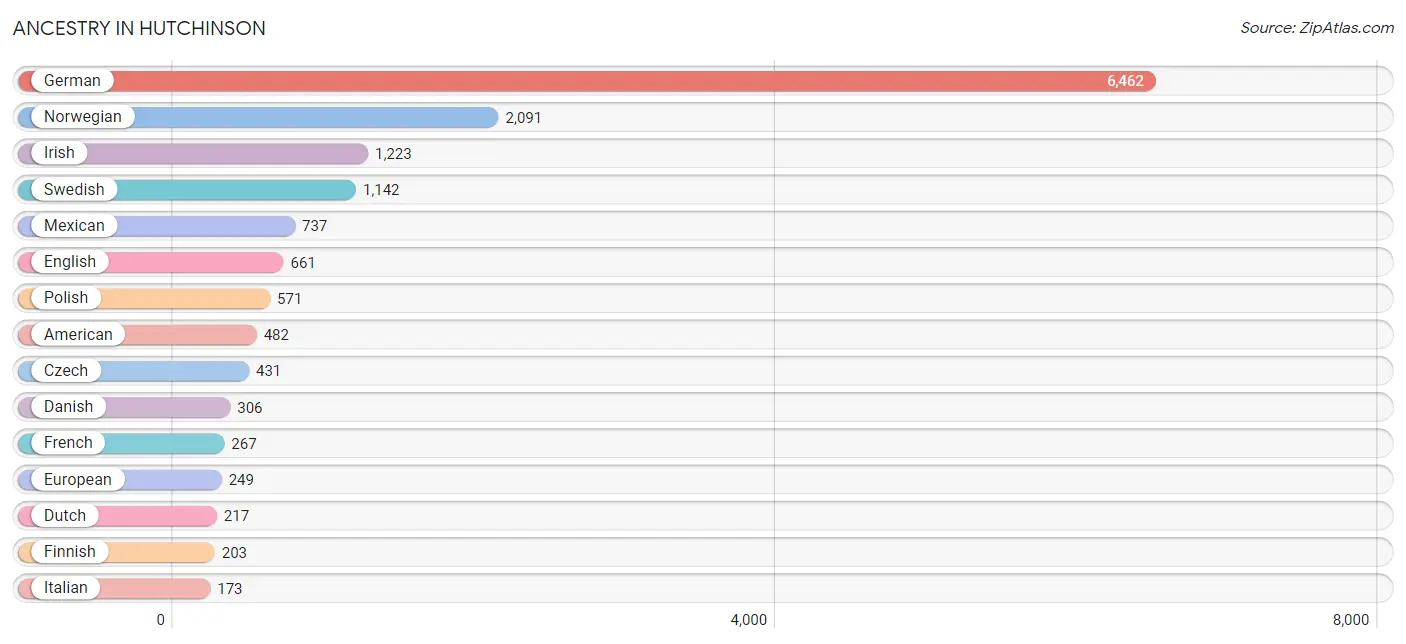
Ancestry in Hutchinson
The most populous ancestries reported in Hutchinson are German (6,462 | 44.3%), Norwegian (2,091 | 14.3%), Irish (1,223 | 8.4%), Swedish (1,142 | 7.8%), and Mexican (737 | 5.1%), together accounting for 79.9% of all Hutchinson residents.
| Ancestry | # Population | % Population |
| African | 10 | 0.1% |
| American | 482 | 3.3% |
| Arab | 19 | 0.1% |
| Austrian | 32 | 0.2% |
| Belgian | 14 | 0.1% |
| Bhutanese | 24 | 0.2% |
| British | 36 | 0.3% |
| Burmese | 149 | 1.0% |
| Central American | 18 | 0.1% |
| Chippewa | 8 | 0.1% |
| Cuban | 1 | 0.0% |
| Czech | 431 | 2.9% |
| Czechoslovakian | 140 | 1.0% |
| Danish | 306 | 2.1% |
| Dutch | 217 | 1.5% |
| Dutch West Indian | 11 | 0.1% |
| Eastern European | 20 | 0.1% |
| English | 661 | 4.5% |
| European | 249 | 1.7% |
| Finnish | 203 | 1.4% |
| French | 267 | 1.8% |
| French Canadian | 48 | 0.3% |
| German | 6,462 | 44.3% |
| Ghanaian | 26 | 0.2% |
| Greek | 22 | 0.2% |
| Honduran | 18 | 0.1% |
| Hungarian | 13 | 0.1% |
| Indian (Asian) | 23 | 0.2% |
| Indonesian | 1 | 0.0% |
| Irish | 1,223 | 8.4% |
| Iroquois | 7 | 0.1% |
| Italian | 173 | 1.2% |
| Korean | 103 | 0.7% |
| Lebanese | 19 | 0.1% |
| Mexican | 737 | 5.1% |
| Mexican American Indian | 46 | 0.3% |
| Nigerian | 28 | 0.2% |
| Norwegian | 2,091 | 14.3% |
| Polish | 571 | 3.9% |
| Puerto Rican | 19 | 0.1% |
| Russian | 47 | 0.3% |
| Scandinavian | 150 | 1.0% |
| Scotch-Irish | 49 | 0.3% |
| Scottish | 68 | 0.5% |
| Sioux | 24 | 0.2% |
| Sri Lankan | 12 | 0.1% |
| Subsaharan African | 64 | 0.4% |
| Swedish | 1,142 | 7.8% |
| Swiss | 42 | 0.3% |
| Ukrainian | 14 | 0.1% |
| Welsh | 12 | 0.1% | View All 51 Rows |
Immigrants in Hutchinson
The most numerous immigrant groups reported in Hutchinson came from Central America (206 | 1.4%), Latin America (206 | 1.4%), Asia (176 | 1.2%), Mexico (107 | 0.7%), and South Eastern Asia (104 | 0.7%), together accounting for 5.5% of all Hutchinson residents.
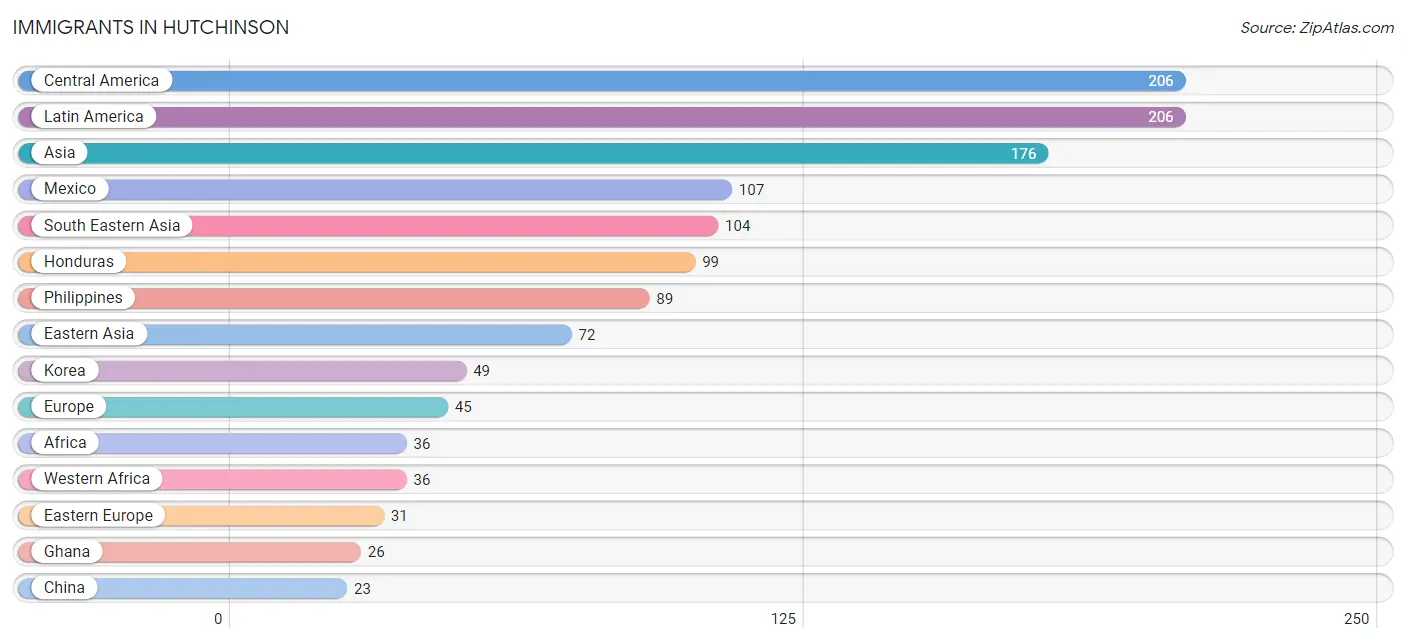
| Immigration Origin | # Population | % Population |
| Africa | 36 | 0.3% |
| Asia | 176 | 1.2% |
| Canada | 14 | 0.1% |
| Central America | 206 | 1.4% |
| China | 23 | 0.2% |
| Eastern Asia | 72 | 0.5% |
| Eastern Europe | 31 | 0.2% |
| Europe | 45 | 0.3% |
| Ghana | 26 | 0.2% |
| Honduras | 99 | 0.7% |
| Korea | 49 | 0.3% |
| Latin America | 206 | 1.4% |
| Mexico | 107 | 0.7% |
| Nigeria | 10 | 0.1% |
| Northern Europe | 14 | 0.1% |
| Philippines | 89 | 0.6% |
| Poland | 17 | 0.1% |
| Russia | 14 | 0.1% |
| South Eastern Asia | 104 | 0.7% |
| Thailand | 3 | 0.0% |
| Vietnam | 12 | 0.1% |
| Western Africa | 36 | 0.3% | View All 22 Rows |
Sex and Age in Hutchinson
Sex and Age in Hutchinson
The most populous age groups in Hutchinson are 60 to 64 Years (558 | 7.8%) for men and 60 to 64 Years (592 | 8.0%) for women.
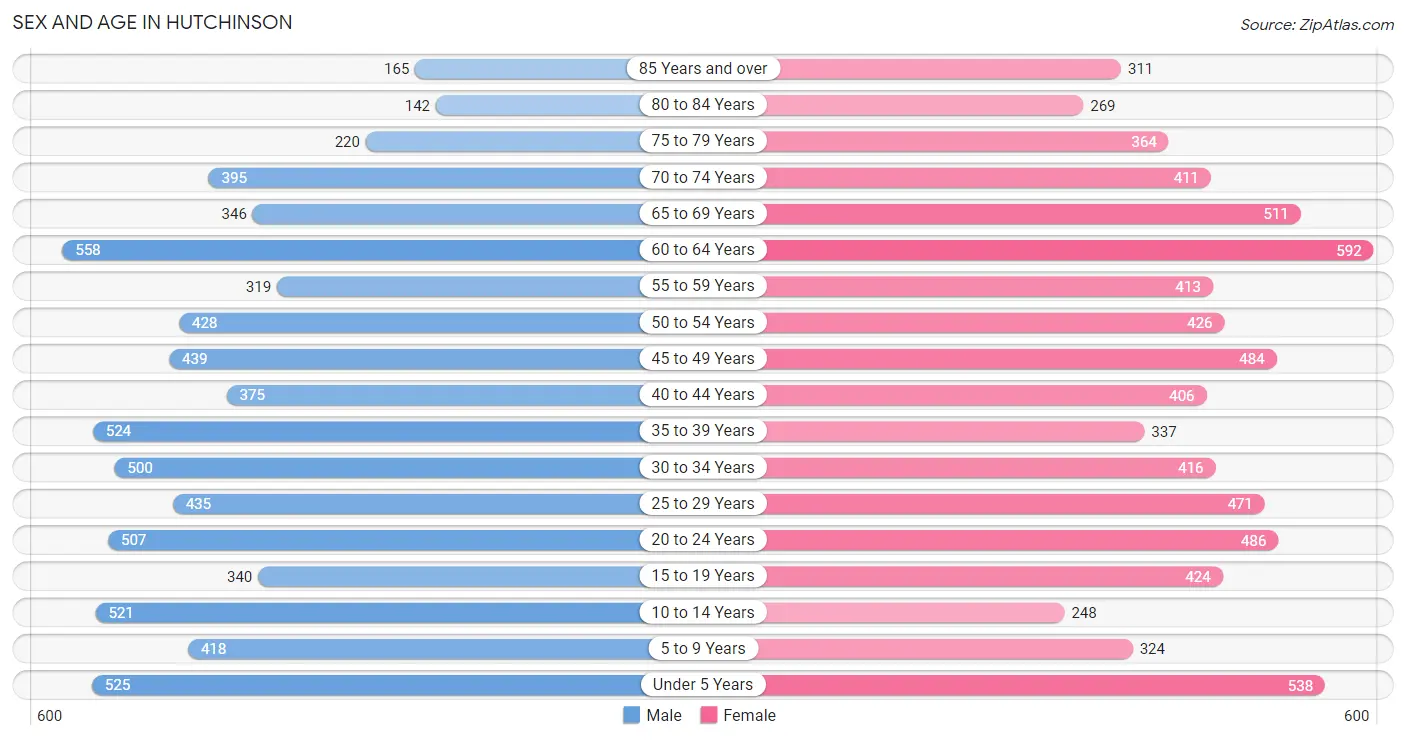
| Age Bracket | Male | Female |
| Under 5 Years | 525 (7.3%) | 538 (7.2%) |
| 5 to 9 Years | 418 (5.8%) | 324 (4.4%) |
| 10 to 14 Years | 521 (7.3%) | 248 (3.3%) |
| 15 to 19 Years | 340 (4.8%) | 424 (5.7%) |
| 20 to 24 Years | 507 (7.1%) | 486 (6.5%) |
| 25 to 29 Years | 435 (6.1%) | 471 (6.3%) |
| 30 to 34 Years | 500 (7.0%) | 416 (5.6%) |
| 35 to 39 Years | 524 (7.3%) | 337 (4.5%) |
| 40 to 44 Years | 375 (5.2%) | 406 (5.5%) |
| 45 to 49 Years | 439 (6.1%) | 484 (6.5%) |
| 50 to 54 Years | 428 (6.0%) | 426 (5.7%) |
| 55 to 59 Years | 319 (4.5%) | 413 (5.6%) |
| 60 to 64 Years | 558 (7.8%) | 592 (8.0%) |
| 65 to 69 Years | 346 (4.8%) | 511 (6.9%) |
| 70 to 74 Years | 395 (5.5%) | 411 (5.5%) |
| 75 to 79 Years | 220 (3.1%) | 364 (4.9%) |
| 80 to 84 Years | 142 (2.0%) | 269 (3.6%) |
| 85 Years and over | 165 (2.3%) | 311 (4.2%) |
| Total | 7,157 (100.0%) | 7,431 (100.0%) |
Families and Households in Hutchinson
Median Family Size in Hutchinson
The median family size in Hutchinson is 3.02 persons per family, with married-couple families (2,899 | 82.0%) accounting for the largest median family size of 3.1 persons per family. On the other hand, single female/mother families (564 | 16.0%) represent the smallest median family size with 2.66 persons per family.
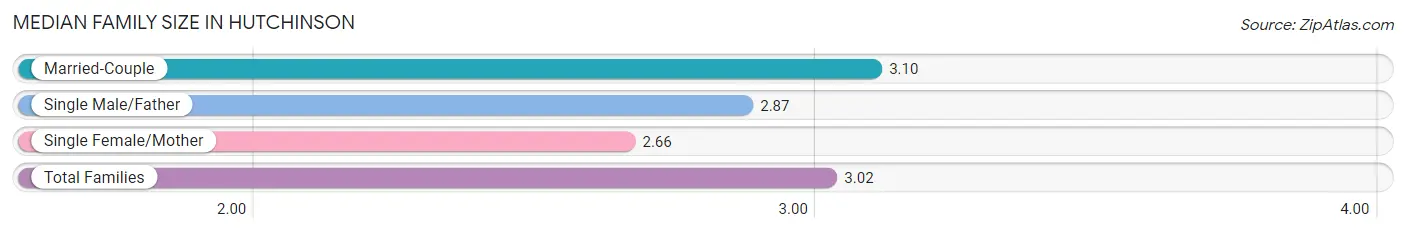
| Family Type | # Families | Family Size |
| Married-Couple | 2,899 (82.0%) | 3.10 |
| Single Male/Father | 71 (2.0%) | 2.87 |
| Single Female/Mother | 564 (16.0%) | 2.66 |
| Total Families | 3,534 (100.0%) | 3.02 |
Median Household Size in Hutchinson
The median household size in Hutchinson is 2.26 persons per household, with married-couple households (2,899 | 45.5%) accounting for the largest median household size of 3.11 persons per household. non-family households (2,834 | 44.5%) represent the smallest median household size with 1.22 persons per household.
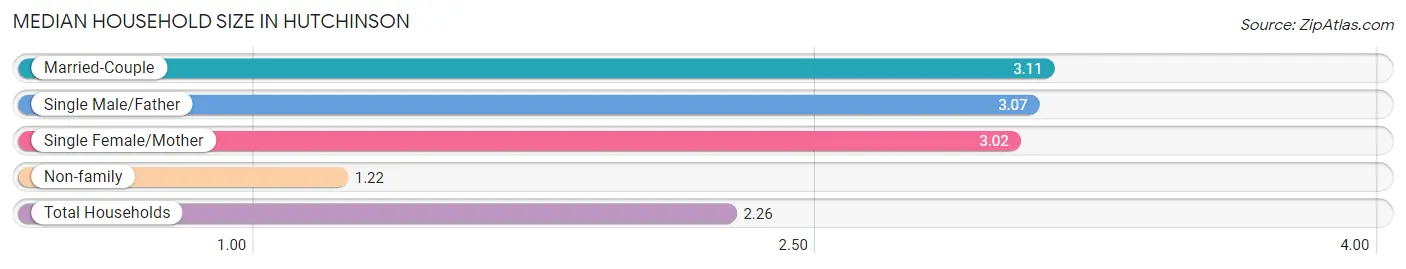
| Household Type | # Households | Household Size |
| Married-Couple | 2,899 (45.5%) | 3.11 |
| Single Male/Father | 71 (1.1%) | 3.07 |
| Single Female/Mother | 564 (8.9%) | 3.02 |
| Non-family | 2,834 (44.5%) | 1.22 |
| Total Households | 6,368 (100.0%) | 2.26 |
Household Size by Marriage Status in Hutchinson
Out of a total of 6,368 households in Hutchinson, 3,534 (55.5%) are family households, while 2,834 (44.5%) are nonfamily households. The most numerous type of family households are 2-person households, comprising 1,834, and the most common type of nonfamily households are 1-person households, comprising 2,344.
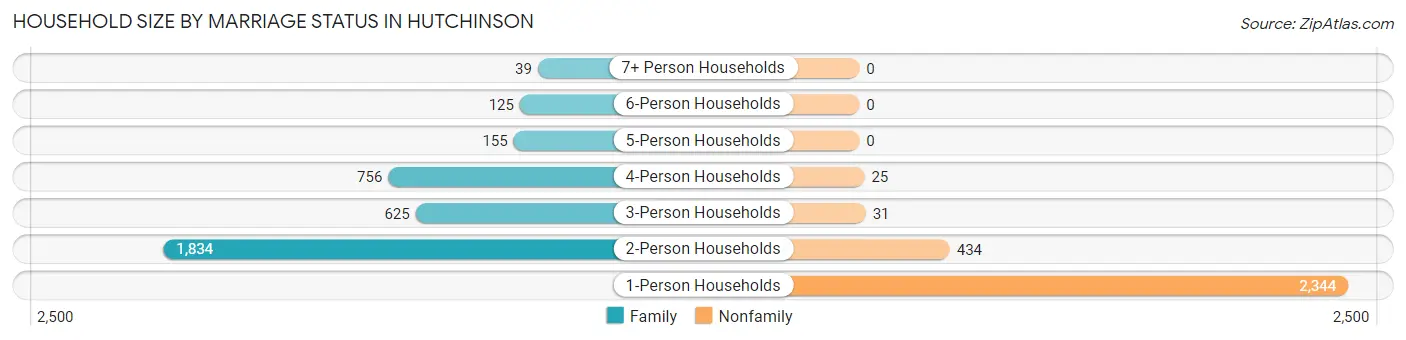
| Household Size | Family Households | Nonfamily Households |
| 1-Person Households | - | 2,344 (36.8%) |
| 2-Person Households | 1,834 (28.8%) | 434 (6.8%) |
| 3-Person Households | 625 (9.8%) | 31 (0.5%) |
| 4-Person Households | 756 (11.9%) | 25 (0.4%) |
| 5-Person Households | 155 (2.4%) | 0 (0.0%) |
| 6-Person Households | 125 (2.0%) | 0 (0.0%) |
| 7+ Person Households | 39 (0.6%) | 0 (0.0%) |
| Total | 3,534 (55.5%) | 2,834 (44.5%) |
Female Fertility in Hutchinson
Fertility by Age in Hutchinson
Average fertility rate in Hutchinson is 70.0 births per 1,000 women. Women in the age bracket of 20 to 34 years have the highest fertility rate with 114.0 births per 1,000 women. Women in the age bracket of 20 to 34 years acount for 72.9% of all women with births.
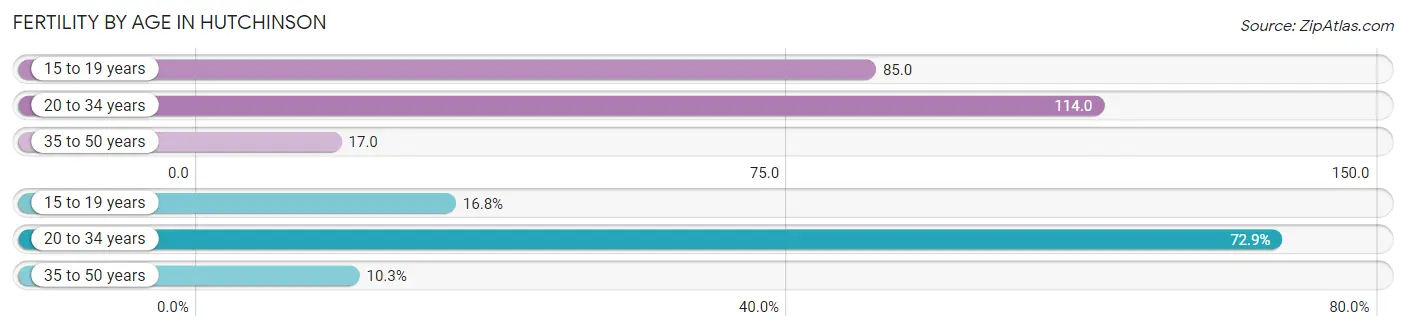
| Age Bracket | Women with Births | Births / 1,000 Women |
| 15 to 19 years | 36 (16.8%) | 85.0 |
| 20 to 34 years | 156 (72.9%) | 114.0 |
| 35 to 50 years | 22 (10.3%) | 17.0 |
| Total | 214 (100.0%) | 70.0 |
Fertility by Age by Marriage Status in Hutchinson
50.5% of women with births (214) in Hutchinson are married. The highest percentage of unmarried women with births falls into 15 to 19 years age bracket with 100.0% of them unmarried at the time of birth, while the lowest percentage of unmarried women with births belong to 35 to 50 years age bracket with 0.0% of them unmarried.
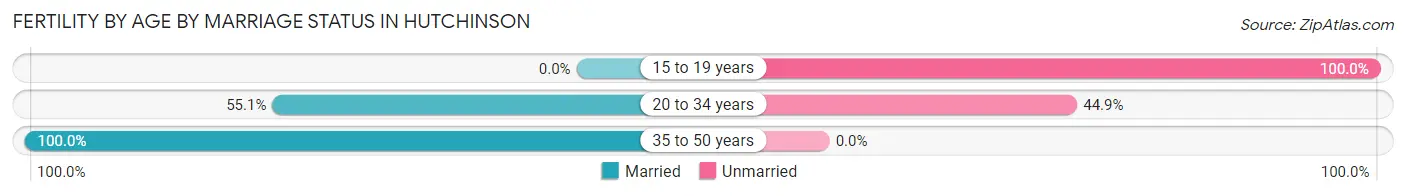
| Age Bracket | Married | Unmarried |
| 15 to 19 years | 0 (0.0%) | 36 (100.0%) |
| 20 to 34 years | 86 (55.1%) | 70 (44.9%) |
| 35 to 50 years | 22 (100.0%) | 0 (0.0%) |
| Total | 108 (50.5%) | 106 (49.5%) |
Fertility by Education in Hutchinson
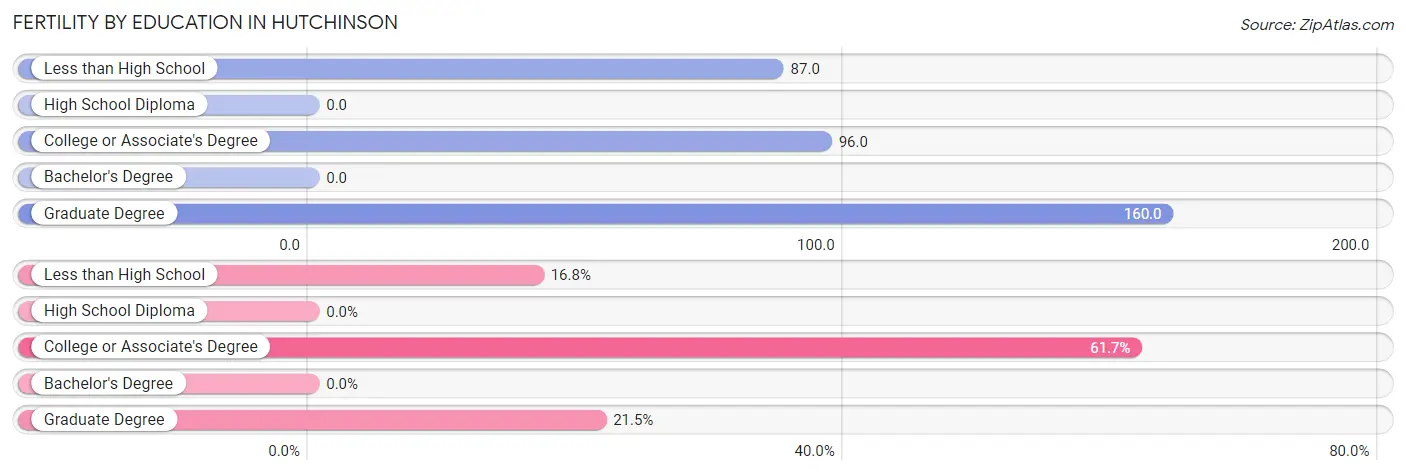
| Educational Attainment | Women with Births | Births / 1,000 Women |
| Less than High School | 36 (16.8%) | 87.0 |
| High School Diploma | 0 (0.0%) | 0.0 |
| College or Associate's Degree | 132 (61.7%) | 96.0 |
| Bachelor's Degree | 0 (0.0%) | 0.0 |
| Graduate Degree | 46 (21.5%) | 160.0 |
| Total | 214 (100.0%) | 70.0 |
Fertility by Education by Marriage Status in Hutchinson
49.5% of women with births in Hutchinson are unmarried. Women with the educational attainment of graduate degree are most likely to be married with 100.0% of them married at childbirth, while women with the educational attainment of less than high school are least likely to be married with 100.0% of them unmarried at childbirth.
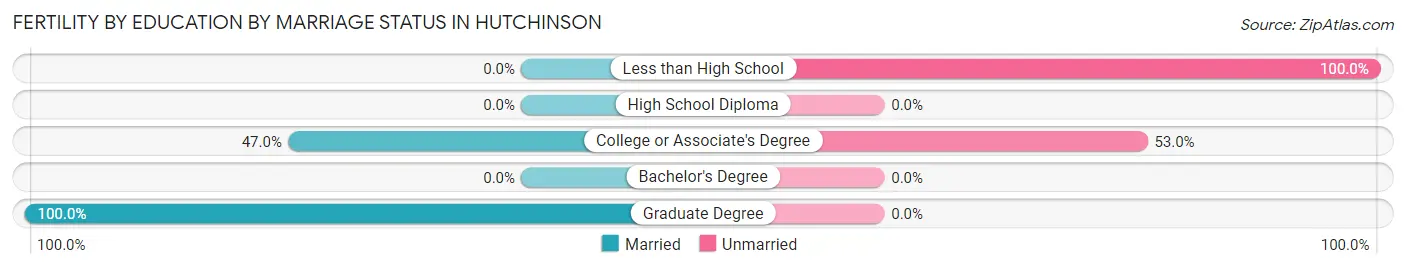
| Educational Attainment | Married | Unmarried |
| Less than High School | 0 (0.0%) | 36 (100.0%) |
| High School Diploma | 0 (0.0%) | 0 (0.0%) |
| College or Associate's Degree | 62 (47.0%) | 70 (53.0%) |
| Bachelor's Degree | 0 (0.0%) | 0 (0.0%) |
| Graduate Degree | 46 (100.0%) | 0 (0.0%) |
| Total | 108 (50.5%) | 106 (49.5%) |
Employment Characteristics in Hutchinson
Employment by Class of Employer in Hutchinson
Among the 7,119 employed individuals in Hutchinson, private company employees (5,418 | 76.1%), not-for-profit organizations (690 | 9.7%), and local government employees (501 | 7.0%) make up the most common classes of employment.
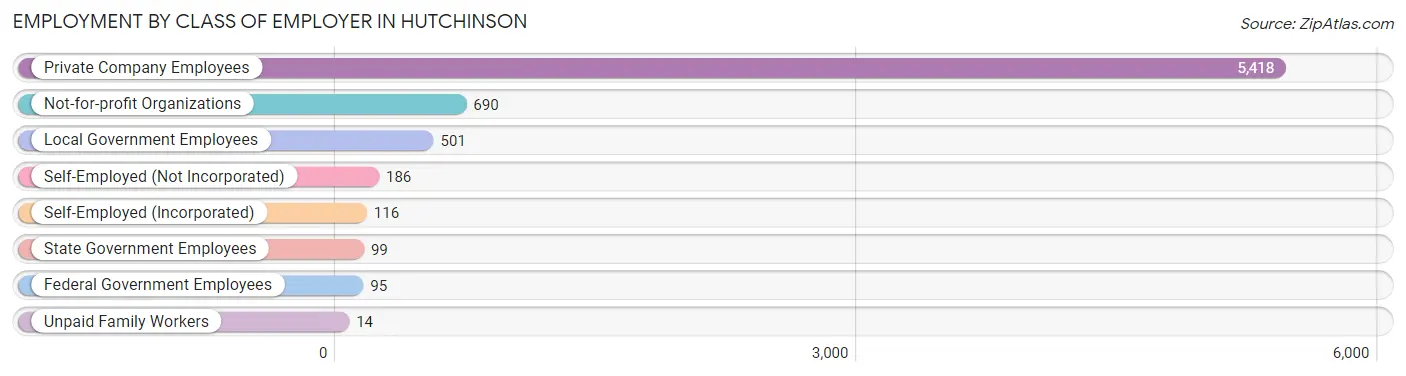
| Employer Class | # Employees | % Employees |
| Private Company Employees | 5,418 | 76.1% |
| Self-Employed (Incorporated) | 116 | 1.6% |
| Self-Employed (Not Incorporated) | 186 | 2.6% |
| Not-for-profit Organizations | 690 | 9.7% |
| Local Government Employees | 501 | 7.0% |
| State Government Employees | 99 | 1.4% |
| Federal Government Employees | 95 | 1.3% |
| Unpaid Family Workers | 14 | 0.2% |
| Total | 7,119 | 100.0% |
Employment Status by Age in Hutchinson
According to the labor force statistics for Hutchinson, out of the total population over 16 years of age (11,847), 64.9% or 7,689 individuals are in the labor force, with 4.6% or 354 of them unemployed. The age group with the highest labor force participation rate is 35 to 44 years, with 92.1% or 1,512 individuals in the labor force. Within the labor force, the 65 to 74 years age range has the highest percentage of unemployed individuals, with 20.6% or 100 of them being unemployed.
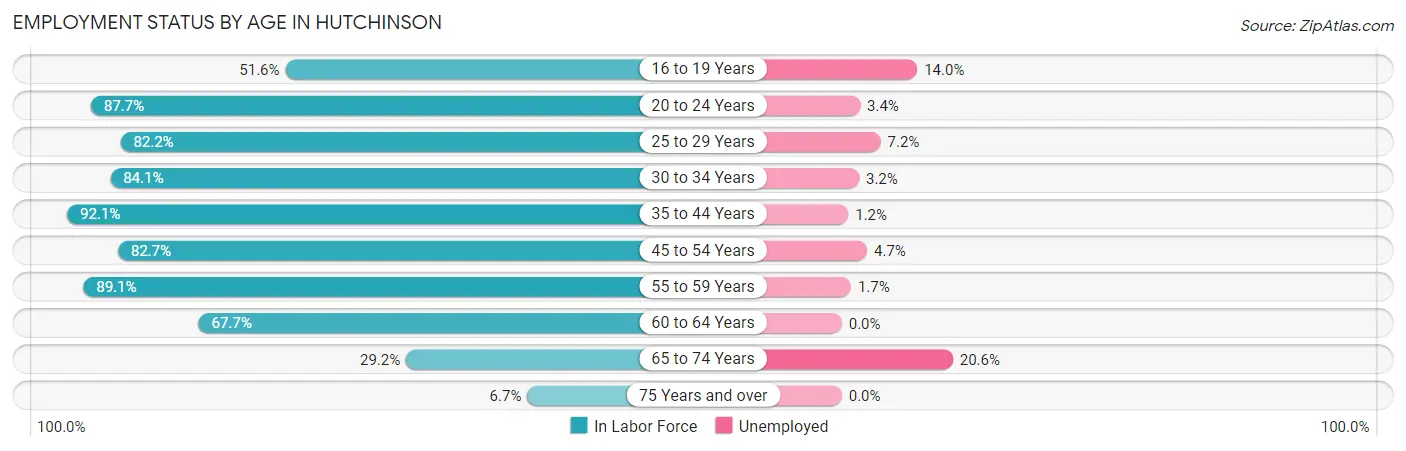
| Age Bracket | In Labor Force | Unemployed |
| 16 to 19 Years | 308 (51.6%) | 43 (14.0%) |
| 20 to 24 Years | 871 (87.7%) | 30 (3.4%) |
| 25 to 29 Years | 745 (82.2%) | 54 (7.2%) |
| 30 to 34 Years | 770 (84.1%) | 25 (3.2%) |
| 35 to 44 Years | 1,512 (92.1%) | 18 (1.2%) |
| 45 to 54 Years | 1,470 (82.7%) | 69 (4.7%) |
| 55 to 59 Years | 652 (89.1%) | 11 (1.7%) |
| 60 to 64 Years | 779 (67.7%) | 0 (0.0%) |
| 65 to 74 Years | 486 (29.2%) | 100 (20.6%) |
| 75 Years and over | 99 (6.7%) | 0 (0.0%) |
| Total | 7,689 (64.9%) | 354 (4.6%) |
Employment Status by Educational Attainment in Hutchinson
According to labor force statistics for Hutchinson, 83.2% of individuals (5,926) out of the total population between 25 and 64 years of age (7,123) are in the labor force, with 3.0% or 178 of them being unemployed. The group with the highest labor force participation rate are those with the educational attainment of less than high school, with 94.2% or 293 individuals in the labor force. Within the labor force, individuals with less than high school education have the highest percentage of unemployment, with 8.5% or 25 of them being unemployed.
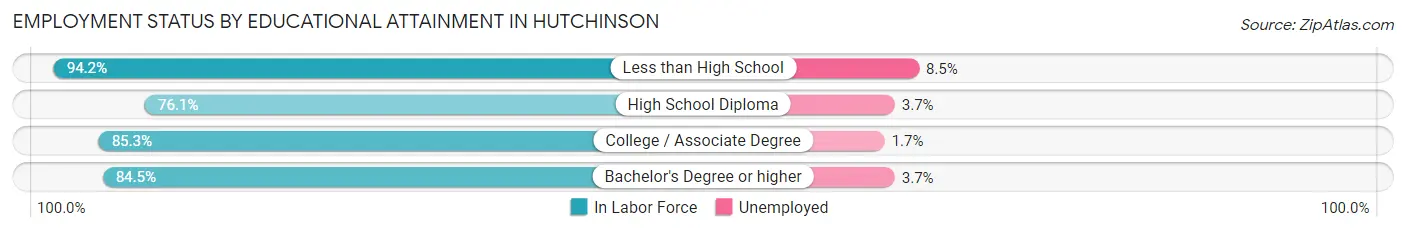
| Educational Attainment | In Labor Force | Unemployed |
| Less than High School | 293 (94.2%) | 26 (8.5%) |
| High School Diploma | 1,320 (76.1%) | 64 (3.7%) |
| College / Associate Degree | 2,875 (85.3%) | 57 (1.7%) |
| Bachelor's Degree or higher | 1,442 (84.5%) | 63 (3.7%) |
| Total | 5,926 (83.2%) | 214 (3.0%) |
Employment Occupations by Sex in Hutchinson
Management, Business, Science and Arts Occupations
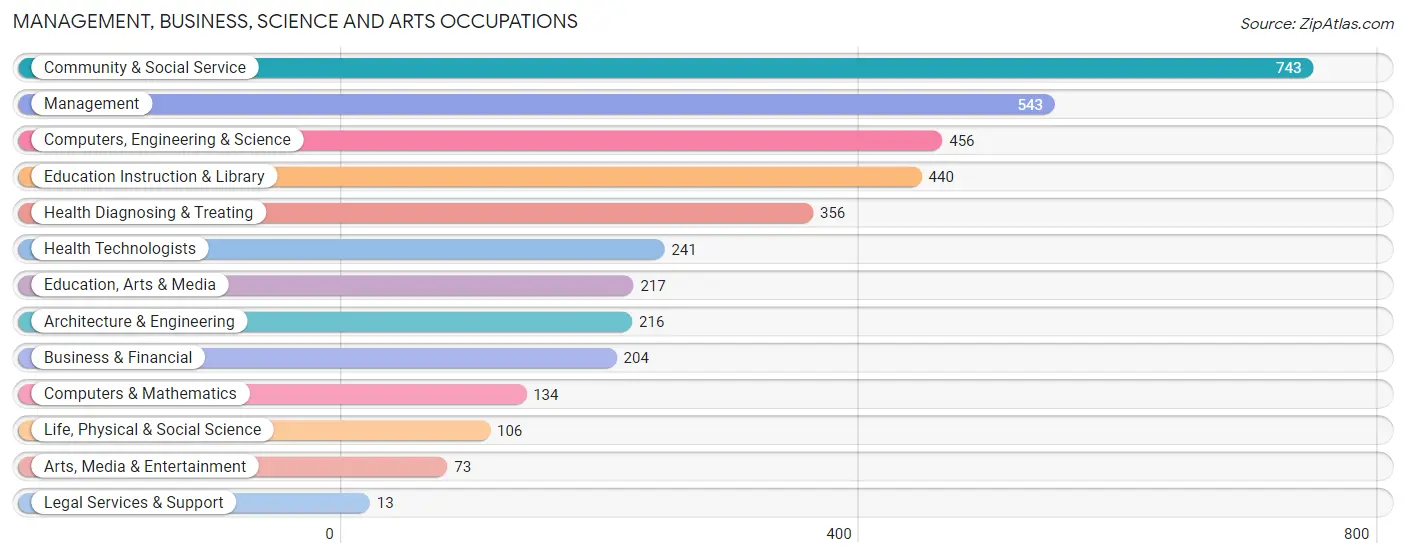
The most common Management, Business, Science and Arts occupations in Hutchinson are Community & Social Service (743 | 10.1%), Management (543 | 7.4%), Computers, Engineering & Science (456 | 6.2%), Education Instruction & Library (440 | 6.0%), and Health Diagnosing & Treating (356 | 4.9%).
Management, Business, Science and Arts Occupations by Sex
Within the Management, Business, Science and Arts occupations in Hutchinson, the most male-oriented occupations are Life, Physical & Social Science (100.0%), Architecture & Engineering (84.7%), and Computers, Engineering & Science (83.6%), while the most female-oriented occupations are Legal Services & Support (100.0%), Health Technologists (95.0%), and Health Diagnosing & Treating (90.2%).
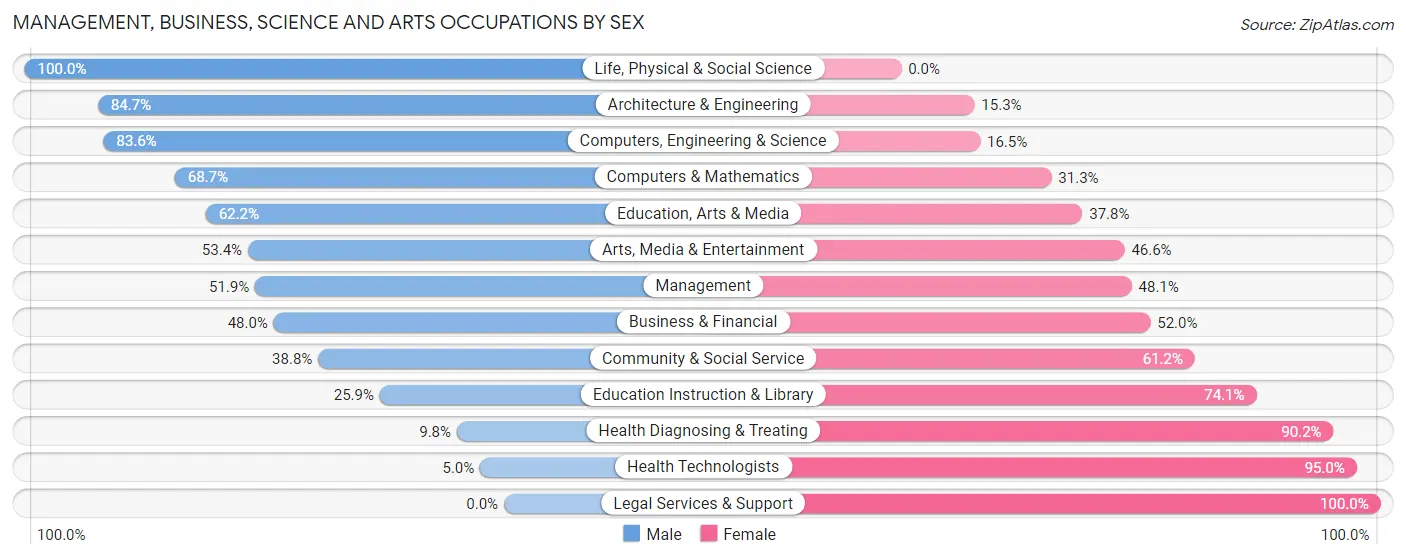
| Occupation | Male | Female |
| Management | 282 (51.9%) | 261 (48.1%) |
| Business & Financial | 98 (48.0%) | 106 (52.0%) |
| Computers, Engineering & Science | 381 (83.6%) | 75 (16.5%) |
| Computers & Mathematics | 92 (68.7%) | 42 (31.3%) |
| Architecture & Engineering | 183 (84.7%) | 33 (15.3%) |
| Life, Physical & Social Science | 106 (100.0%) | 0 (0.0%) |
| Community & Social Service | 288 (38.8%) | 455 (61.2%) |
| Education, Arts & Media | 135 (62.2%) | 82 (37.8%) |
| Legal Services & Support | 0 (0.0%) | 13 (100.0%) |
| Education Instruction & Library | 114 (25.9%) | 326 (74.1%) |
| Arts, Media & Entertainment | 39 (53.4%) | 34 (46.6%) |
| Health Diagnosing & Treating | 35 (9.8%) | 321 (90.2%) |
| Health Technologists | 12 (5.0%) | 229 (95.0%) |
| Total (Category) | 1,084 (47.1%) | 1,218 (52.9%) |
| Total (Overall) | 3,795 (51.7%) | 3,546 (48.3%) |
Services Occupations
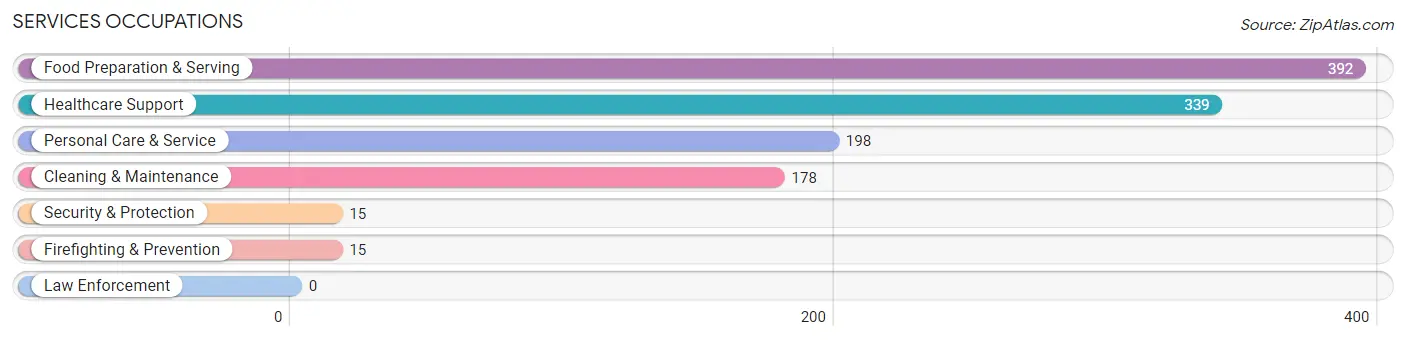
The most common Services occupations in Hutchinson are Food Preparation & Serving (392 | 5.3%), Healthcare Support (339 | 4.6%), Personal Care & Service (198 | 2.7%), Cleaning & Maintenance (178 | 2.4%), and Security & Protection (15 | 0.2%).
Services Occupations by Sex
Within the Services occupations in Hutchinson, the most male-oriented occupations are Security & Protection (100.0%), Firefighting & Prevention (100.0%), and Cleaning & Maintenance (62.4%), while the most female-oriented occupations are Healthcare Support (93.8%), Personal Care & Service (82.8%), and Food Preparation & Serving (62.0%).
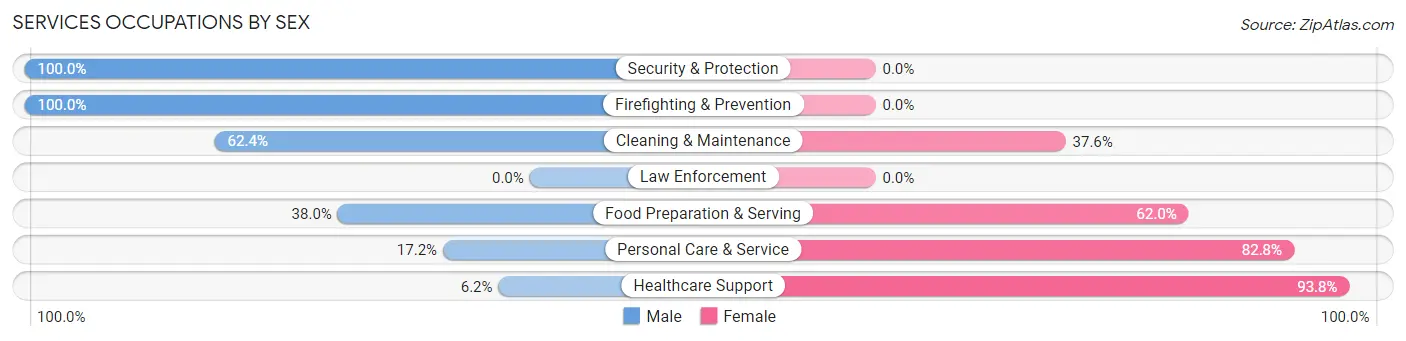
| Occupation | Male | Female |
| Healthcare Support | 21 (6.2%) | 318 (93.8%) |
| Security & Protection | 15 (100.0%) | 0 (0.0%) |
| Firefighting & Prevention | 15 (100.0%) | 0 (0.0%) |
| Law Enforcement | 0 (0.0%) | 0 (0.0%) |
| Food Preparation & Serving | 149 (38.0%) | 243 (62.0%) |
| Cleaning & Maintenance | 111 (62.4%) | 67 (37.6%) |
| Personal Care & Service | 34 (17.2%) | 164 (82.8%) |
| Total (Category) | 330 (29.4%) | 792 (70.6%) |
| Total (Overall) | 3,795 (51.7%) | 3,546 (48.3%) |
Sales and Office Occupations
The most common Sales and Office occupations in Hutchinson are Sales & Related (709 | 9.7%), and Office & Administration (645 | 8.8%).
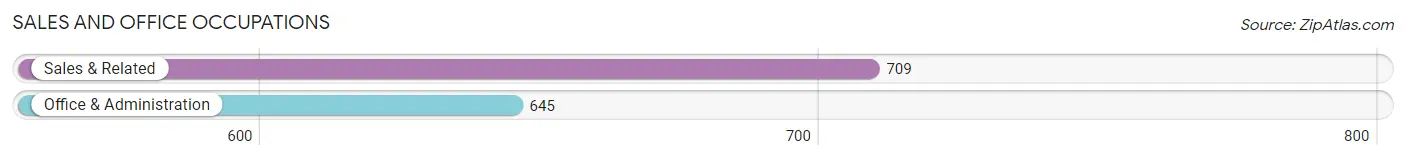
Sales and Office Occupations by Sex
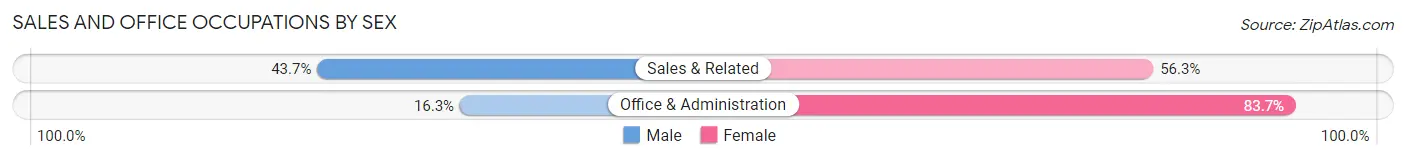
| Occupation | Male | Female |
| Sales & Related | 310 (43.7%) | 399 (56.3%) |
| Office & Administration | 105 (16.3%) | 540 (83.7%) |
| Total (Category) | 415 (30.6%) | 939 (69.4%) |
| Total (Overall) | 3,795 (51.7%) | 3,546 (48.3%) |
Natural Resources, Construction and Maintenance Occupations
The most common Natural Resources, Construction and Maintenance occupations in Hutchinson are Construction & Extraction (450 | 6.1%), Installation, Maintenance & Repair (278 | 3.8%), and Farming, Fishing & Forestry (60 | 0.8%).
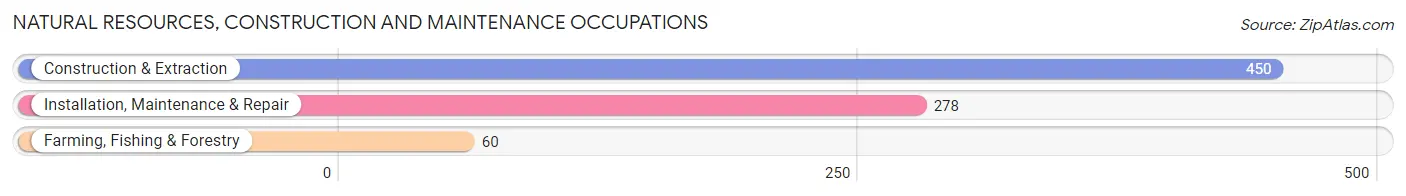
Natural Resources, Construction and Maintenance Occupations by Sex
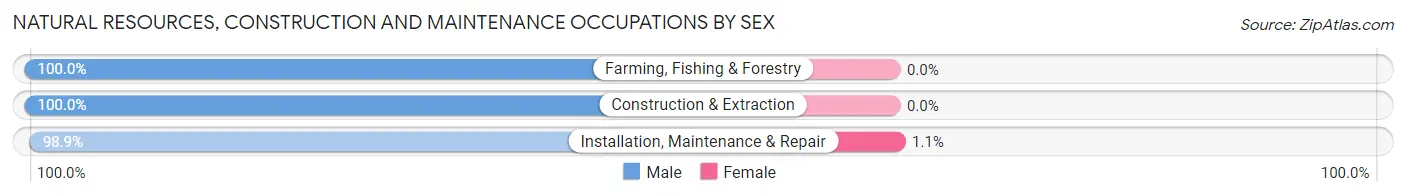
| Occupation | Male | Female |
| Farming, Fishing & Forestry | 60 (100.0%) | 0 (0.0%) |
| Construction & Extraction | 450 (100.0%) | 0 (0.0%) |
| Installation, Maintenance & Repair | 275 (98.9%) | 3 (1.1%) |
| Total (Category) | 785 (99.6%) | 3 (0.4%) |
| Total (Overall) | 3,795 (51.7%) | 3,546 (48.3%) |
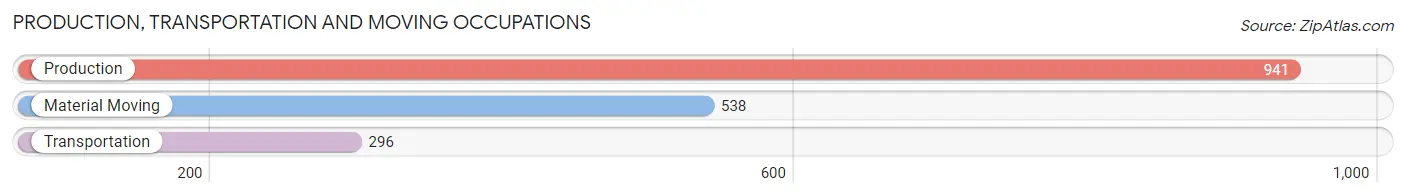
Production, Transportation and Moving Occupations
The most common Production, Transportation and Moving occupations in Hutchinson are Production (941 | 12.8%), Material Moving (538 | 7.3%), and Transportation (296 | 4.0%).
Production, Transportation and Moving Occupations by Sex
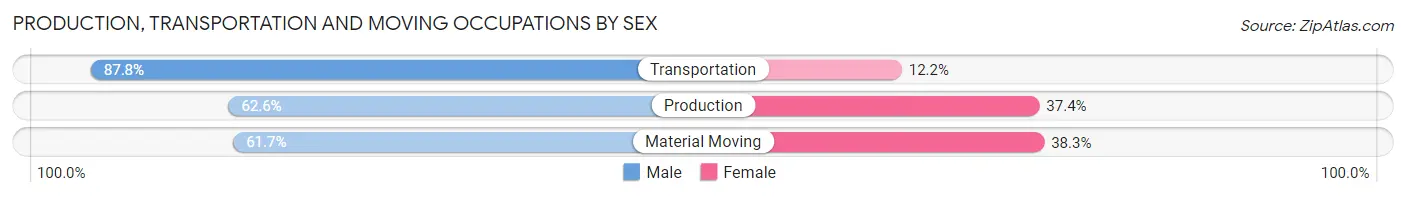
| Occupation | Male | Female |
| Production | 589 (62.6%) | 352 (37.4%) |
| Transportation | 260 (87.8%) | 36 (12.2%) |
| Material Moving | 332 (61.7%) | 206 (38.3%) |
| Total (Category) | 1,181 (66.5%) | 594 (33.5%) |
| Total (Overall) | 3,795 (51.7%) | 3,546 (48.3%) |
Employment Industries by Sex in Hutchinson
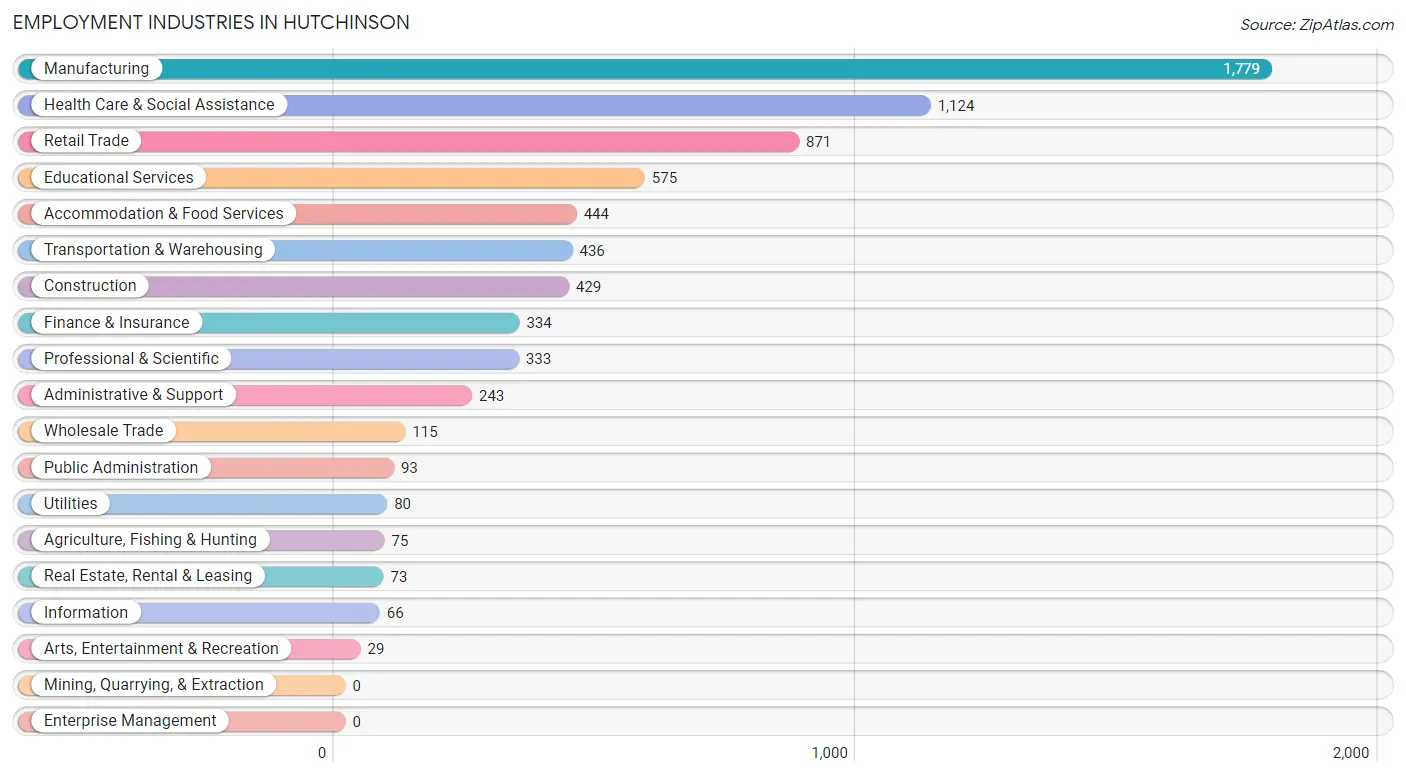
Employment Industries in Hutchinson
The major employment industries in Hutchinson include Manufacturing (1,779 | 24.2%), Health Care & Social Assistance (1,124 | 15.3%), Retail Trade (871 | 11.9%), Educational Services (575 | 7.8%), and Accommodation & Food Services (444 | 6.0%).
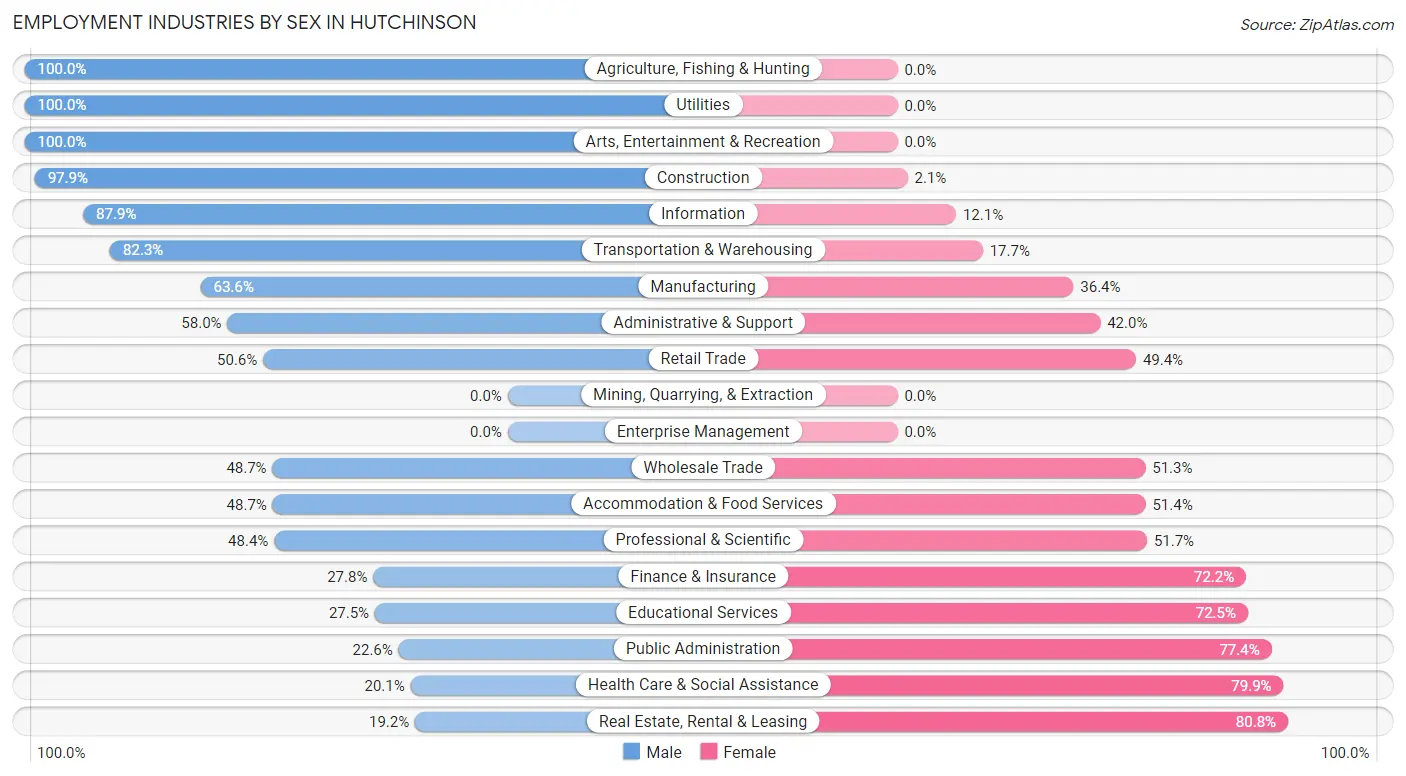
Employment Industries by Sex in Hutchinson
The Hutchinson industries that see more men than women are Agriculture, Fishing & Hunting (100.0%), Utilities (100.0%), and Arts, Entertainment & Recreation (100.0%), whereas the industries that tend to have a higher number of women are Real Estate, Rental & Leasing (80.8%), Health Care & Social Assistance (79.9%), and Public Administration (77.4%).
| Industry | Male | Female |
| Agriculture, Fishing & Hunting | 75 (100.0%) | 0 (0.0%) |
| Mining, Quarrying, & Extraction | 0 (0.0%) | 0 (0.0%) |
| Construction | 420 (97.9%) | 9 (2.1%) |
| Manufacturing | 1,131 (63.6%) | 648 (36.4%) |
| Wholesale Trade | 56 (48.7%) | 59 (51.3%) |
| Retail Trade | 441 (50.6%) | 430 (49.4%) |
| Transportation & Warehousing | 359 (82.3%) | 77 (17.7%) |
| Utilities | 80 (100.0%) | 0 (0.0%) |
| Information | 58 (87.9%) | 8 (12.1%) |
| Finance & Insurance | 93 (27.8%) | 241 (72.2%) |
| Real Estate, Rental & Leasing | 14 (19.2%) | 59 (80.8%) |
| Professional & Scientific | 161 (48.3%) | 172 (51.6%) |
| Enterprise Management | 0 (0.0%) | 0 (0.0%) |
| Administrative & Support | 141 (58.0%) | 102 (42.0%) |
| Educational Services | 158 (27.5%) | 417 (72.5%) |
| Health Care & Social Assistance | 226 (20.1%) | 898 (79.9%) |
| Arts, Entertainment & Recreation | 29 (100.0%) | 0 (0.0%) |
| Accommodation & Food Services | 216 (48.6%) | 228 (51.3%) |
| Public Administration | 21 (22.6%) | 72 (77.4%) |
| Total | 3,795 (51.7%) | 3,546 (48.3%) |
Education in Hutchinson
School Enrollment in Hutchinson
The most common levels of schooling among the 2,927 students in Hutchinson are high school (787 | 26.9%), middle school (589 | 20.1%), and elementary school (558 | 19.1%).
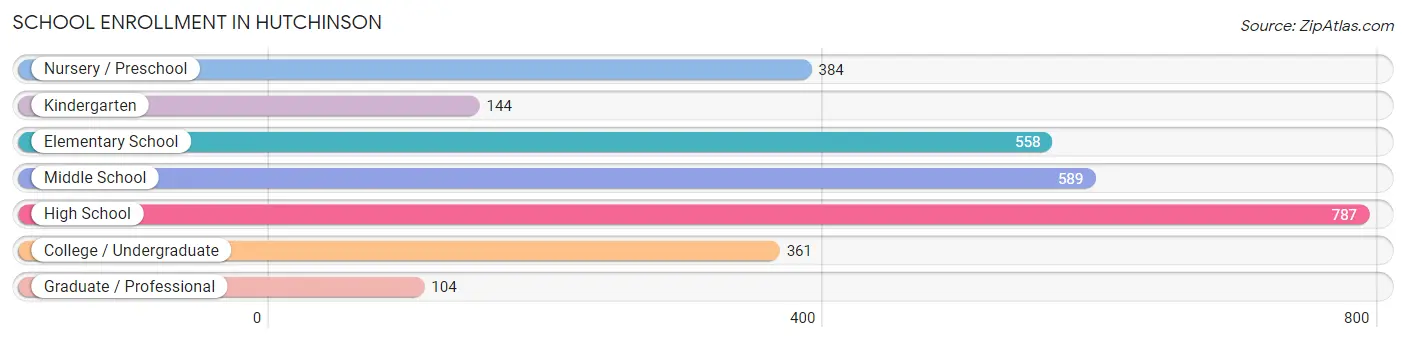
| School Level | # Students | % Students |
| Nursery / Preschool | 384 | 13.1% |
| Kindergarten | 144 | 4.9% |
| Elementary School | 558 | 19.1% |
| Middle School | 589 | 20.1% |
| High School | 787 | 26.9% |
| College / Undergraduate | 361 | 12.3% |
| Graduate / Professional | 104 | 3.5% |
| Total | 2,927 | 100.0% |
School Enrollment by Age by Funding Source in Hutchinson
Out of a total of 2,927 students who are enrolled in schools in Hutchinson, 319 (10.9%) attend a private institution, while the remaining 2,608 (89.1%) are enrolled in public schools. The age group of 25 to 34 year olds has the highest likelihood of being enrolled in private schools, with 36 (33.3% in the age bracket) enrolled. Conversely, the age group of 15 to 17 year olds has the lowest likelihood of being enrolled in a private school, with 439 (100.0% in the age bracket) attending a public institution.
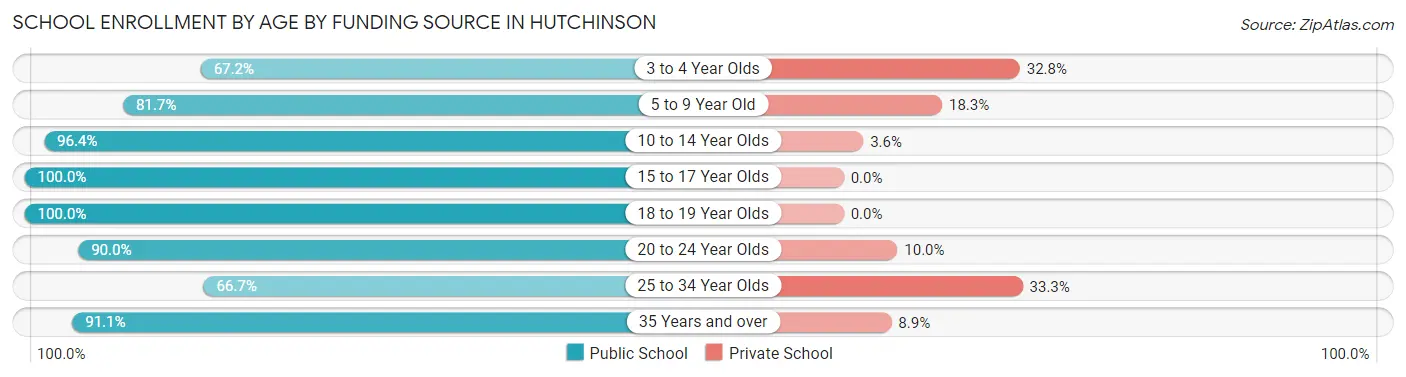
| Age Bracket | Public School | Private School |
| 3 to 4 Year Olds | 170 (67.2%) | 83 (32.8%) |
| 5 to 9 Year Old | 606 (81.7%) | 136 (18.3%) |
| 10 to 14 Year Olds | 741 (96.4%) | 28 (3.6%) |
| 15 to 17 Year Olds | 439 (100.0%) | 0 (0.0%) |
| 18 to 19 Year Olds | 246 (100.0%) | 0 (0.0%) |
| 20 to 24 Year Olds | 171 (90.0%) | 19 (10.0%) |
| 25 to 34 Year Olds | 72 (66.7%) | 36 (33.3%) |
| 35 Years and over | 164 (91.1%) | 16 (8.9%) |
| Total | 2,608 (89.1%) | 319 (10.9%) |
Educational Attainment by Field of Study in Hutchinson
Education (559 | 20.9%), business (381 | 14.2%), science & technology (345 | 12.9%), engineering (227 | 8.5%), and bio, nature & agricultural (200 | 7.5%) are the most common fields of study among 2,679 individuals in Hutchinson who have obtained a bachelor's degree or higher.
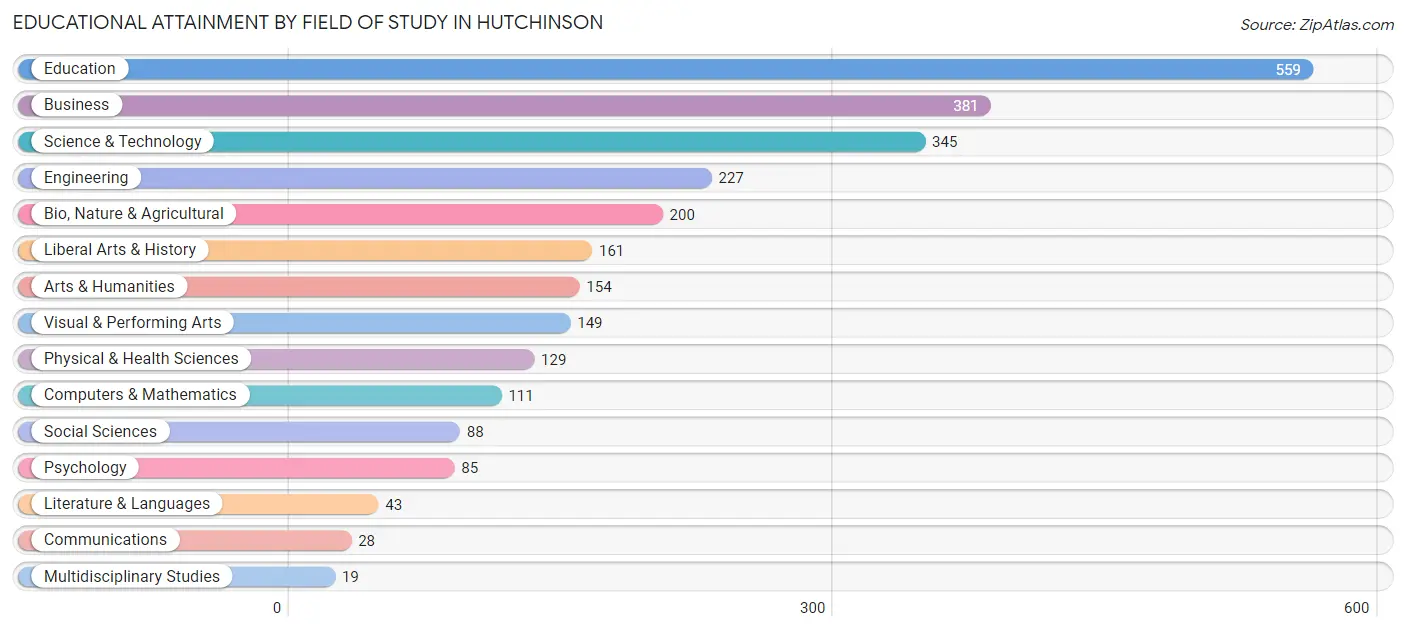
| Field of Study | # Graduates | % Graduates |
| Computers & Mathematics | 111 | 4.1% |
| Bio, Nature & Agricultural | 200 | 7.5% |
| Physical & Health Sciences | 129 | 4.8% |
| Psychology | 85 | 3.2% |
| Social Sciences | 88 | 3.3% |
| Engineering | 227 | 8.5% |
| Multidisciplinary Studies | 19 | 0.7% |
| Science & Technology | 345 | 12.9% |
| Business | 381 | 14.2% |
| Education | 559 | 20.9% |
| Literature & Languages | 43 | 1.6% |
| Liberal Arts & History | 161 | 6.0% |
| Visual & Performing Arts | 149 | 5.6% |
| Communications | 28 | 1.1% |
| Arts & Humanities | 154 | 5.8% |
| Total | 2,679 | 100.0% |
Transportation & Commute in Hutchinson
Vehicle Availability by Sex in Hutchinson
The most prevalent vehicle ownership categories in Hutchinson are males with 2 vehicles (1,798, accounting for 48.9%) and females with 2 vehicles (1,506, making up 53.1%).
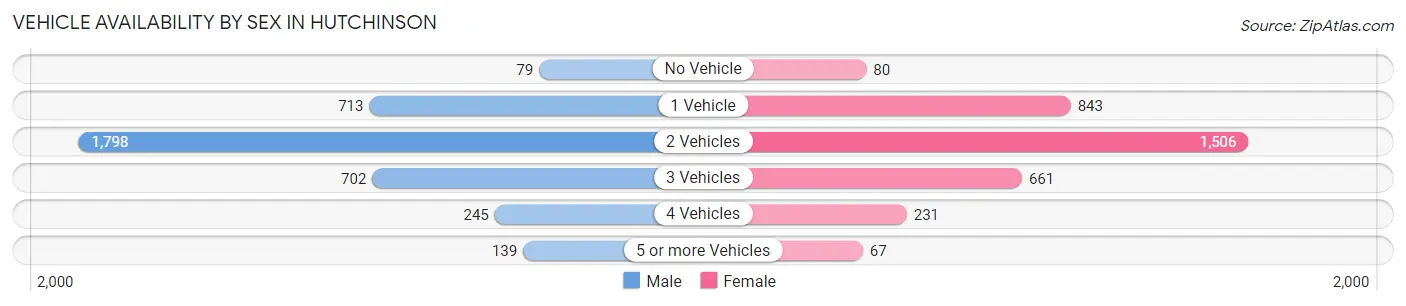
| Vehicles Available | Male | Female |
| No Vehicle | 79 (2.1%) | 80 (2.4%) |
| 1 Vehicle | 713 (19.4%) | 843 (24.9%) |
| 2 Vehicles | 1,798 (48.9%) | 1,506 (44.5%) |
| 3 Vehicles | 702 (19.1%) | 661 (19.5%) |
| 4 Vehicles | 245 (6.7%) | 231 (6.8%) |
| 5 or more Vehicles | 139 (3.8%) | 67 (2.0%) |
| Total | 3,676 (100.0%) | 3,388 (100.0%) |
Commute Time in Hutchinson
The most frequently occuring commute durations in Hutchinson are 5 to 9 minutes (2,409 commuters, 36.3%), 10 to 14 minutes (1,006 commuters, 15.1%), and less than 5 minutes (542 commuters, 8.2%).
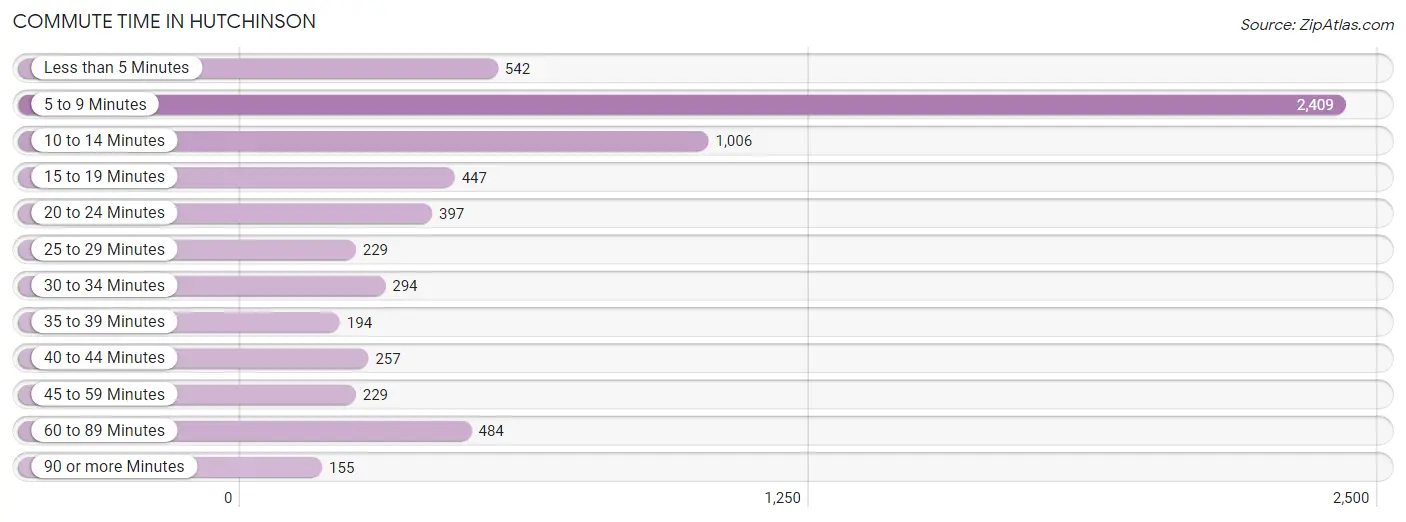
| Commute Time | # Commuters | % Commuters |
| Less than 5 Minutes | 542 | 8.2% |
| 5 to 9 Minutes | 2,409 | 36.3% |
| 10 to 14 Minutes | 1,006 | 15.1% |
| 15 to 19 Minutes | 447 | 6.7% |
| 20 to 24 Minutes | 397 | 6.0% |
| 25 to 29 Minutes | 229 | 3.5% |
| 30 to 34 Minutes | 294 | 4.4% |
| 35 to 39 Minutes | 194 | 2.9% |
| 40 to 44 Minutes | 257 | 3.9% |
| 45 to 59 Minutes | 229 | 3.5% |
| 60 to 89 Minutes | 484 | 7.3% |
| 90 or more Minutes | 155 | 2.3% |
Commute Time by Sex in Hutchinson
The most common commute times in Hutchinson are 5 to 9 minutes (1,103 commuters, 31.5%) for males and 5 to 9 minutes (1,306 commuters, 41.5%) for females.
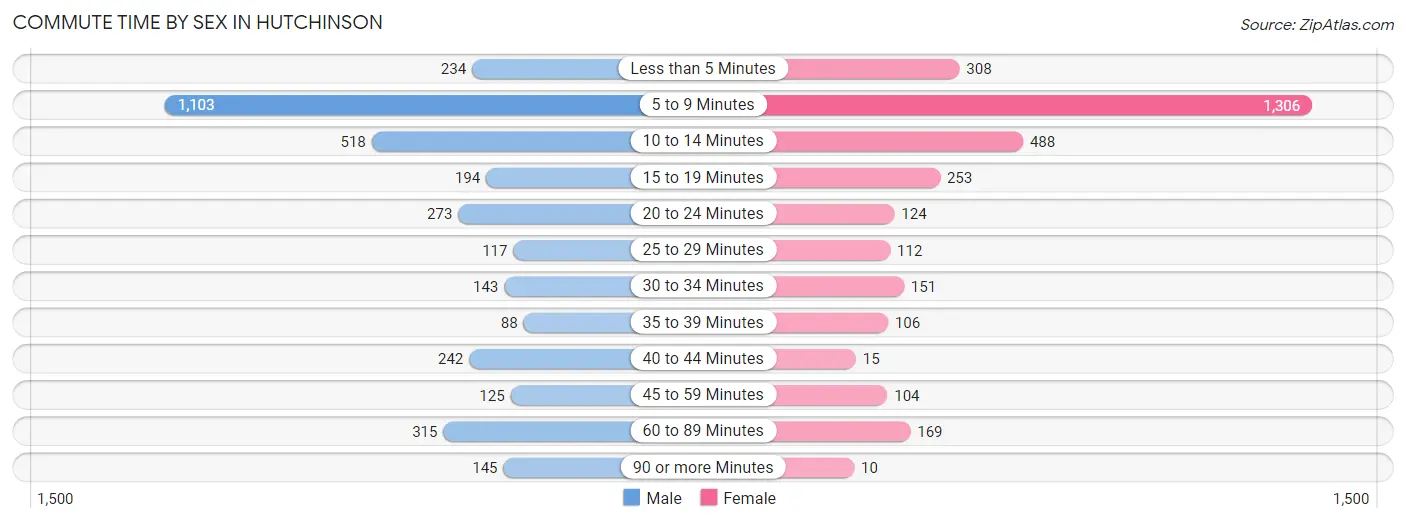
| Commute Time | Male | Female |
| Less than 5 Minutes | 234 (6.7%) | 308 (9.8%) |
| 5 to 9 Minutes | 1,103 (31.5%) | 1,306 (41.5%) |
| 10 to 14 Minutes | 518 (14.8%) | 488 (15.5%) |
| 15 to 19 Minutes | 194 (5.6%) | 253 (8.0%) |
| 20 to 24 Minutes | 273 (7.8%) | 124 (3.9%) |
| 25 to 29 Minutes | 117 (3.4%) | 112 (3.6%) |
| 30 to 34 Minutes | 143 (4.1%) | 151 (4.8%) |
| 35 to 39 Minutes | 88 (2.5%) | 106 (3.4%) |
| 40 to 44 Minutes | 242 (6.9%) | 15 (0.5%) |
| 45 to 59 Minutes | 125 (3.6%) | 104 (3.3%) |
| 60 to 89 Minutes | 315 (9.0%) | 169 (5.4%) |
| 90 or more Minutes | 145 (4.2%) | 10 (0.3%) |
Time of Departure to Work by Sex in Hutchinson
The most frequent times of departure to work in Hutchinson are 6:30 AM to 6:59 AM (508, 14.5%) for males and 7:30 AM to 7:59 AM (460, 14.6%) for females.
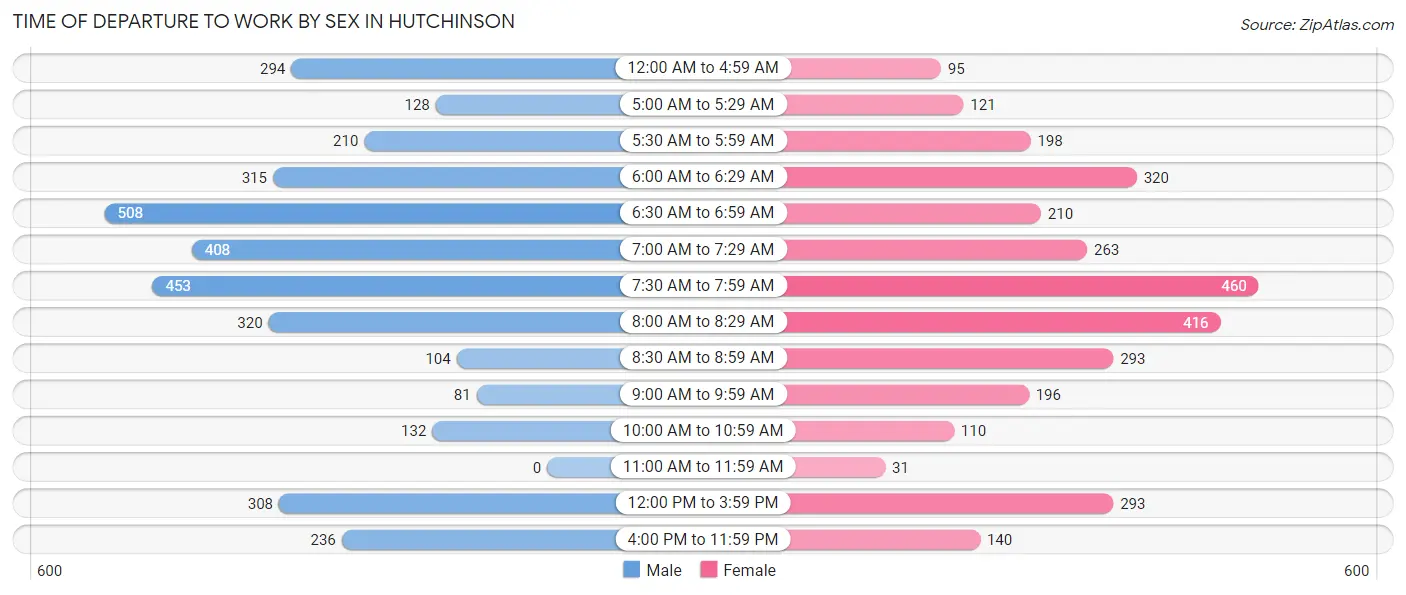
| Time of Departure | Male | Female |
| 12:00 AM to 4:59 AM | 294 (8.4%) | 95 (3.0%) |
| 5:00 AM to 5:29 AM | 128 (3.7%) | 121 (3.8%) |
| 5:30 AM to 5:59 AM | 210 (6.0%) | 198 (6.3%) |
| 6:00 AM to 6:29 AM | 315 (9.0%) | 320 (10.2%) |
| 6:30 AM to 6:59 AM | 508 (14.5%) | 210 (6.7%) |
| 7:00 AM to 7:29 AM | 408 (11.7%) | 263 (8.4%) |
| 7:30 AM to 7:59 AM | 453 (13.0%) | 460 (14.6%) |
| 8:00 AM to 8:29 AM | 320 (9.1%) | 416 (13.2%) |
| 8:30 AM to 8:59 AM | 104 (3.0%) | 293 (9.3%) |
| 9:00 AM to 9:59 AM | 81 (2.3%) | 196 (6.2%) |
| 10:00 AM to 10:59 AM | 132 (3.8%) | 110 (3.5%) |
| 11:00 AM to 11:59 AM | 0 (0.0%) | 31 (1.0%) |
| 12:00 PM to 3:59 PM | 308 (8.8%) | 293 (9.3%) |
| 4:00 PM to 11:59 PM | 236 (6.8%) | 140 (4.4%) |
| Total | 3,497 (100.0%) | 3,146 (100.0%) |
Housing Occupancy in Hutchinson
Occupancy by Ownership in Hutchinson
Of the total 6,368 dwellings in Hutchinson, owner-occupied units account for 4,347 (68.3%), while renter-occupied units make up 2,021 (31.7%).
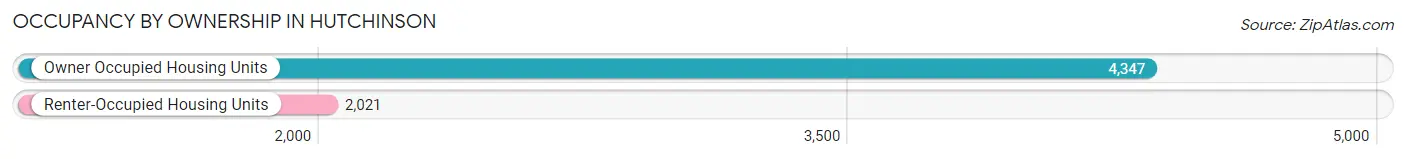
| Occupancy | # Housing Units | % Housing Units |
| Owner Occupied Housing Units | 4,347 | 68.3% |
| Renter-Occupied Housing Units | 2,021 | 31.7% |
| Total Occupied Housing Units | 6,368 | 100.0% |
Occupancy by Household Size in Hutchinson
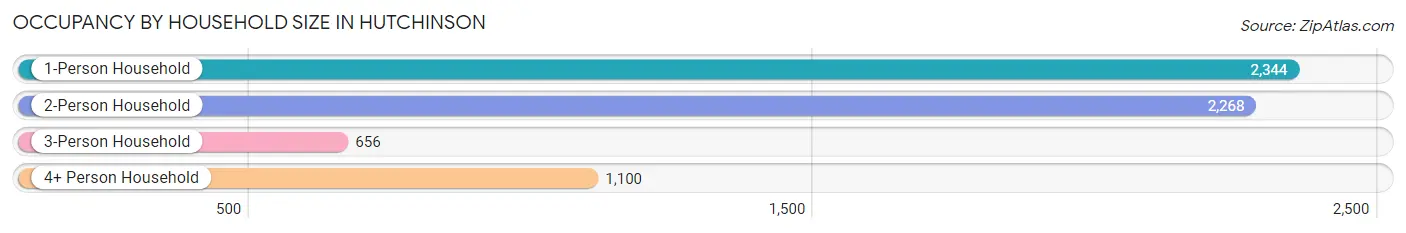
| Household Size | # Housing Units | % Housing Units |
| 1-Person Household | 2,344 | 36.8% |
| 2-Person Household | 2,268 | 35.6% |
| 3-Person Household | 656 | 10.3% |
| 4+ Person Household | 1,100 | 17.3% |
| Total Housing Units | 6,368 | 100.0% |
Occupancy by Ownership by Household Size in Hutchinson
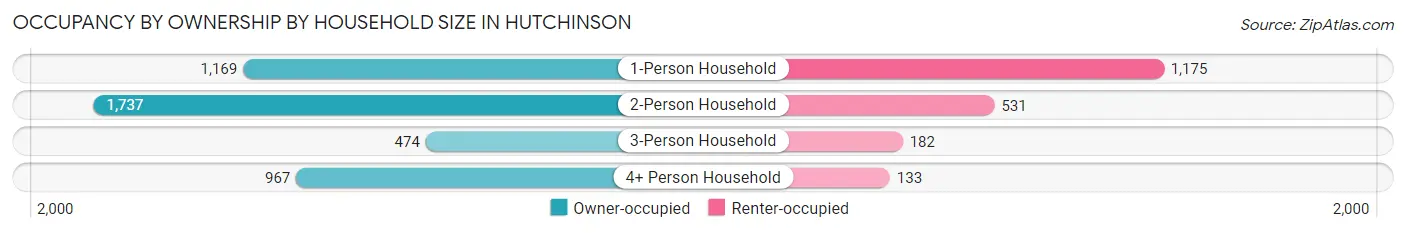
| Household Size | Owner-occupied | Renter-occupied |
| 1-Person Household | 1,169 (49.9%) | 1,175 (50.1%) |
| 2-Person Household | 1,737 (76.6%) | 531 (23.4%) |
| 3-Person Household | 474 (72.3%) | 182 (27.7%) |
| 4+ Person Household | 967 (87.9%) | 133 (12.1%) |
| Total Housing Units | 4,347 (68.3%) | 2,021 (31.7%) |
Occupancy by Educational Attainment in Hutchinson
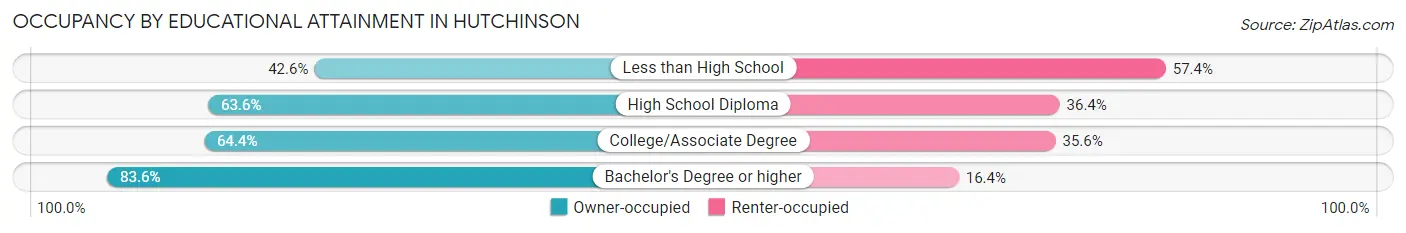
| Household Size | Owner-occupied | Renter-occupied |
| Less than High School | 89 (42.6%) | 120 (57.4%) |
| High School Diploma | 1,083 (63.6%) | 619 (36.4%) |
| College/Associate Degree | 1,853 (64.4%) | 1,023 (35.6%) |
| Bachelor's Degree or higher | 1,322 (83.6%) | 259 (16.4%) |
Occupancy by Age of Householder in Hutchinson
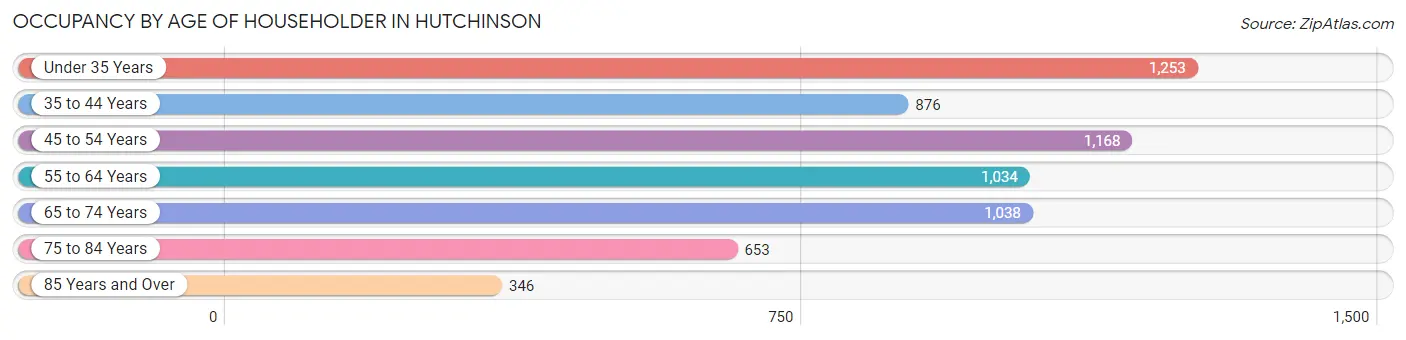
| Age Bracket | # Households | % Households |
| Under 35 Years | 1,253 | 19.7% |
| 35 to 44 Years | 876 | 13.8% |
| 45 to 54 Years | 1,168 | 18.3% |
| 55 to 64 Years | 1,034 | 16.2% |
| 65 to 74 Years | 1,038 | 16.3% |
| 75 to 84 Years | 653 | 10.2% |
| 85 Years and Over | 346 | 5.4% |
| Total | 6,368 | 100.0% |
Housing Finances in Hutchinson
Median Income by Occupancy in Hutchinson
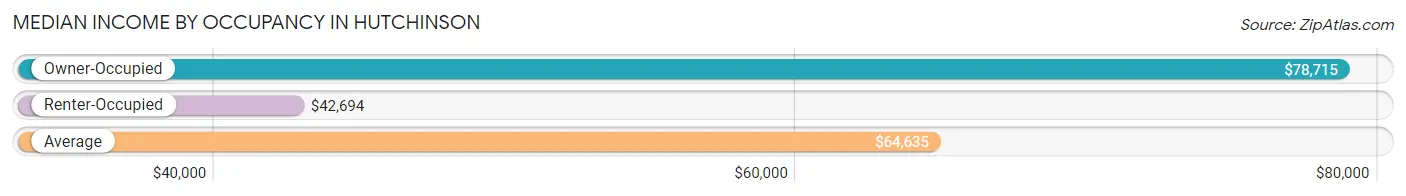
| Occupancy Type | # Households | Median Income |
| Owner-Occupied | 4,347 (68.3%) | $78,715 |
| Renter-Occupied | 2,021 (31.7%) | $42,694 |
| Average | 6,368 (100.0%) | $64,635 |
Occupancy by Householder Income Bracket in Hutchinson
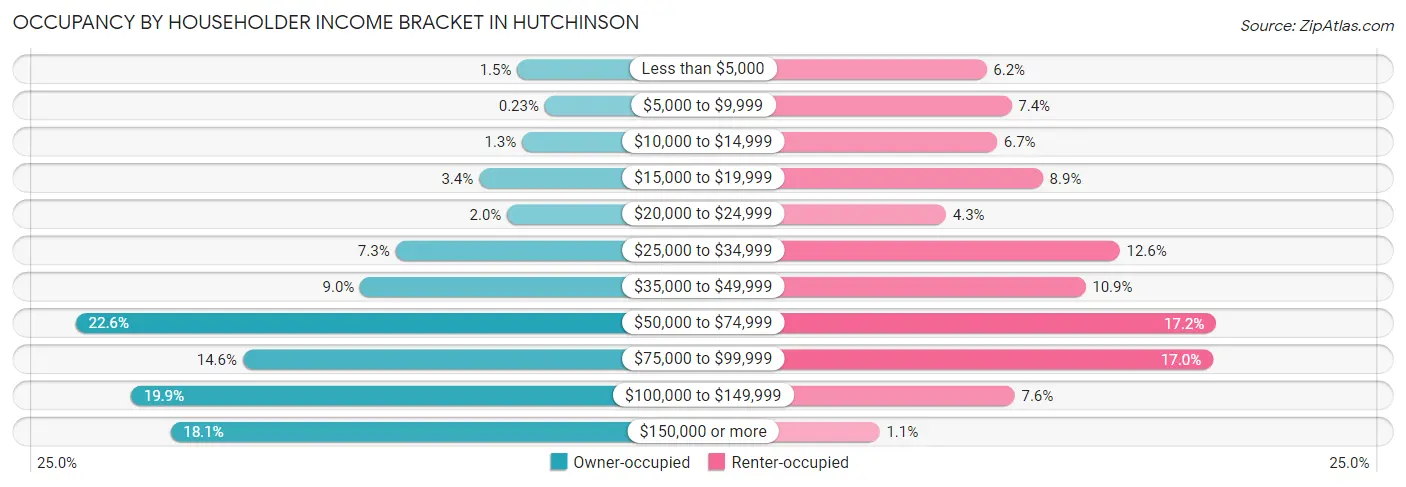
| Income Bracket | Owner-occupied | Renter-occupied |
| Less than $5,000 | 67 (1.5%) | 126 (6.2%) |
| $5,000 to $9,999 | 10 (0.2%) | 150 (7.4%) |
| $10,000 to $14,999 | 57 (1.3%) | 136 (6.7%) |
| $15,000 to $19,999 | 146 (3.4%) | 180 (8.9%) |
| $20,000 to $24,999 | 88 (2.0%) | 87 (4.3%) |
| $25,000 to $34,999 | 319 (7.3%) | 254 (12.6%) |
| $35,000 to $49,999 | 392 (9.0%) | 221 (10.9%) |
| $50,000 to $74,999 | 981 (22.6%) | 347 (17.2%) |
| $75,000 to $99,999 | 635 (14.6%) | 344 (17.0%) |
| $100,000 to $149,999 | 867 (19.9%) | 153 (7.6%) |
| $150,000 or more | 785 (18.1%) | 23 (1.1%) |
| Total | 4,347 (100.0%) | 2,021 (100.0%) |
Monthly Housing Cost Tiers in Hutchinson
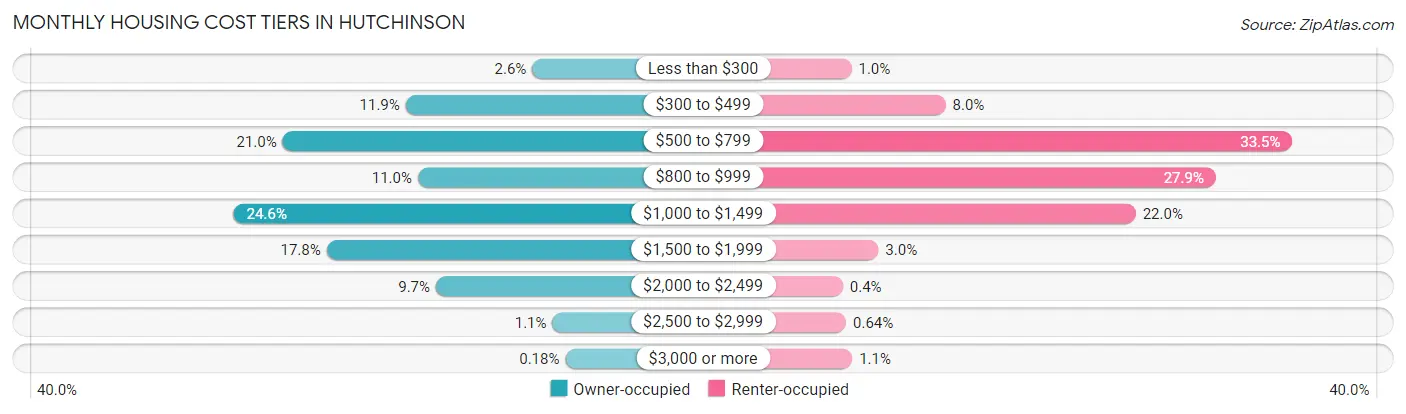
| Monthly Cost | Owner-occupied | Renter-occupied |
| Less than $300 | 114 (2.6%) | 21 (1.0%) |
| $300 to $499 | 519 (11.9%) | 161 (8.0%) |
| $500 to $799 | 913 (21.0%) | 677 (33.5%) |
| $800 to $999 | 480 (11.0%) | 563 (27.9%) |
| $1,000 to $1,499 | 1,070 (24.6%) | 444 (22.0%) |
| $1,500 to $1,999 | 772 (17.8%) | 61 (3.0%) |
| $2,000 to $2,499 | 422 (9.7%) | 8 (0.4%) |
| $2,500 to $2,999 | 49 (1.1%) | 13 (0.6%) |
| $3,000 or more | 8 (0.2%) | 22 (1.1%) |
| Total | 4,347 (100.0%) | 2,021 (100.0%) |
Physical Housing Characteristics in Hutchinson
Housing Structures in Hutchinson
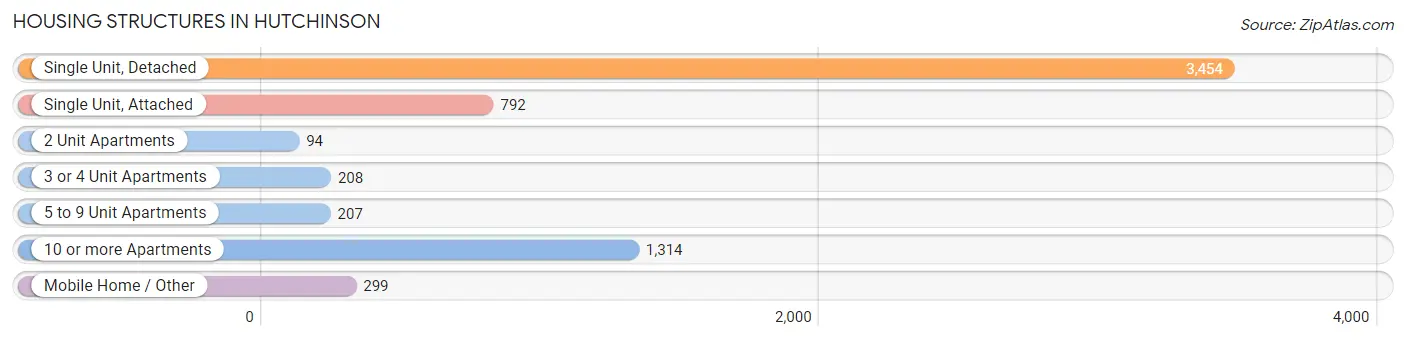
| Structure Type | # Housing Units | % Housing Units |
| Single Unit, Detached | 3,454 | 54.2% |
| Single Unit, Attached | 792 | 12.4% |
| 2 Unit Apartments | 94 | 1.5% |
| 3 or 4 Unit Apartments | 208 | 3.3% |
| 5 to 9 Unit Apartments | 207 | 3.3% |
| 10 or more Apartments | 1,314 | 20.6% |
| Mobile Home / Other | 299 | 4.7% |
| Total | 6,368 | 100.0% |
Housing Structures by Occupancy in Hutchinson
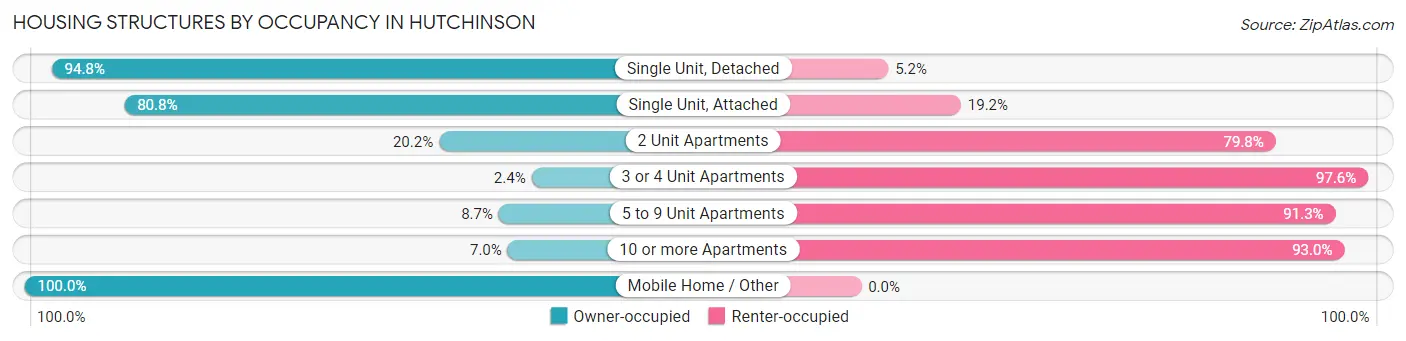
| Structure Type | Owner-occupied | Renter-occupied |
| Single Unit, Detached | 3,274 (94.8%) | 180 (5.2%) |
| Single Unit, Attached | 640 (80.8%) | 152 (19.2%) |
| 2 Unit Apartments | 19 (20.2%) | 75 (79.8%) |
| 3 or 4 Unit Apartments | 5 (2.4%) | 203 (97.6%) |
| 5 to 9 Unit Apartments | 18 (8.7%) | 189 (91.3%) |
| 10 or more Apartments | 92 (7.0%) | 1,222 (93.0%) |
| Mobile Home / Other | 299 (100.0%) | 0 (0.0%) |
| Total | 4,347 (68.3%) | 2,021 (31.7%) |
Housing Structures by Number of Rooms in Hutchinson
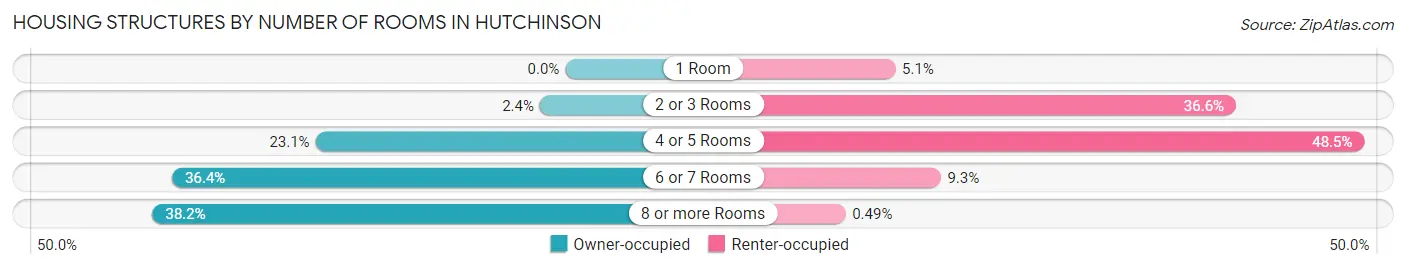
| Number of Rooms | Owner-occupied | Renter-occupied |
| 1 Room | 0 (0.0%) | 103 (5.1%) |
| 2 or 3 Rooms | 102 (2.4%) | 740 (36.6%) |
| 4 or 5 Rooms | 1,004 (23.1%) | 980 (48.5%) |
| 6 or 7 Rooms | 1,581 (36.4%) | 188 (9.3%) |
| 8 or more Rooms | 1,660 (38.2%) | 10 (0.5%) |
| Total | 4,347 (100.0%) | 2,021 (100.0%) |
Housing Structure by Heating Type in Hutchinson
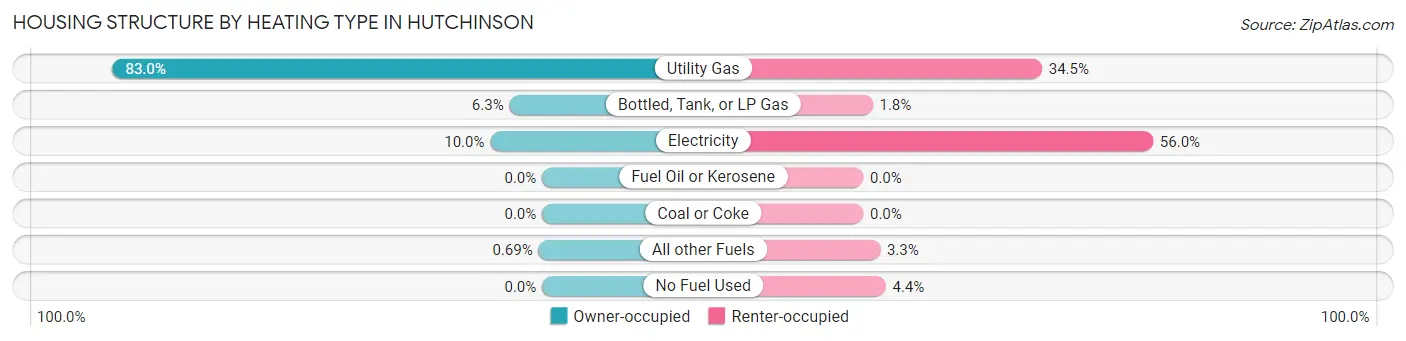
| Heating Type | Owner-occupied | Renter-occupied |
| Utility Gas | 3,608 (83.0%) | 698 (34.5%) |
| Bottled, Tank, or LP Gas | 274 (6.3%) | 37 (1.8%) |
| Electricity | 435 (10.0%) | 1,132 (56.0%) |
| Fuel Oil or Kerosene | 0 (0.0%) | 0 (0.0%) |
| Coal or Coke | 0 (0.0%) | 0 (0.0%) |
| All other Fuels | 30 (0.7%) | 66 (3.3%) |
| No Fuel Used | 0 (0.0%) | 88 (4.3%) |
| Total | 4,347 (100.0%) | 2,021 (100.0%) |
Household Vehicle Usage in Hutchinson
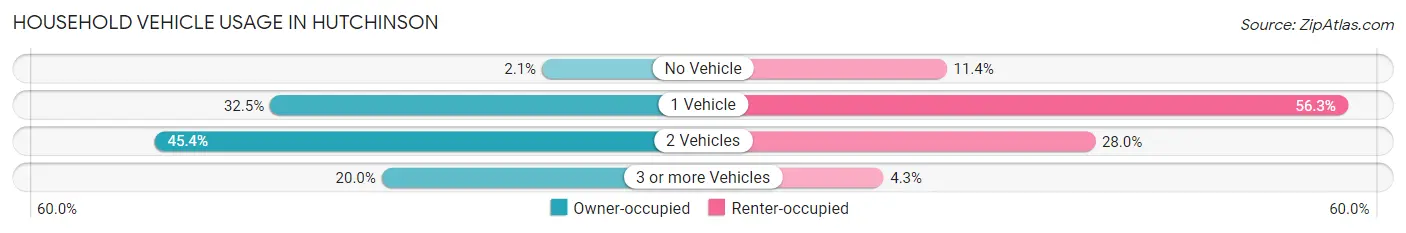
| Vehicles per Household | Owner-occupied | Renter-occupied |
| No Vehicle | 89 (2.1%) | 230 (11.4%) |
| 1 Vehicle | 1,413 (32.5%) | 1,138 (56.3%) |
| 2 Vehicles | 1,975 (45.4%) | 566 (28.0%) |
| 3 or more Vehicles | 870 (20.0%) | 87 (4.3%) |
| Total | 4,347 (100.0%) | 2,021 (100.0%) |
Real Estate & Mortgages in Hutchinson
Real Estate and Mortgage Overview in Hutchinson
| Characteristic | Without Mortgage | With Mortgage |
| Housing Units | 1,685 | 2,662 |
| Median Property Value | $175,700 | $191,100 |
| Median Household Income | $59,782 | $438 |
| Monthly Housing Costs | $557 | $8 |
| Real Estate Taxes | $2,527 | $4 |
Property Value by Mortgage Status in Hutchinson
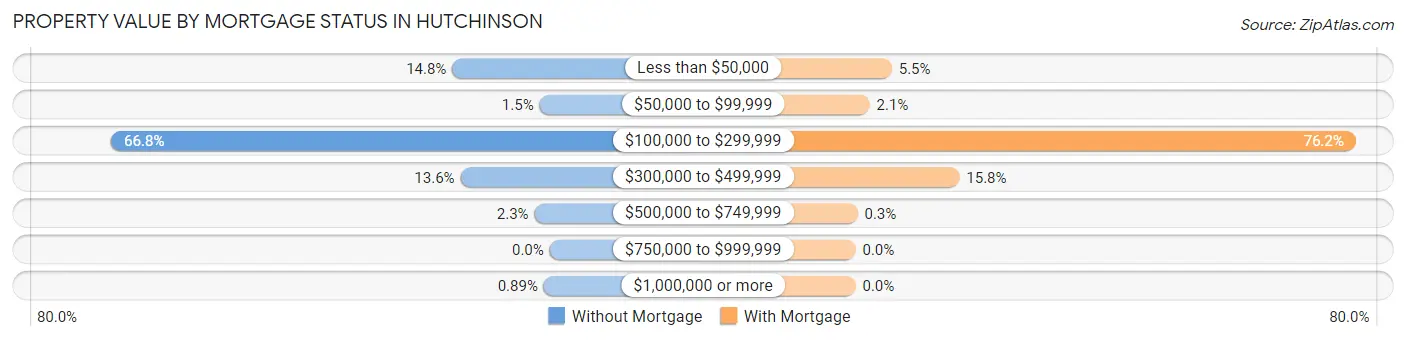
| Property Value | Without Mortgage | With Mortgage |
| Less than $50,000 | 250 (14.8%) | 147 (5.5%) |
| $50,000 to $99,999 | 26 (1.5%) | 57 (2.1%) |
| $100,000 to $299,999 | 1,126 (66.8%) | 2,029 (76.2%) |
| $300,000 to $499,999 | 229 (13.6%) | 421 (15.8%) |
| $500,000 to $749,999 | 39 (2.3%) | 8 (0.3%) |
| $750,000 to $999,999 | 0 (0.0%) | 0 (0.0%) |
| $1,000,000 or more | 15 (0.9%) | 0 (0.0%) |
| Total | 1,685 (100.0%) | 2,662 (100.0%) |
Household Income by Mortgage Status in Hutchinson
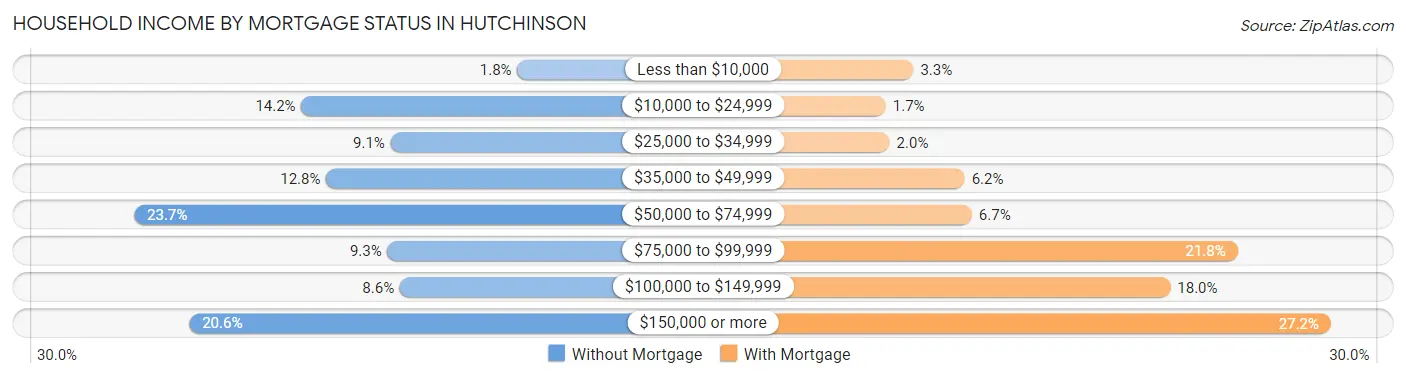
| Household Income | Without Mortgage | With Mortgage |
| Less than $10,000 | 31 (1.8%) | 88 (3.3%) |
| $10,000 to $24,999 | 239 (14.2%) | 46 (1.7%) |
| $25,000 to $34,999 | 153 (9.1%) | 52 (1.9%) |
| $35,000 to $49,999 | 215 (12.8%) | 166 (6.2%) |
| $50,000 to $74,999 | 400 (23.7%) | 177 (6.7%) |
| $75,000 to $99,999 | 156 (9.3%) | 581 (21.8%) |
| $100,000 to $149,999 | 144 (8.6%) | 479 (18.0%) |
| $150,000 or more | 347 (20.6%) | 723 (27.2%) |
| Total | 1,685 (100.0%) | 2,662 (100.0%) |
Property Value to Household Income Ratio in Hutchinson
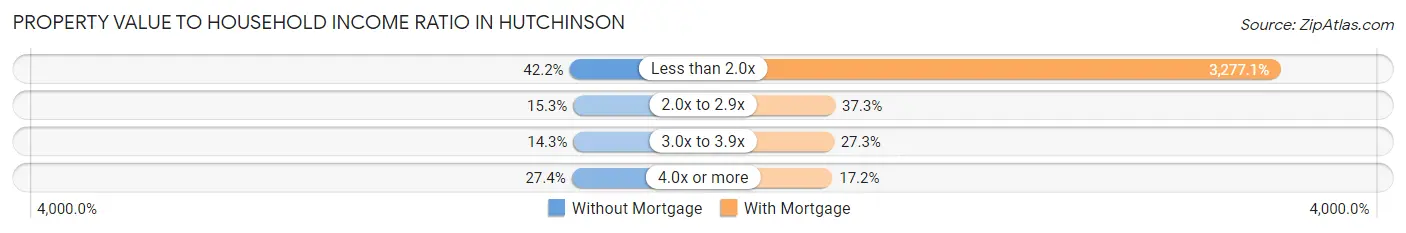
| Value-to-Income Ratio | Without Mortgage | With Mortgage |
| Less than 2.0x | 711 (42.2%) | 87,237 (3,277.1%) |
| 2.0x to 2.9x | 258 (15.3%) | 994 (37.3%) |
| 3.0x to 3.9x | 241 (14.3%) | 727 (27.3%) |
| 4.0x or more | 461 (27.4%) | 459 (17.2%) |
| Total | 1,685 (100.0%) | 2,662 (100.0%) |
Real Estate Taxes by Mortgage Status in Hutchinson
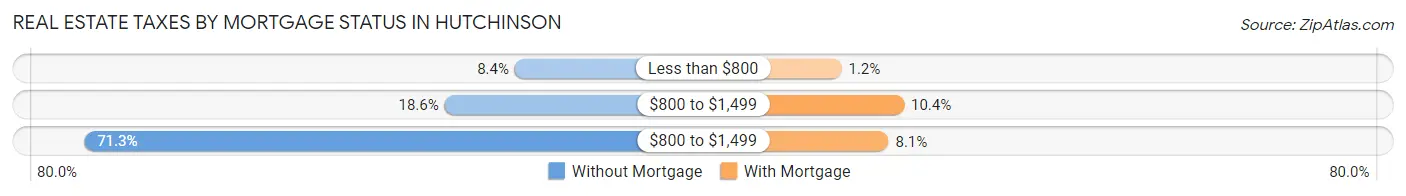
| Property Taxes | Without Mortgage | With Mortgage |
| Less than $800 | 141 (8.4%) | 33 (1.2%) |
| $800 to $1,499 | 314 (18.6%) | 276 (10.4%) |
| $800 to $1,499 | 1,201 (71.3%) | 216 (8.1%) |
| Total | 1,685 (100.0%) | 2,662 (100.0%) |
Health & Disability in Hutchinson
Health Insurance Coverage by Age in Hutchinson
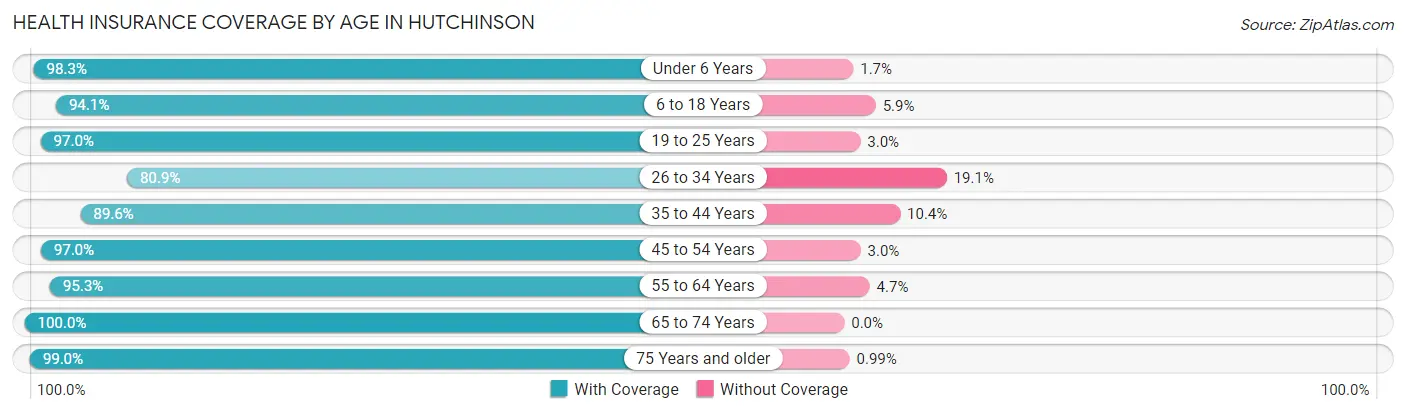
| Age Bracket | With Coverage | Without Coverage |
| Under 6 Years | 1,228 (98.3%) | 21 (1.7%) |
| 6 to 18 Years | 1,816 (94.1%) | 113 (5.9%) |
| 19 to 25 Years | 1,195 (97.0%) | 37 (3.0%) |
| 26 to 34 Years | 1,402 (80.9%) | 331 (19.1%) |
| 35 to 44 Years | 1,471 (89.6%) | 171 (10.4%) |
| 45 to 54 Years | 1,723 (97.0%) | 54 (3.0%) |
| 55 to 64 Years | 1,793 (95.3%) | 89 (4.7%) |
| 65 to 74 Years | 1,651 (100.0%) | 0 (0.0%) |
| 75 Years and older | 1,405 (99.0%) | 14 (1.0%) |
| Total | 13,684 (94.3%) | 830 (5.7%) |
Health Insurance Coverage by Citizenship Status in Hutchinson
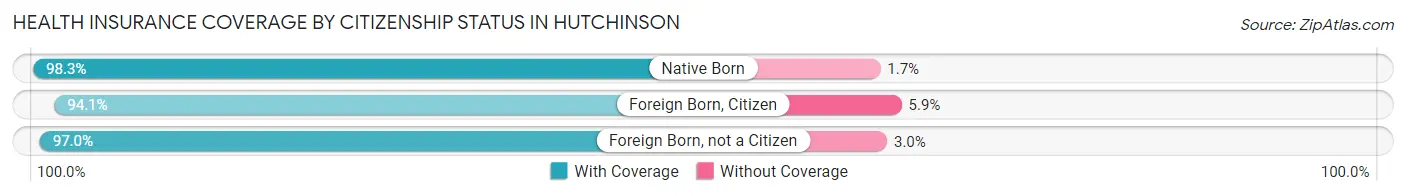
| Citizenship Status | With Coverage | Without Coverage |
| Native Born | 1,228 (98.3%) | 21 (1.7%) |
| Foreign Born, Citizen | 1,816 (94.1%) | 113 (5.9%) |
| Foreign Born, not a Citizen | 1,195 (97.0%) | 37 (3.0%) |
Health Insurance Coverage by Household Income in Hutchinson
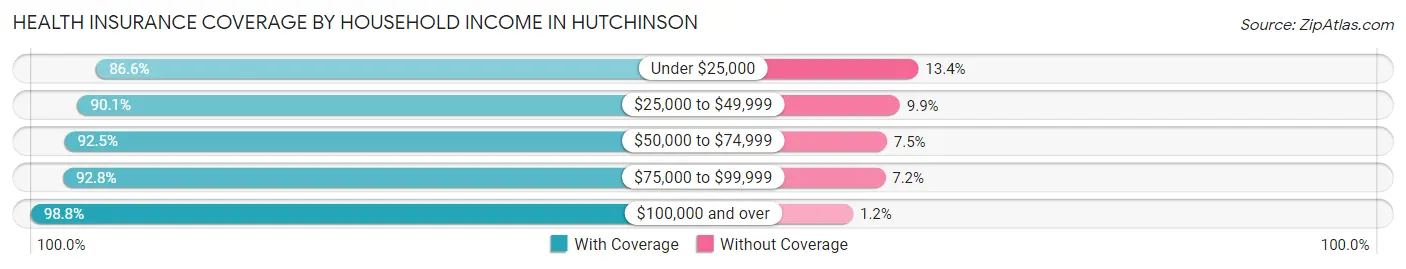
| Household Income | With Coverage | Without Coverage |
| Under $25,000 | 1,232 (86.6%) | 191 (13.4%) |
| $25,000 to $49,999 | 1,731 (90.1%) | 191 (9.9%) |
| $50,000 to $74,999 | 2,357 (92.5%) | 191 (7.5%) |
| $75,000 to $99,999 | 2,418 (92.8%) | 188 (7.2%) |
| $100,000 and over | 5,839 (98.8%) | 69 (1.2%) |
Public vs Private Health Insurance Coverage by Age in Hutchinson
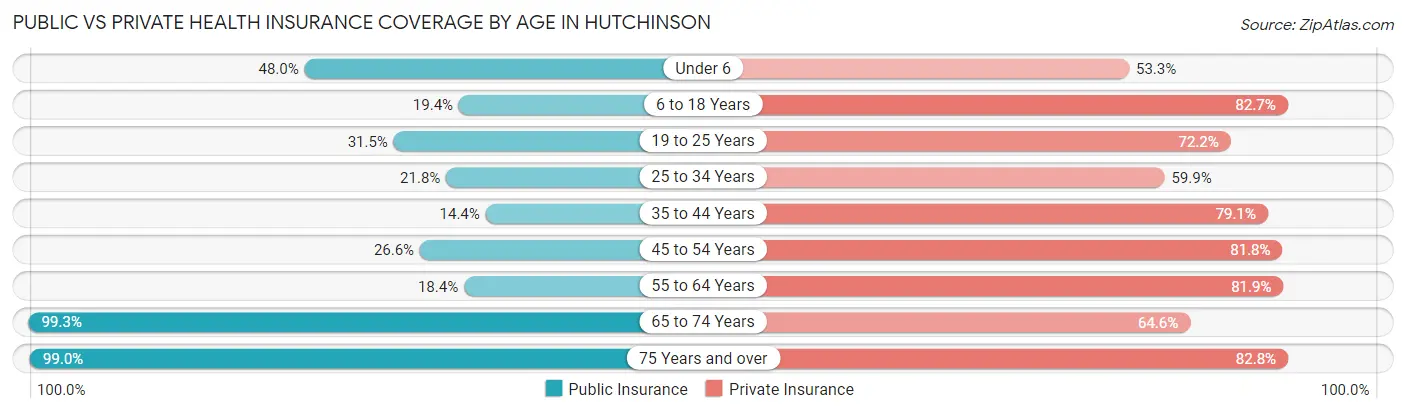
| Age Bracket | Public Insurance | Private Insurance |
| Under 6 | 600 (48.0%) | 666 (53.3%) |
| 6 to 18 Years | 374 (19.4%) | 1,596 (82.7%) |
| 19 to 25 Years | 388 (31.5%) | 889 (72.2%) |
| 25 to 34 Years | 377 (21.7%) | 1,038 (59.9%) |
| 35 to 44 Years | 237 (14.4%) | 1,298 (79.0%) |
| 45 to 54 Years | 473 (26.6%) | 1,453 (81.8%) |
| 55 to 64 Years | 347 (18.4%) | 1,542 (81.9%) |
| 65 to 74 Years | 1,639 (99.3%) | 1,067 (64.6%) |
| 75 Years and over | 1,405 (99.0%) | 1,175 (82.8%) |
| Total | 5,840 (40.2%) | 10,724 (73.9%) |
Disability Status by Sex by Age in Hutchinson
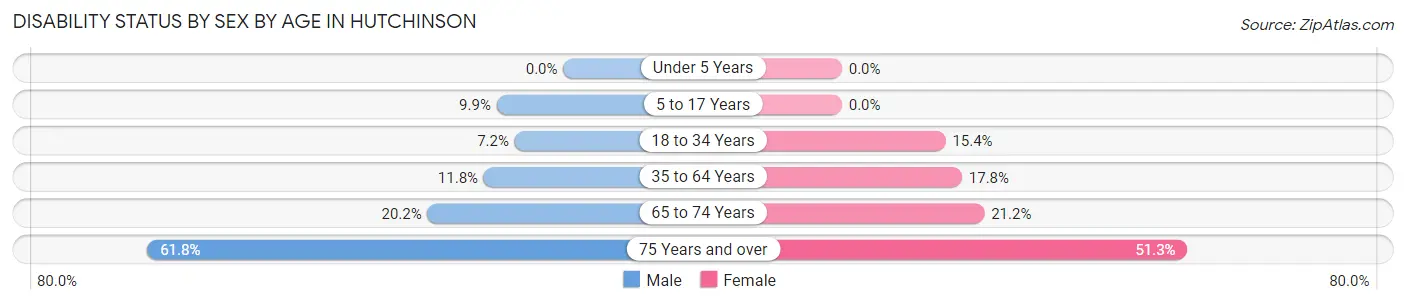
| Age Bracket | Male | Female |
| Under 5 Years | 0 (0.0%) | 0 (0.0%) |
| 5 to 17 Years | 113 (9.9%) | 0 (0.0%) |
| 18 to 34 Years | 113 (7.2%) | 242 (15.4%) |
| 35 to 64 Years | 312 (11.8%) | 474 (17.8%) |
| 65 to 74 Years | 147 (20.2%) | 195 (21.1%) |
| 75 Years and over | 317 (61.8%) | 465 (51.3%) |
Disability Class by Sex by Age in Hutchinson
Disability Class: Hearing Difficulty
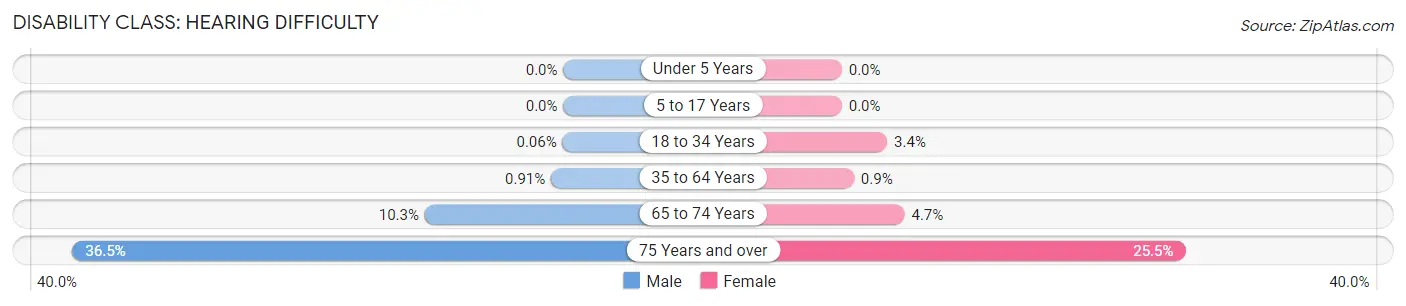
| Age Bracket | Male | Female |
| Under 5 Years | 0 (0.0%) | 0 (0.0%) |
| 5 to 17 Years | 0 (0.0%) | 0 (0.0%) |
| 18 to 34 Years | 1 (0.1%) | 53 (3.4%) |
| 35 to 64 Years | 24 (0.9%) | 24 (0.9%) |
| 65 to 74 Years | 75 (10.3%) | 43 (4.7%) |
| 75 Years and over | 187 (36.4%) | 231 (25.5%) |
Disability Class: Vision Difficulty
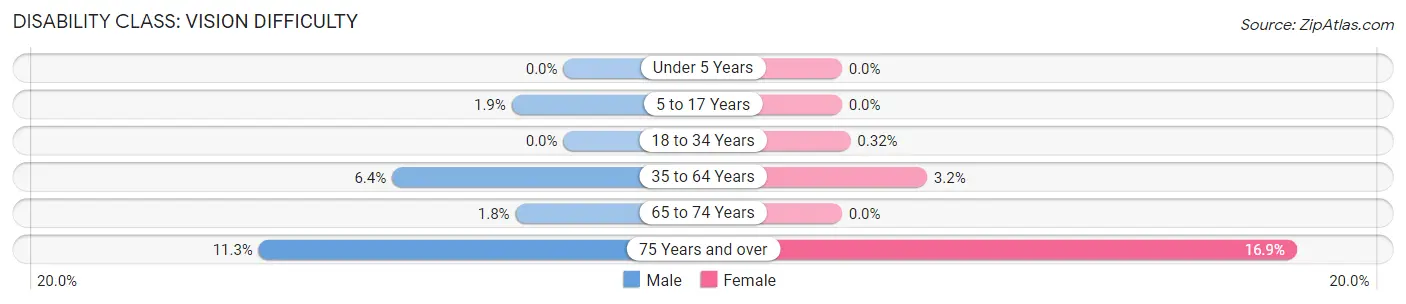
| Age Bracket | Male | Female |
| Under 5 Years | 0 (0.0%) | 0 (0.0%) |
| 5 to 17 Years | 22 (1.9%) | 0 (0.0%) |
| 18 to 34 Years | 0 (0.0%) | 5 (0.3%) |
| 35 to 64 Years | 168 (6.4%) | 84 (3.2%) |
| 65 to 74 Years | 13 (1.8%) | 0 (0.0%) |
| 75 Years and over | 58 (11.3%) | 153 (16.9%) |
Disability Class: Cognitive Difficulty
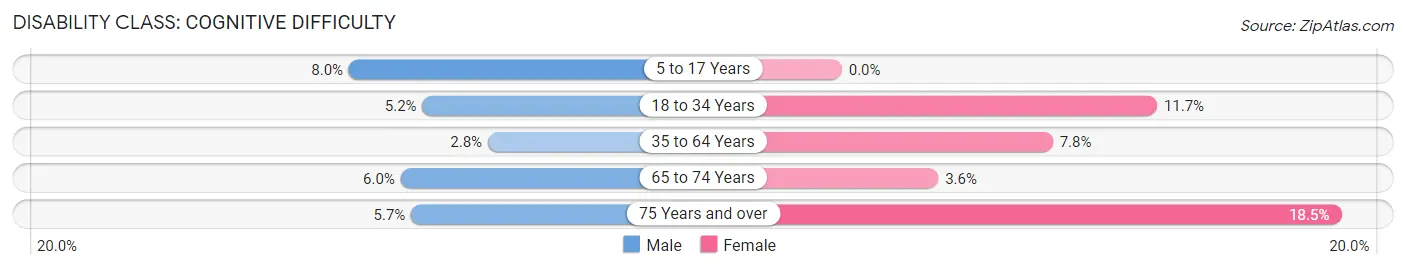
| Age Bracket | Male | Female |
| 5 to 17 Years | 91 (8.0%) | 0 (0.0%) |
| 18 to 34 Years | 82 (5.2%) | 184 (11.7%) |
| 35 to 64 Years | 74 (2.8%) | 208 (7.8%) |
| 65 to 74 Years | 44 (6.0%) | 33 (3.6%) |
| 75 Years and over | 29 (5.7%) | 168 (18.5%) |
Disability Class: Ambulatory Difficulty
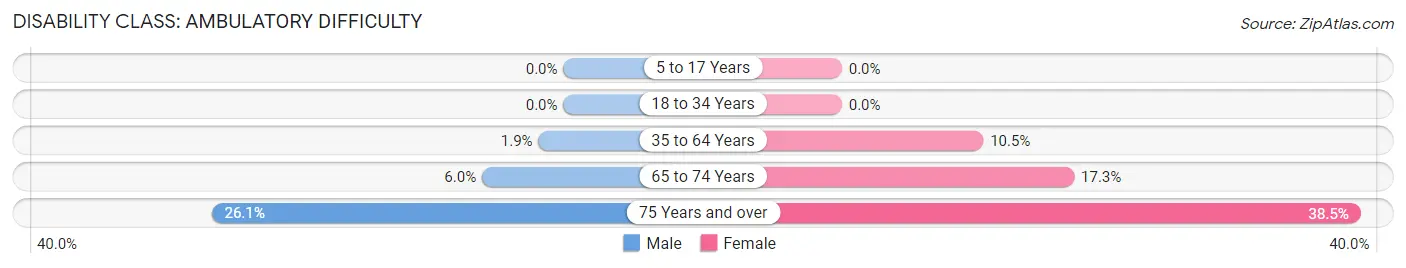
| Age Bracket | Male | Female |
| 5 to 17 Years | 0 (0.0%) | 0 (0.0%) |
| 18 to 34 Years | 0 (0.0%) | 0 (0.0%) |
| 35 to 64 Years | 49 (1.8%) | 279 (10.5%) |
| 65 to 74 Years | 44 (6.0%) | 159 (17.2%) |
| 75 Years and over | 134 (26.1%) | 349 (38.5%) |
Disability Class: Self-Care Difficulty
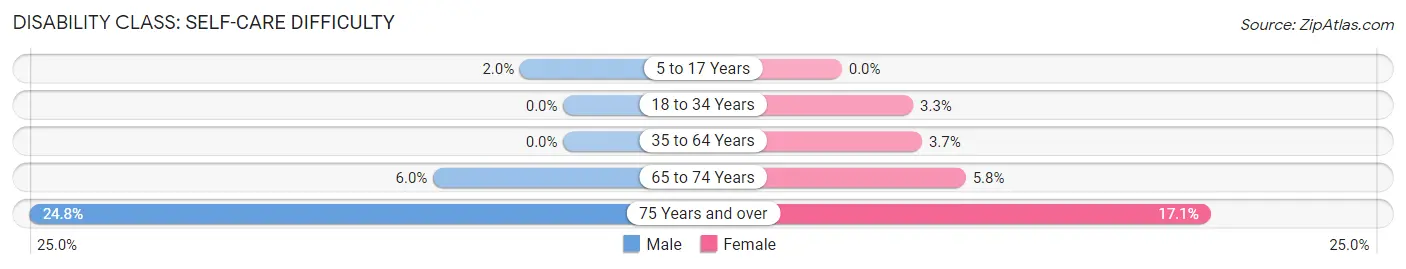
| Age Bracket | Male | Female |
| 5 to 17 Years | 23 (2.0%) | 0 (0.0%) |
| 18 to 34 Years | 0 (0.0%) | 52 (3.3%) |
| 35 to 64 Years | 0 (0.0%) | 99 (3.7%) |
| 65 to 74 Years | 44 (6.0%) | 53 (5.8%) |
| 75 Years and over | 127 (24.8%) | 155 (17.1%) |
Technology Access in Hutchinson
Computing Device Access in Hutchinson
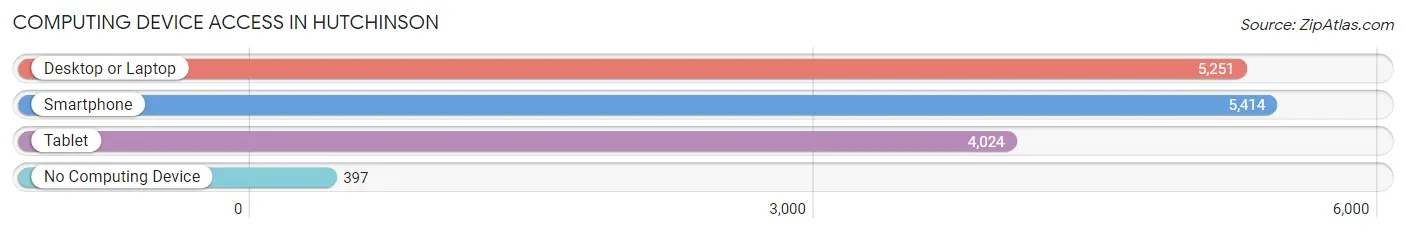
| Device Type | # Households | % Households |
| Desktop or Laptop | 5,251 | 82.5% |
| Smartphone | 5,414 | 85.0% |
| Tablet | 4,024 | 63.2% |
| No Computing Device | 397 | 6.2% |
| Total | 6,368 | 100.0% |
Internet Access in Hutchinson
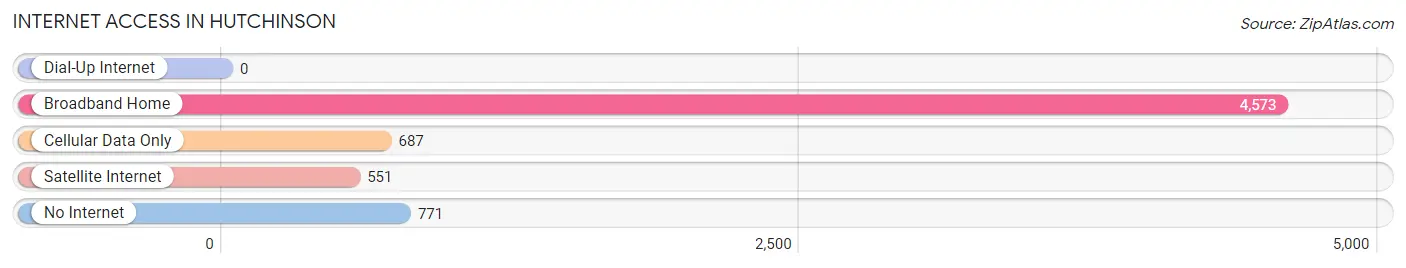
| Internet Type | # Households | % Households |
| Dial-Up Internet | 0 | 0.0% |
| Broadband Home | 4,573 | 71.8% |
| Cellular Data Only | 687 | 10.8% |
| Satellite Internet | 551 | 8.6% |
| No Internet | 771 | 12.1% |
| Total | 6,368 | 100.0% |
Hutchinson Summary
Hutchinson, Minnesota is a city located in McLeod County, in the south-central part of the state. It is situated on the banks of the Crow River, about 50 miles west of Minneapolis. The city has a population of 14,178, according to the 2010 census.
History
Hutchinson was founded in 1855 by settlers from New England. The city was named after a local settler, William Hutchinson. The city was incorporated in 1876 and has since grown to become the county seat of McLeod County.
Geography
Hutchinson is located in the south-central part of Minnesota, about 50 miles west of Minneapolis. The city is situated on the banks of the Crow River, which flows through the city. The city is surrounded by rolling hills and farmland, and is located in the Minnesota River Valley.
The city has a total area of 8.2 square miles, of which 8.1 square miles is land and 0.1 square miles is water. The city has a humid continental climate, with cold winters and hot summers.
Economy
Hutchinson is a major economic center in the region. The city is home to several large employers, including Hutchinson Technology, Inc., a manufacturer of disk drive components, and Hutchinson Health, a health care provider. The city also has a strong agricultural base, with several large farms located in the area.
The city also has a thriving retail sector, with several large shopping centers located in the city. The city also has a vibrant tourism industry, with several attractions, including the McLeod County Historical Museum, the Hutchinson Arts Center, and the Hutchinson Zoo.
Demographics
According to the 2010 census, the population of Hutchinson was 14,178. The city has a median age of 38.7 years, with a gender ratio of 49.7% male and 50.3% female. The city has a median household income of $50,945, and a poverty rate of 11.3%.
The city is predominantly white, with a population that is 94.2% white, 1.3% African American, 1.2% Asian, 0.7% Native American, and 2.6% other. The city also has a large Hispanic population, with a population that is 8.2% Hispanic or Latino.
Conclusion
Hutchinson, Minnesota is a city located in McLeod County, in the south-central part of the state. It is situated on the banks of the Crow River, about 50 miles west of Minneapolis. The city has a population of 14,178, according to the 2010 census. The city has a strong economy, with several large employers, a thriving retail sector, and a vibrant tourism industry. The city is predominantly white, with a population that is 94.2% white, 1.3% African American, 1.2% Asian, 0.7% Native American, and 2.6% other. The city also has a large Hispanic population, with a population that is 8.2% Hispanic or Latino.
Common Questions
What is Per Capita Income in Hutchinson?
Per Capita income in Hutchinson is $41,360.
What is the Median Family Income in Hutchinson?
Median Family Income in Hutchinson is $94,111.
What is the Median Household income in Hutchinson?
Median Household Income in Hutchinson is $64,635.
What is Income or Wage Gap in Hutchinson?
Income or Wage Gap in Hutchinson is 32.1%.
Women in Hutchinson earn 67.9 cents for every dollar earned by a man.
What is Family Income Deficit in Hutchinson?
Family Income Deficit in Hutchinson is $11,983.
Families that are below poverty line in Hutchinson earn $11,983 less on average than the poverty threshold level.
What is Inequality or Gini Index in Hutchinson?
Inequality or Gini Index in Hutchinson is 0.47.
What is the Total Population of Hutchinson?
Total Population of Hutchinson is 14,588.
What is the Total Male Population of Hutchinson?
Total Male Population of Hutchinson is 7,157.
What is the Total Female Population of Hutchinson?
Total Female Population of Hutchinson is 7,431.
What is the Ratio of Males per 100 Females in Hutchinson?
There are 96.31 Males per 100 Females in Hutchinson.
What is the Ratio of Females per 100 Males in Hutchinson?
There are 103.83 Females per 100 Males in Hutchinson.
What is the Median Population Age in Hutchinson?
Median Population Age in Hutchinson is 41.9 Years.
What is the Average Family Size in Hutchinson
Average Family Size in Hutchinson is 3.0 People.
What is the Average Household Size in Hutchinson
Average Household Size in Hutchinson is 2.3 People.
How Large is the Labor Force in Hutchinson?
There are 7,689 People in the Labor Forcein in Hutchinson.
What is the Percentage of People in the Labor Force in Hutchinson?
64.9% of People are in the Labor Force in Hutchinson.
What is the Unemployment Rate in Hutchinson?
Unemployment Rate in Hutchinson is 4.6%.