Cities with the Highest Percentage of Japanese Population in Minnesota
RELATED REPORTS & OPTIONS
Japanese
Minnesota
Compare Cities
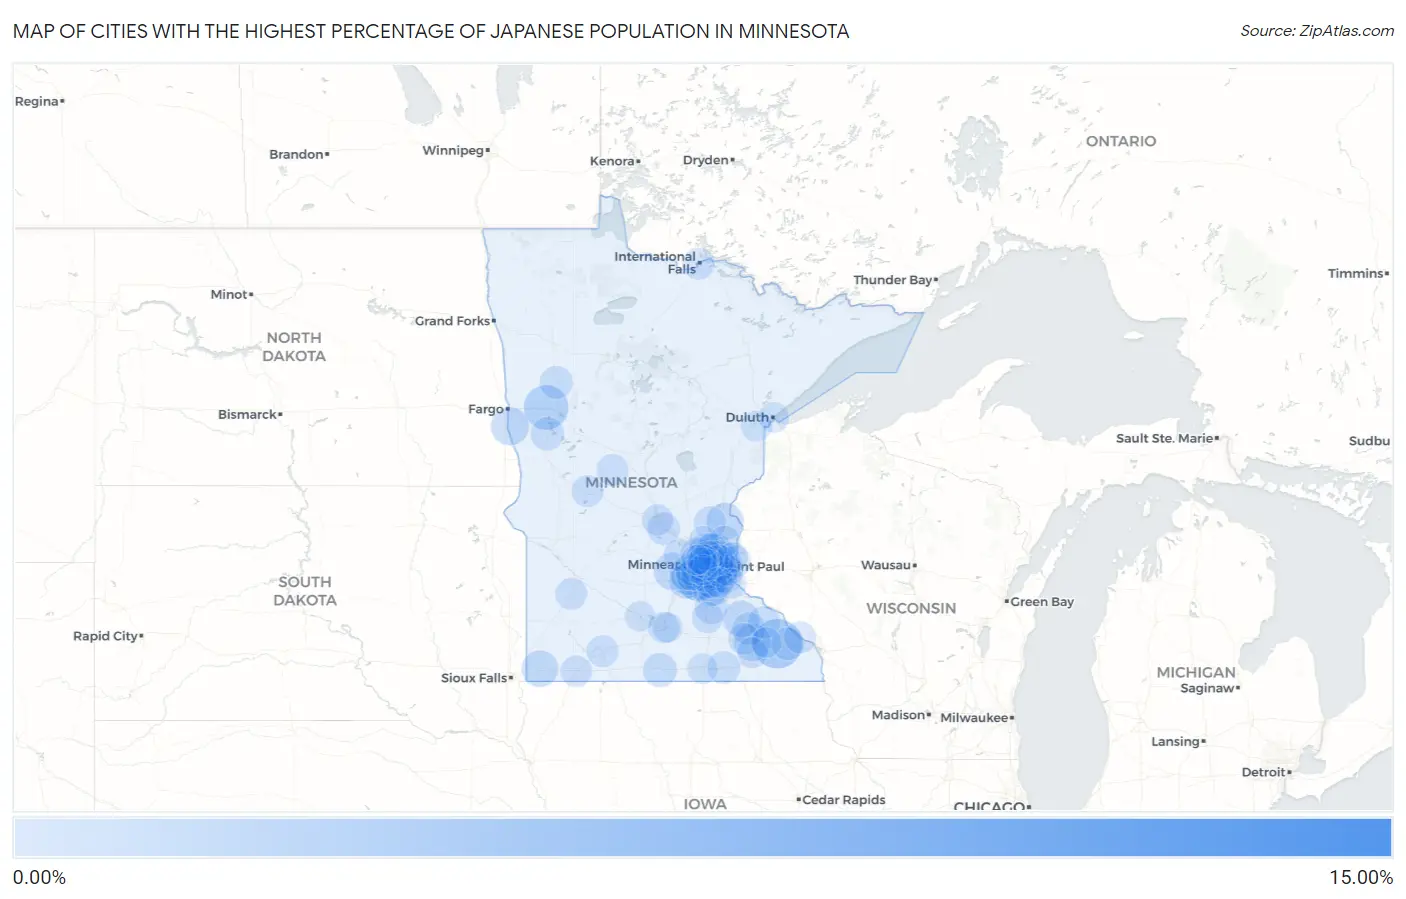
Map of Cities with the Highest Percentage of Japanese Population in Minnesota
0.00%
15.00%
Cities with the Highest Percentage of Japanese Population in Minnesota
| City | Japanese | vs State | vs National | |
| 1. | Marion | 14.06% | 0.18%(+13.9)#1 | 0.11%(+14.0)#11 |
| 2. | St Charles | 3.32% | 0.18%(+3.14)#2 | 0.11%(+3.21)#46 |
| 3. | Lake Park | 2.49% | 0.18%(+2.31)#3 | 0.11%(+2.39)#73 |
| 4. | Comstock | 1.33% | 0.18%(+1.16)#4 | 0.11%(+1.23)#170 |
| 5. | Shakopee | 1.30% | 0.18%(+1.12)#5 | 0.11%(+1.19)#178 |
| 6. | Mayer | 1.26% | 0.18%(+1.08)#6 | 0.11%(+1.15)#186 |
| 7. | Savage | 1.21% | 0.18%(+1.03)#7 | 0.11%(+1.10)#196 |
| 8. | North Branch | 1.20% | 0.18%(+1.03)#8 | 0.11%(+1.10)#198 |
| 9. | Rochester | 1.18% | 0.18%(+1.00)#9 | 0.11%(+1.07)#202 |
| 10. | Zumbrota | 1.09% | 0.18%(+0.908)#10 | 0.11%(+0.979)#219 |
| 11. | Luverne | 1.08% | 0.18%(+0.902)#11 | 0.11%(+0.973)#223 |
| 12. | Circle Pines | 1.02% | 0.18%(+0.843)#12 | 0.11%(+0.915)#240 |
| 13. | Burnsville | 1.00% | 0.18%(+0.825)#13 | 0.11%(+0.896)#246 |
| 14. | Eagan | 0.89% | 0.18%(+0.712)#14 | 0.11%(+0.783)#283 |
| 15. | Prior Lake | 0.88% | 0.18%(+0.703)#15 | 0.11%(+0.774)#285 |
| 16. | Chaska | 0.83% | 0.18%(+0.655)#16 | 0.11%(+0.726)#305 |
| 17. | Carver | 0.81% | 0.18%(+0.636)#17 | 0.11%(+0.707)#310 |
| 18. | Lakeville | 0.78% | 0.18%(+0.606)#18 | 0.11%(+0.677)#323 |
| 19. | Blue Earth | 0.69% | 0.18%(+0.514)#19 | 0.11%(+0.585)#370 |
| 20. | Landfall | 0.67% | 0.18%(+0.491)#20 | 0.11%(+0.562)#381 |
| 21. | Inver Grove Heights | 0.67% | 0.18%(+0.490)#21 | 0.11%(+0.561)#383 |
| 22. | Pelican Rapids | 0.54% | 0.18%(+0.363)#22 | 0.11%(+0.434)#454 |
| 23. | Dundas | 0.52% | 0.18%(+0.347)#23 | 0.11%(+0.418)#471 |
| 24. | Waubun | 0.51% | 0.18%(+0.329)#24 | 0.11%(+0.400)#482 |
| 25. | Oakdale | 0.49% | 0.18%(+0.308)#25 | 0.11%(+0.379)#497 |
| 26. | Victoria | 0.48% | 0.18%(+0.300)#26 | 0.11%(+0.371)#503 |
| 27. | Oronoco | 0.47% | 0.18%(+0.294)#27 | 0.11%(+0.365)#506 |
| 28. | Austin | 0.47% | 0.18%(+0.293)#28 | 0.11%(+0.364)#510 |
| 29. | Lewiston | 0.45% | 0.18%(+0.275)#29 | 0.11%(+0.346)#526 |
| 30. | Vadnais Heights | 0.44% | 0.18%(+0.266)#30 | 0.11%(+0.337)#529 |
| 31. | Mounds View | 0.40% | 0.18%(+0.227)#31 | 0.11%(+0.298)#579 |
| 32. | Greenwood | 0.40% | 0.18%(+0.227)#32 | 0.11%(+0.298)#581 |
| 33. | Clearwater | 0.40% | 0.18%(+0.226)#33 | 0.11%(+0.297)#582 |
| 34. | Millville | 0.39% | 0.18%(+0.212)#34 | 0.11%(+0.283)#600 |
| 35. | Eden Prairie | 0.36% | 0.18%(+0.183)#35 | 0.11%(+0.254)#644 |
| 36. | Brooklyn Park | 0.35% | 0.18%(+0.175)#36 | 0.11%(+0.246)#656 |
| 37. | Isanti | 0.35% | 0.18%(+0.173)#37 | 0.11%(+0.244)#660 |
| 38. | Rockford | 0.34% | 0.18%(+0.168)#38 | 0.11%(+0.239)#664 |
| 39. | Richfield | 0.33% | 0.18%(+0.149)#39 | 0.11%(+0.220)#692 |
| 40. | West St Paul | 0.32% | 0.18%(+0.144)#40 | 0.11%(+0.216)#697 |
| 41. | Windom | 0.31% | 0.18%(+0.137)#41 | 0.11%(+0.208)#708 |
| 42. | Bloomington | 0.30% | 0.18%(+0.122)#42 | 0.11%(+0.193)#739 |
| 43. | Clarissa | 0.30% | 0.18%(+0.119)#43 | 0.11%(+0.190)#748 |
| 44. | Winona | 0.30% | 0.18%(+0.118)#44 | 0.11%(+0.189)#752 |
| 45. | White Bear Lake | 0.29% | 0.18%(+0.111)#45 | 0.11%(+0.182)#761 |
| 46. | Alexandria | 0.28% | 0.18%(+0.107)#46 | 0.11%(+0.178)#771 |
| 47. | Crystal | 0.28% | 0.18%(+0.101)#47 | 0.11%(+0.173)#780 |
| 48. | Cottage Grove | 0.27% | 0.18%(+0.095)#48 | 0.11%(+0.166)#797 |
| 49. | Farmington | 0.26% | 0.18%(+0.087)#49 | 0.11%(+0.158)#817 |
| 50. | Maple Grove | 0.26% | 0.18%(+0.084)#50 | 0.11%(+0.155)#827 |
| 51. | Cottonwood | 0.26% | 0.18%(+0.084)#51 | 0.11%(+0.155)#828 |
| 52. | International Falls | 0.26% | 0.18%(+0.081)#52 | 0.11%(+0.153)#834 |
| 53. | South St Paul | 0.25% | 0.18%(+0.070)#53 | 0.11%(+0.141)#852 |
| 54. | St Paul | 0.23% | 0.18%(+0.056)#54 | 0.11%(+0.128)#885 |
| 55. | Worthington | 0.23% | 0.18%(+0.054)#55 | 0.11%(+0.125)#893 |
| 56. | Bayport | 0.23% | 0.18%(+0.053)#56 | 0.11%(+0.124)#894 |
| 57. | Byron | 0.22% | 0.18%(+0.042)#57 | 0.11%(+0.113)#924 |
| 58. | Maplewood | 0.21% | 0.18%(+0.028)#58 | 0.11%(+0.099)#958 |
| 59. | Apple Valley | 0.20% | 0.18%(+0.022)#59 | 0.11%(+0.093)#970 |
| 60. | St Cloud | 0.20% | 0.18%(+0.020)#60 | 0.11%(+0.091)#973 |
| 61. | Faribault | 0.19% | 0.18%(+0.015)#61 | 0.11%(+0.086)#984 |
| 62. | Woodbury | 0.19% | 0.18%(+0.008)#62 | 0.11%(+0.079)#996 |
| 63. | North Mankato | 0.18% | 0.18%(+0.005)#63 | 0.11%(+0.076)#1,003 |
| 64. | Coon Rapids | 0.17% | 0.18%(-0.005)#64 | 0.11%(+0.066)#1,028 |
| 65. | St Louis Park | 0.15% | 0.18%(-0.028)#65 | 0.11%(+0.043)#1,101 |
| 66. | Stewartville | 0.13% | 0.18%(-0.043)#66 | 0.11%(+0.028)#1,144 |
| 67. | Forest Lake | 0.13% | 0.18%(-0.046)#67 | 0.11%(+0.025)#1,156 |
| 68. | Minnetonka | 0.12% | 0.18%(-0.054)#68 | 0.11%(+0.017)#1,196 |
| 69. | Arden Hills | 0.11% | 0.18%(-0.065)#69 | 0.11%(+0.006)#1,244 |
| 70. | Roseville | 0.11% | 0.18%(-0.072)#70 | 0.11%(-0.001)#1,279 |
| 71. | Carlton | 0.10% | 0.18%(-0.073)#71 | 0.11%(-0.002)#1,285 |
| 72. | Blaine | 0.10% | 0.18%(-0.075)#72 | 0.11%(-0.004)#1,296 |
| 73. | Chanhassen | 0.097% | 0.18%(-0.081)#73 | 0.11%(-0.010)#1,318 |
| 74. | Little Canada | 0.094% | 0.18%(-0.083)#74 | 0.11%(-0.012)#1,332 |
| 75. | Minneapolis | 0.068% | 0.18%(-0.110)#75 | 0.11%(-0.039)#1,470 |
| 76. | Albert Lea | 0.060% | 0.18%(-0.118)#76 | 0.11%(-0.047)#1,519 |
| 77. | New Hope | 0.056% | 0.18%(-0.122)#77 | 0.11%(-0.051)#1,545 |
| 78. | Stillwater | 0.052% | 0.18%(-0.126)#78 | 0.11%(-0.055)#1,568 |
| 79. | Eyota | 0.048% | 0.18%(-0.130)#79 | 0.11%(-0.058)#1,589 |
| 80. | New Ulm | 0.043% | 0.18%(-0.135)#80 | 0.11%(-0.064)#1,618 |
| 81. | Fridley | 0.037% | 0.18%(-0.140)#81 | 0.11%(-0.069)#1,673 |
| 82. | Robbinsdale | 0.035% | 0.18%(-0.143)#82 | 0.11%(-0.072)#1,687 |
| 83. | Andover | 0.028% | 0.18%(-0.150)#83 | 0.11%(-0.079)#1,742 |
| 84. | Edina | 0.025% | 0.18%(-0.153)#84 | 0.11%(-0.082)#1,770 |
| 85. | Golden Valley | 0.023% | 0.18%(-0.155)#85 | 0.11%(-0.084)#1,787 |
| 86. | Plymouth | 0.023% | 0.18%(-0.155)#86 | 0.11%(-0.084)#1,788 |
| 87. | Hastings | 0.018% | 0.18%(-0.159)#87 | 0.11%(-0.088)#1,824 |
| 88. | Mankato | 0.018% | 0.18%(-0.159)#88 | 0.11%(-0.088)#1,825 |
| 89. | Rosemount | 0.015% | 0.18%(-0.162)#89 | 0.11%(-0.091)#1,847 |
| 90. | Duluth | 0.010% | 0.18%(-0.167)#90 | 0.11%(-0.096)#1,885 |
Common Questions
What are the Top 10 Cities with the Highest Percentage of Japanese Population in Minnesota?
Top 10 Cities with the Highest Percentage of Japanese Population in Minnesota are:
#1
3.32%
#2
2.49%
#3
1.33%
#4
1.30%
#5
1.26%
#6
1.21%
#7
1.20%
#8
1.18%
#9
1.09%
#10
1.08%
What city has the Highest Percentage of Japanese Population in Minnesota?
St Charles has the Highest Percentage of Japanese Population in Minnesota with 3.32%.
What is the Percentage of Japanese Population in the State of Minnesota?
Percentage of Japanese Population in Minnesota is 0.18%.
What is the Percentage of Japanese Population in the United States?
Percentage of Japanese Population in the United States is 0.11%.