Pipestone, MN Map & Demographics
Pipestone Map
Pipestone Overview
$33,725
PER CAPITA INCOME
$77,828
AVG FAMILY INCOME
$65,144
AVG HOUSEHOLD INCOME
54.8%
WAGE / INCOME GAP [ % ]
45.2¢/ $1
WAGE / INCOME GAP [ $ ]
0.43
INEQUALITY / GINI INDEX
4,171
TOTAL POPULATION
1,965
MALE POPULATION
2,206
FEMALE POPULATION
89.08
MALES / 100 FEMALES
112.26
FEMALES / 100 MALES
39.2
MEDIAN AGE
3.0
AVG FAMILY SIZE
2.2
AVG HOUSEHOLD SIZE
1,939
LABOR FORCE [ PEOPLE ]
60.5%
PERCENT IN LABOR FORCE
4.0%
UNEMPLOYMENT RATE
Pipestone Zip Codes
Pipestone Area Codes
Income in Pipestone
Income Overview in Pipestone
Per Capita Income in Pipestone is $33,725, while median incomes of families and households are $77,828 and $65,144 respectively.
| Characteristic | Number | Measure |
| Per Capita Income | 4,171 | $33,725 |
| Median Family Income | 1,029 | $77,828 |
| Mean Family Income | 1,029 | $79,214 |
| Median Household Income | 1,817 | $65,144 |
| Mean Household Income | 1,817 | $77,016 |
| Income Deficit | 1,029 | $0 |
| Wage / Income Gap (%) | 4,171 | 54.83% |
| Wage / Income Gap ($) | 4,171 | 45.17¢ per $1 |
| Gini / Inequality Index | 4,171 | 0.43 |
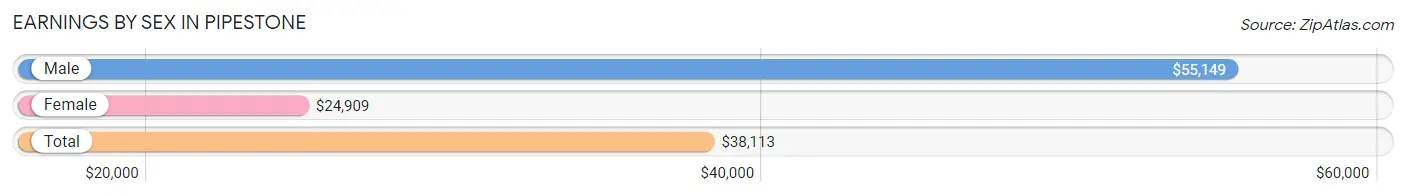
Earnings by Sex in Pipestone
Average Earnings in Pipestone are $38,113, $55,149 for men and $24,909 for women, a difference of 54.8%.
| Sex | Number | Average Earnings |
| Male | 1,028 (48.5%) | $55,149 |
| Female | 1,091 (51.5%) | $24,909 |
| Total | 2,119 (100.0%) | $38,113 |
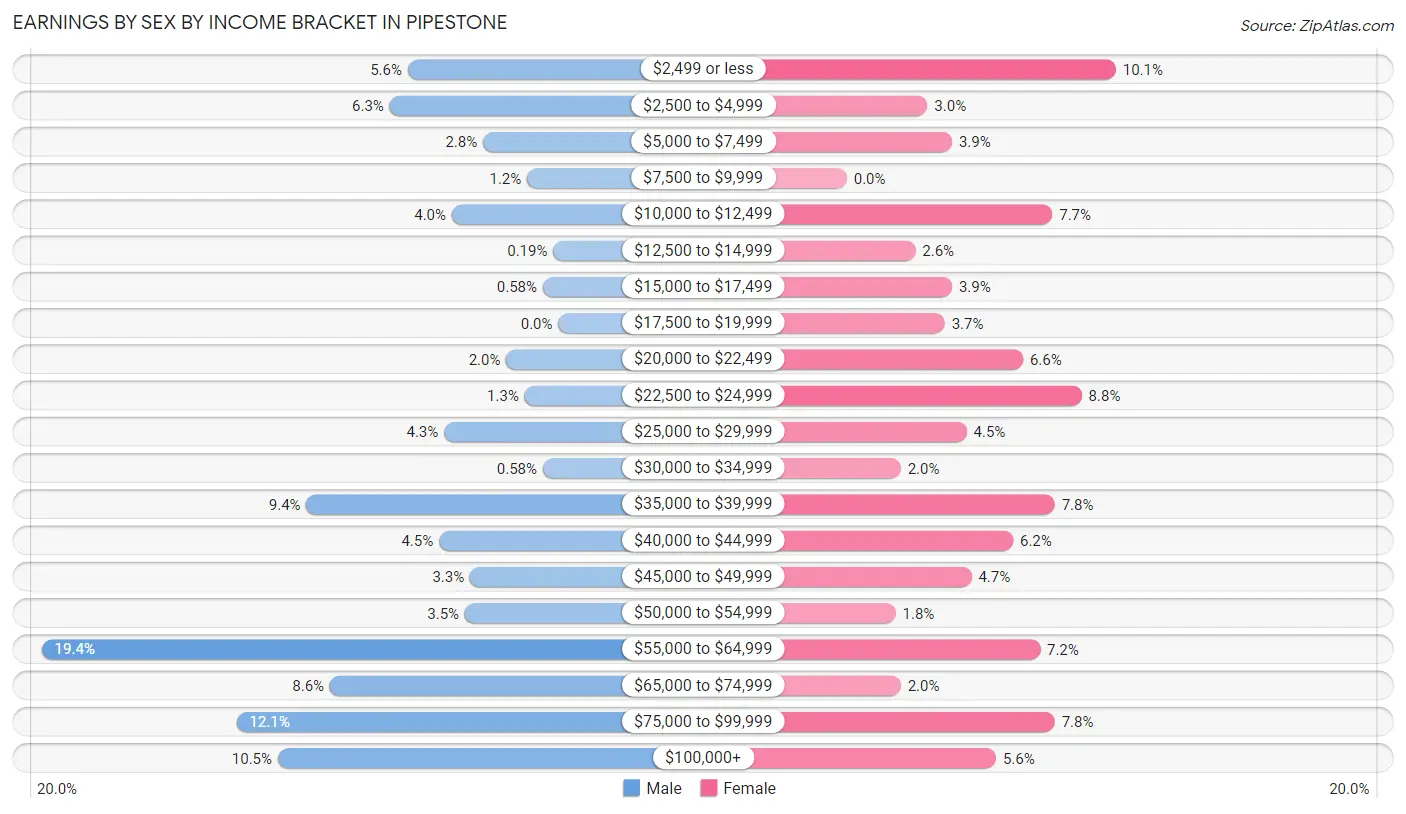
Earnings by Sex by Income Bracket in Pipestone
The most common earnings brackets in Pipestone are $55,000 to $64,999 for men (199 | 19.4%) and $2,499 or less for women (110 | 10.1%).
| Income | Male | Female |
| $2,499 or less | 58 (5.6%) | 110 (10.1%) |
| $2,500 to $4,999 | 65 (6.3%) | 33 (3.0%) |
| $5,000 to $7,499 | 29 (2.8%) | 43 (3.9%) |
| $7,500 to $9,999 | 12 (1.2%) | 0 (0.0%) |
| $10,000 to $12,499 | 41 (4.0%) | 84 (7.7%) |
| $12,500 to $14,999 | 2 (0.2%) | 28 (2.6%) |
| $15,000 to $17,499 | 6 (0.6%) | 43 (3.9%) |
| $17,500 to $19,999 | 0 (0.0%) | 40 (3.7%) |
| $20,000 to $22,499 | 20 (1.9%) | 72 (6.6%) |
| $22,500 to $24,999 | 13 (1.3%) | 96 (8.8%) |
| $25,000 to $29,999 | 44 (4.3%) | 49 (4.5%) |
| $30,000 to $34,999 | 6 (0.6%) | 22 (2.0%) |
| $35,000 to $39,999 | 97 (9.4%) | 85 (7.8%) |
| $40,000 to $44,999 | 46 (4.5%) | 68 (6.2%) |
| $45,000 to $49,999 | 34 (3.3%) | 51 (4.7%) |
| $50,000 to $54,999 | 36 (3.5%) | 20 (1.8%) |
| $55,000 to $64,999 | 199 (19.4%) | 79 (7.2%) |
| $65,000 to $74,999 | 88 (8.6%) | 22 (2.0%) |
| $75,000 to $99,999 | 124 (12.1%) | 85 (7.8%) |
| $100,000+ | 108 (10.5%) | 61 (5.6%) |
| Total | 1,028 (100.0%) | 1,091 (100.0%) |
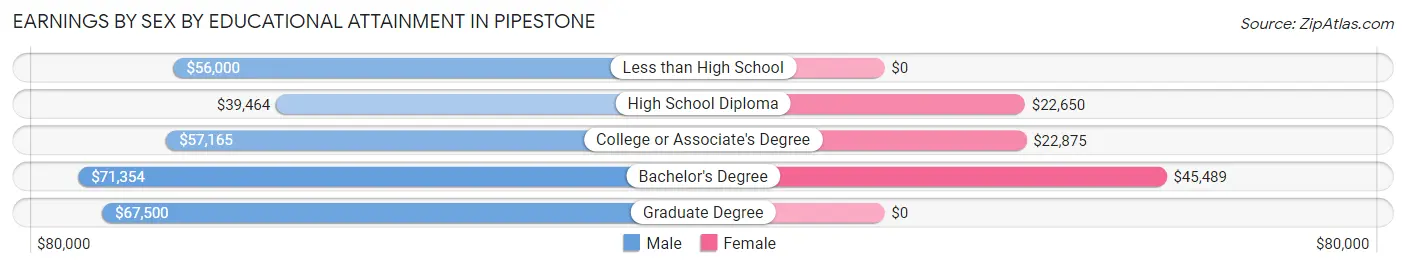
Earnings by Sex by Educational Attainment in Pipestone
Average earnings in Pipestone are $56,801 for men and $31,429 for women, a difference of 44.7%. Men with an educational attainment of bachelor's degree enjoy the highest average annual earnings of $71,354, while those with high school diploma education earn the least with $39,464. Women with an educational attainment of bachelor's degree earn the most with the average annual earnings of $45,489, while those with high school diploma education have the smallest earnings of $22,650.
| Educational Attainment | Male Income | Female Income |
| Less than High School | $56,000 | $0 |
| High School Diploma | $39,464 | $22,650 |
| College or Associate's Degree | $57,165 | $22,875 |
| Bachelor's Degree | $71,354 | $45,489 |
| Graduate Degree | $67,500 | $0 |
| Total | $56,801 | $31,429 |
Family Income in Pipestone
Family Income Brackets in Pipestone
According to the Pipestone family income data, there are 257 families falling into the $75,000 to $99,999 income range, which is the most common income bracket and makes up 25.0% of all families. Conversely, the $10,000 to $14,999 income bracket is the least frequent group with only 36 families (3.5%) belonging to this category.
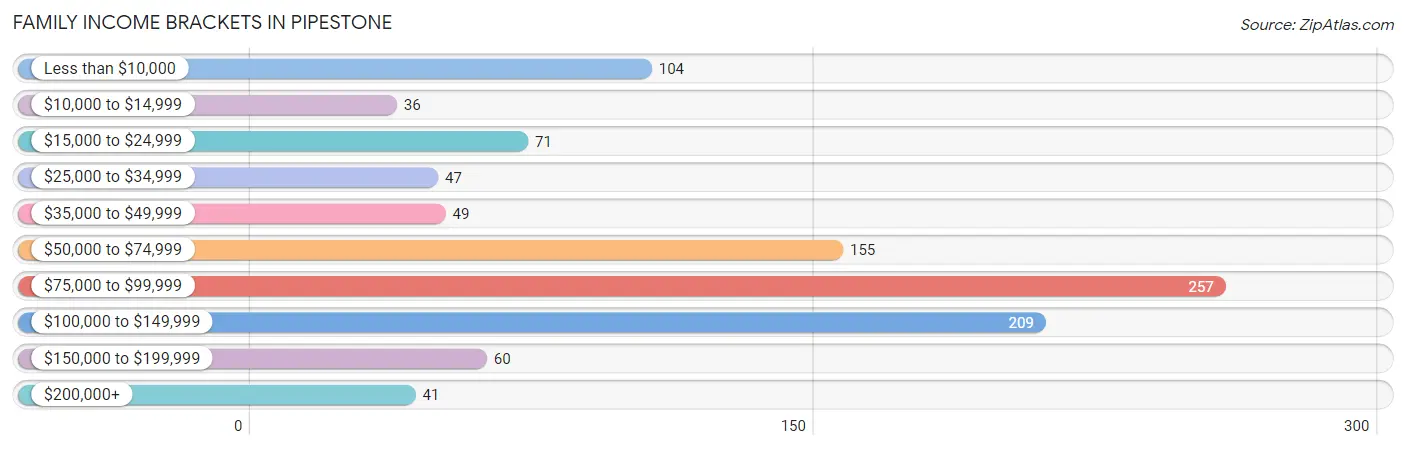
| Income Bracket | # Families | % Families |
| Less than $10,000 | 104 | 10.1% |
| $10,000 to $14,999 | 36 | 3.5% |
| $15,000 to $24,999 | 71 | 6.9% |
| $25,000 to $34,999 | 47 | 4.6% |
| $35,000 to $49,999 | 49 | 4.8% |
| $50,000 to $74,999 | 155 | 15.1% |
| $75,000 to $99,999 | 257 | 25.0% |
| $100,000 to $149,999 | 209 | 20.3% |
| $150,000 to $199,999 | 60 | 5.8% |
| $200,000+ | 41 | 4.0% |
Family Income by Famaliy Size in Pipestone
5-person families (84 | 8.2%) account for the highest median family income in Pipestone with $118,190 per family, while 2-person families (534 | 51.9%) have the highest median income of $34,375 per family member.
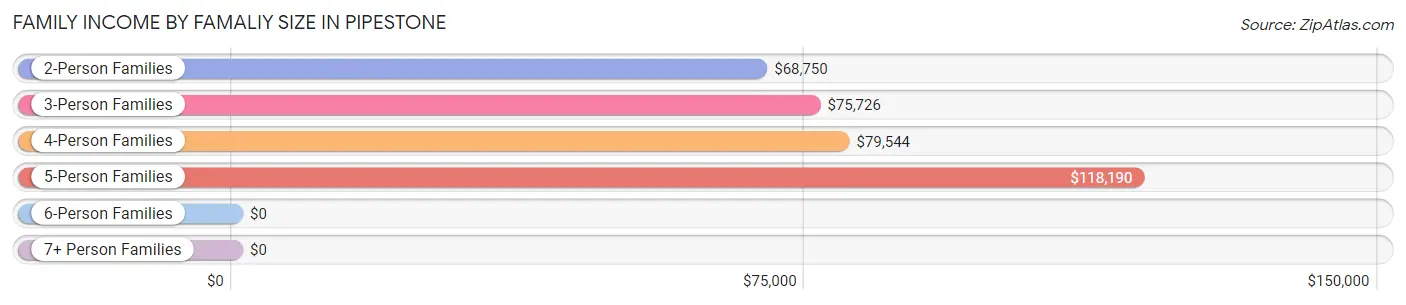
| Income Bracket | # Families | Median Income |
| 2-Person Families | 534 (51.9%) | $68,750 |
| 3-Person Families | 240 (23.3%) | $75,726 |
| 4-Person Families | 141 (13.7%) | $79,544 |
| 5-Person Families | 84 (8.2%) | $118,190 |
| 6-Person Families | 13 (1.3%) | $0 |
| 7+ Person Families | 17 (1.7%) | $0 |
| Total | 1,029 (100.0%) | $77,828 |
Family Income by Number of Earners in Pipestone
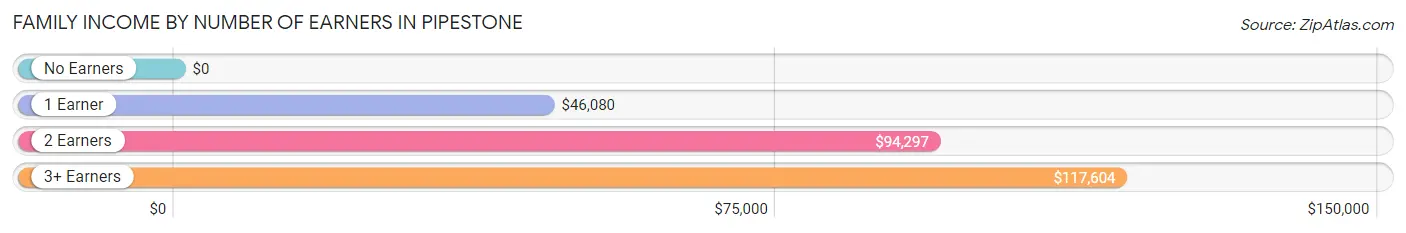
| Number of Earners | # Families | Median Income |
| No Earners | 135 (13.1%) | $0 |
| 1 Earner | 370 (36.0%) | $46,080 |
| 2 Earners | 445 (43.2%) | $94,297 |
| 3+ Earners | 79 (7.7%) | $117,604 |
| Total | 1,029 (100.0%) | $77,828 |
Household Income in Pipestone
Household Income Brackets in Pipestone
With 318 households falling in the category, the $100,000 to $149,999 income range is the most frequent in Pipestone, accounting for 17.5% of all households. In contrast, only 74 households (4.1%) fall into the $10,000 to $14,999 income bracket, making it the least populous group.
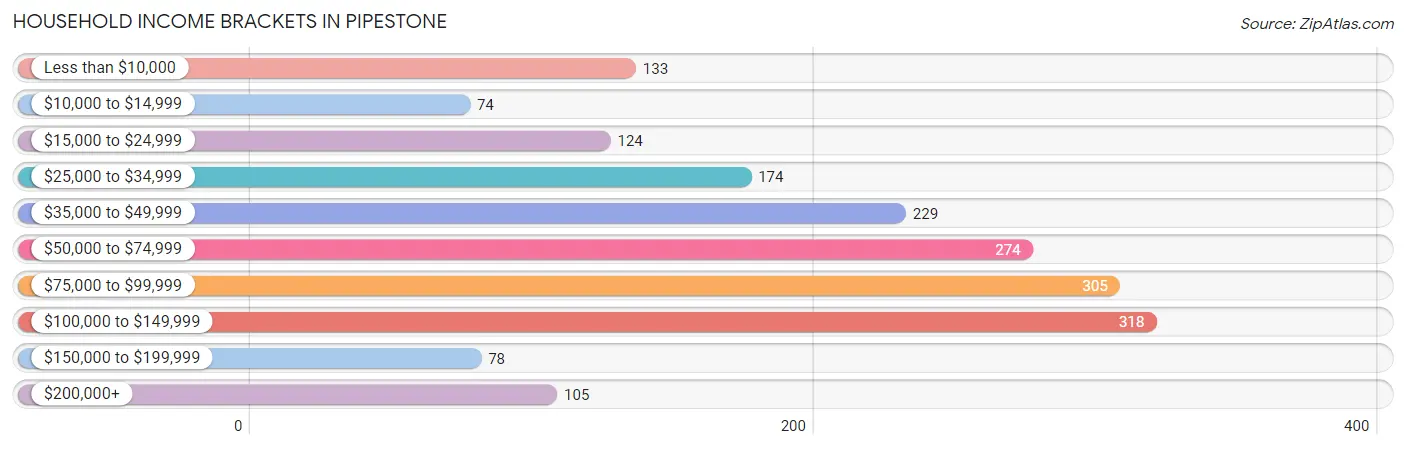
| Income Bracket | # Households | % Households |
| Less than $10,000 | 133 | 7.3% |
| $10,000 to $14,999 | 74 | 4.1% |
| $15,000 to $24,999 | 124 | 6.8% |
| $25,000 to $34,999 | 174 | 9.6% |
| $35,000 to $49,999 | 229 | 12.6% |
| $50,000 to $74,999 | 274 | 15.1% |
| $75,000 to $99,999 | 305 | 16.8% |
| $100,000 to $149,999 | 318 | 17.5% |
| $150,000 to $199,999 | 78 | 4.3% |
| $200,000+ | 105 | 5.8% |
Household Income by Householder Age in Pipestone
The median household income in Pipestone is $65,144, with the highest median household income of $78,135 found in the 25 to 44 years age bracket for the primary householder. A total of 596 households (32.8%) fall into this category. Meanwhile, the 65+ years age bracket for the primary householder has the lowest median household income of $45,735, with 536 households (29.5%) in this group.
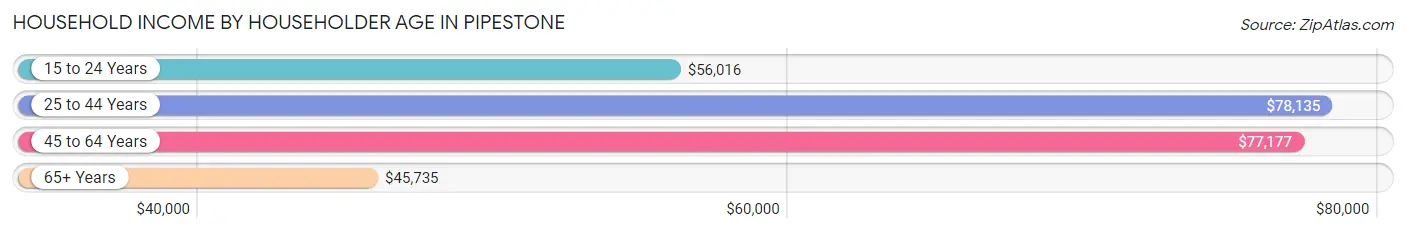
| Income Bracket | # Households | Median Income |
| 15 to 24 Years | 47 (2.6%) | $56,016 |
| 25 to 44 Years | 596 (32.8%) | $78,135 |
| 45 to 64 Years | 638 (35.1%) | $77,177 |
| 65+ Years | 536 (29.5%) | $45,735 |
| Total | 1,817 (100.0%) | $65,144 |
Poverty in Pipestone
Income Below Poverty by Sex and Age in Pipestone
With 15.4% poverty level for males and 23.4% for females among the residents of Pipestone, 12 to 14 year old males and under 5 year old females are the most vulnerable to poverty, with 59 males (47.6%) and 102 females (56.0%) in their respective age groups living below the poverty level.
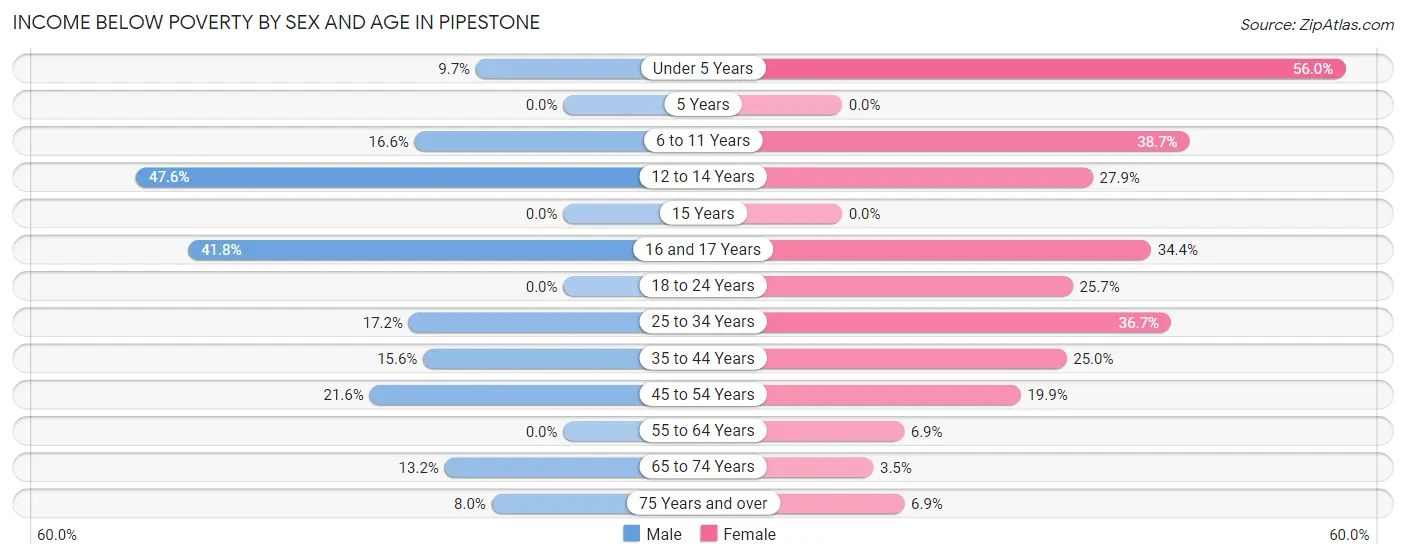
| Age Bracket | Male | Female |
| Under 5 Years | 15 (9.7%) | 102 (56.0%) |
| 5 Years | 0 (0.0%) | 0 (0.0%) |
| 6 to 11 Years | 27 (16.6%) | 72 (38.7%) |
| 12 to 14 Years | 59 (47.6%) | 19 (27.9%) |
| 15 Years | 0 (0.0%) | 0 (0.0%) |
| 16 and 17 Years | 33 (41.8%) | 32 (34.4%) |
| 18 to 24 Years | 0 (0.0%) | 37 (25.7%) |
| 25 to 34 Years | 42 (17.2%) | 81 (36.6%) |
| 35 to 44 Years | 32 (15.6%) | 74 (25.0%) |
| 45 to 54 Years | 52 (21.6%) | 39 (19.9%) |
| 55 to 64 Years | 0 (0.0%) | 18 (6.9%) |
| 65 to 74 Years | 23 (13.2%) | 7 (3.5%) |
| 75 Years and over | 13 (8.0%) | 17 (6.9%) |
| Total | 296 (15.4%) | 498 (23.4%) |
Income Above Poverty by Sex and Age in Pipestone
According to the poverty statistics in Pipestone, males aged 5 years and females aged 5 years are the age groups that are most secure financially, with 100.0% of males and 100.0% of females in these age groups living above the poverty line.
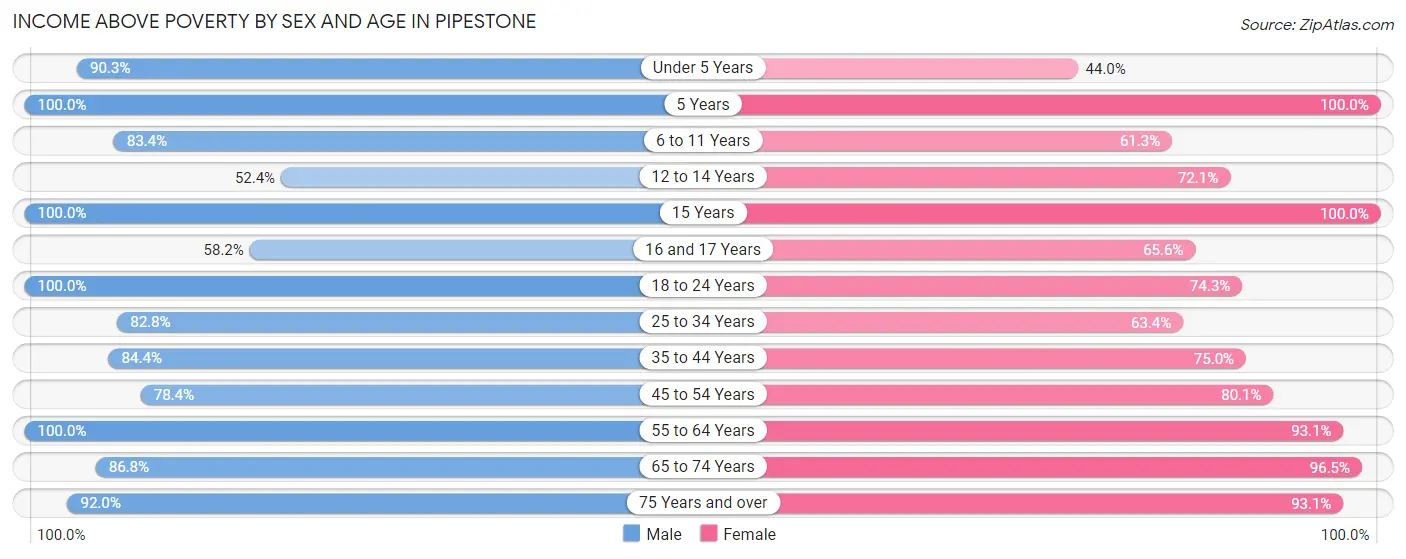
| Age Bracket | Male | Female |
| Under 5 Years | 139 (90.3%) | 80 (44.0%) |
| 5 Years | 40 (100.0%) | 22 (100.0%) |
| 6 to 11 Years | 136 (83.4%) | 114 (61.3%) |
| 12 to 14 Years | 65 (52.4%) | 49 (72.1%) |
| 15 Years | 9 (100.0%) | 17 (100.0%) |
| 16 and 17 Years | 46 (58.2%) | 61 (65.6%) |
| 18 to 24 Years | 97 (100.0%) | 107 (74.3%) |
| 25 to 34 Years | 202 (82.8%) | 140 (63.3%) |
| 35 to 44 Years | 173 (84.4%) | 222 (75.0%) |
| 45 to 54 Years | 189 (78.4%) | 157 (80.1%) |
| 55 to 64 Years | 226 (100.0%) | 243 (93.1%) |
| 65 to 74 Years | 151 (86.8%) | 194 (96.5%) |
| 75 Years and over | 150 (92.0%) | 228 (93.1%) |
| Total | 1,623 (84.6%) | 1,634 (76.6%) |
Income Below Poverty Among Married-Couple Families in Pipestone
The poverty statistics for married-couple families in Pipestone show that 3.8% or 29 of the total 761 families live below the poverty line. Families with 5 or more children have the highest poverty rate of 47.1%, comprising of 8 families. On the other hand, families with no children have the lowest poverty rate of 0.0%, which includes 0 families.
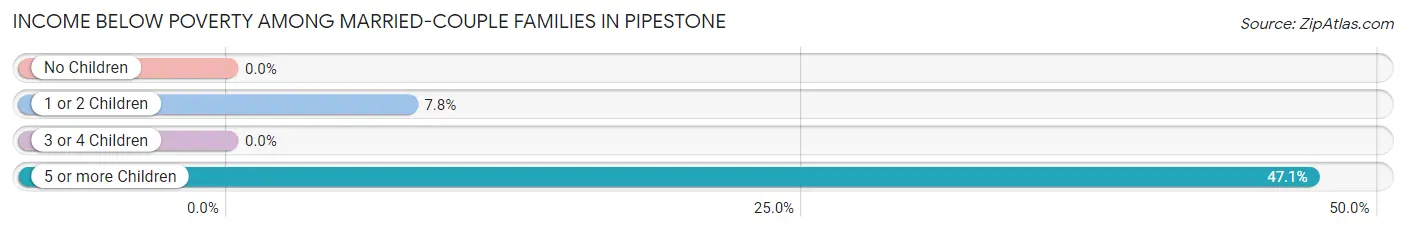
| Children | Above Poverty | Below Poverty |
| No Children | 441 (100.0%) | 0 (0.0%) |
| 1 or 2 Children | 248 (92.2%) | 21 (7.8%) |
| 3 or 4 Children | 34 (100.0%) | 0 (0.0%) |
| 5 or more Children | 9 (52.9%) | 8 (47.1%) |
| Total | 732 (96.2%) | 29 (3.8%) |
Income Below Poverty Among Single-Parent Households in Pipestone
According to the poverty data in Pipestone, 64.9% or 72 single-father households and 64.3% or 101 single-mother households are living below the poverty line. Among single-father households, those with no children have the highest poverty rate, with 40 households (87.0%) experiencing poverty. Likewise, among single-mother households, those with 1 or 2 children have the highest poverty rate, with 86 households (86.9%) falling below the poverty line.
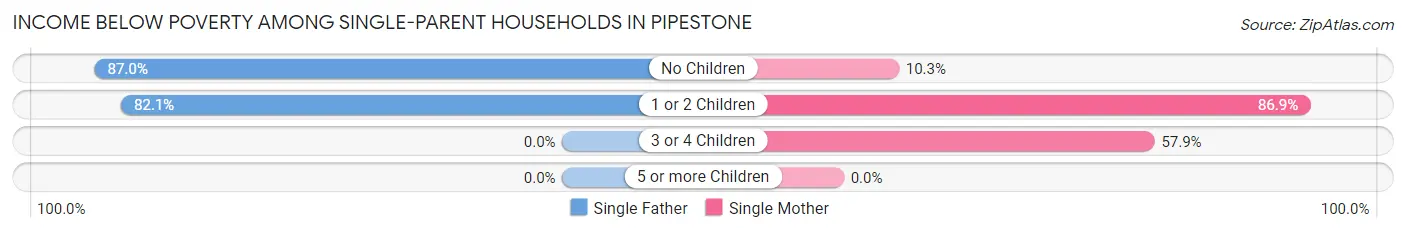
| Children | Single Father | Single Mother |
| No Children | 40 (87.0%) | 4 (10.3%) |
| 1 or 2 Children | 32 (82.1%) | 86 (86.9%) |
| 3 or 4 Children | 0 (0.0%) | 11 (57.9%) |
| 5 or more Children | 0 (0.0%) | 0 (0.0%) |
| Total | 72 (64.9%) | 101 (64.3%) |
Income Below Poverty Among Married-Couple vs Single-Parent Households in Pipestone
The poverty data for Pipestone shows that 29 of the married-couple family households (3.8%) and 173 of the single-parent households (64.5%) are living below the poverty level. Within the married-couple family households, those with 5 or more children have the highest poverty rate, with 8 households (47.1%) falling below the poverty line. Among the single-parent households, those with 1 or 2 children have the highest poverty rate, with 118 household (85.5%) living below poverty.
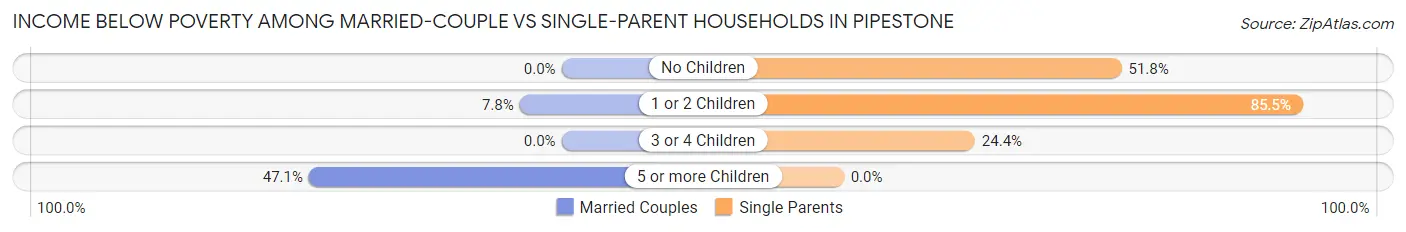
| Children | Married-Couple Families | Single-Parent Households |
| No Children | 0 (0.0%) | 44 (51.8%) |
| 1 or 2 Children | 21 (7.8%) | 118 (85.5%) |
| 3 or 4 Children | 0 (0.0%) | 11 (24.4%) |
| 5 or more Children | 8 (47.1%) | 0 (0.0%) |
| Total | 29 (3.8%) | 173 (64.5%) |
Race in Pipestone
The most populous races in Pipestone are White / Caucasian (3,524 | 84.5%), Hispanic or Latino (373 | 8.9%), and Two or more Races (319 | 7.6%).
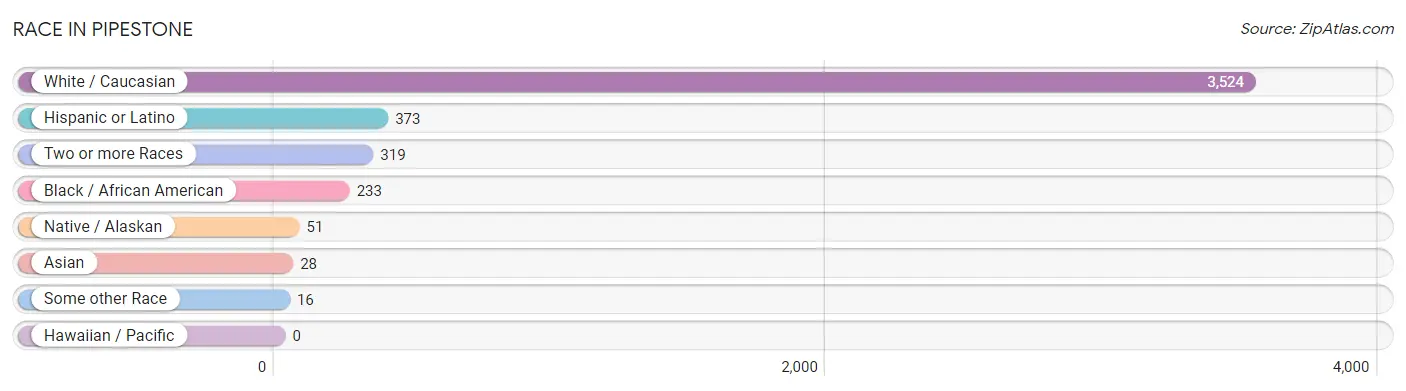
| Race | # Population | % Population |
| Asian | 28 | 0.7% |
| Black / African American | 233 | 5.6% |
| Hawaiian / Pacific | 0 | 0.0% |
| Hispanic or Latino | 373 | 8.9% |
| Native / Alaskan | 51 | 1.2% |
| White / Caucasian | 3,524 | 84.5% |
| Two or more Races | 319 | 7.6% |
| Some other Race | 16 | 0.4% |
| Total | 4,171 | 100.0% |
Ancestry in Pipestone
The most populous ancestries reported in Pipestone are German (1,501 | 36.0%), Norwegian (508 | 12.2%), Dutch (433 | 10.4%), Mexican (234 | 5.6%), and Irish (206 | 4.9%), together accounting for 69.1% of all Pipestone residents.
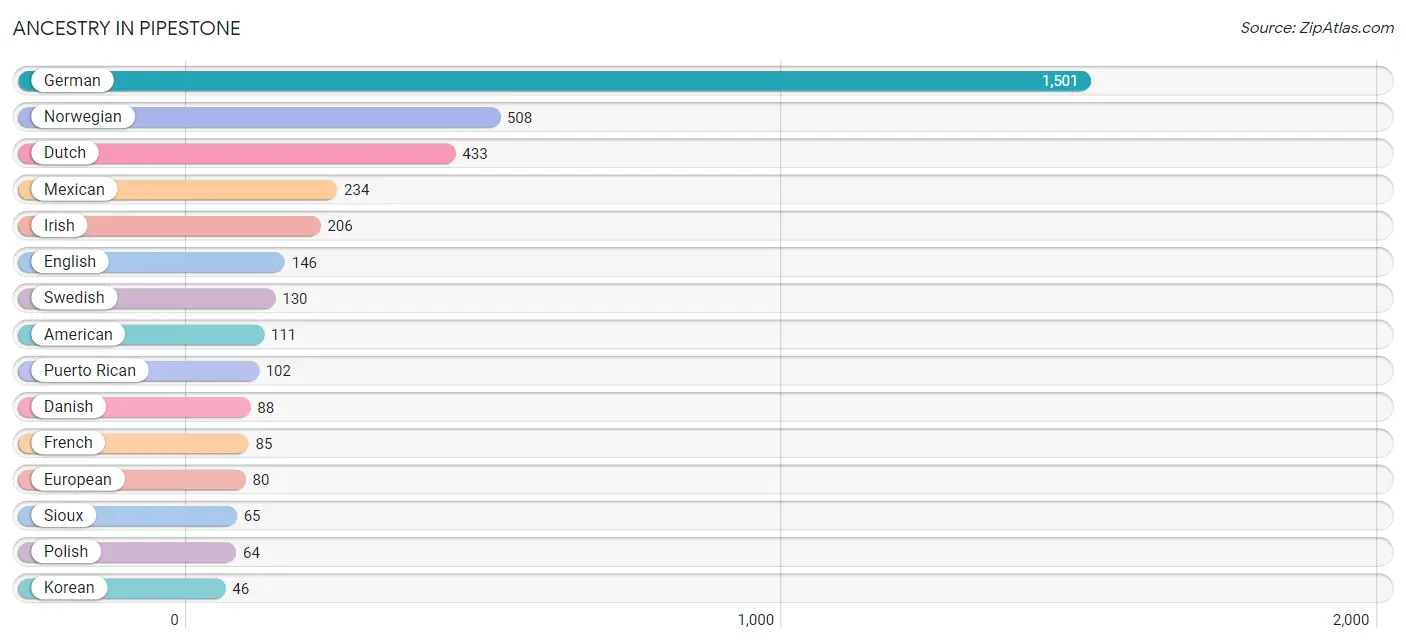
| Ancestry | # Population | % Population |
| American | 111 | 2.7% |
| Belgian | 14 | 0.3% |
| British | 26 | 0.6% |
| Central American | 32 | 0.8% |
| Cherokee | 27 | 0.6% |
| Chippewa | 4 | 0.1% |
| Creek | 1 | 0.0% |
| Czech | 23 | 0.5% |
| Danish | 88 | 2.1% |
| Dutch | 433 | 10.4% |
| English | 146 | 3.5% |
| European | 80 | 1.9% |
| Finnish | 4 | 0.1% |
| French | 85 | 2.0% |
| French Canadian | 19 | 0.5% |
| German | 1,501 | 36.0% |
| Inupiat | 3 | 0.1% |
| Irish | 206 | 4.9% |
| Italian | 30 | 0.7% |
| Korean | 46 | 1.1% |
| Lithuanian | 1 | 0.0% |
| Mexican | 234 | 5.6% |
| Nicaraguan | 32 | 0.8% |
| Norwegian | 508 | 12.2% |
| Polish | 64 | 1.5% |
| Puerto Rican | 102 | 2.5% |
| Russian | 5 | 0.1% |
| Scandinavian | 24 | 0.6% |
| Scotch-Irish | 16 | 0.4% |
| Scottish | 43 | 1.0% |
| Sioux | 65 | 1.6% |
| Swedish | 130 | 3.1% |
| Ukrainian | 1 | 0.0% | View All 33 Rows |
Immigrants in Pipestone
The most numerous immigrant groups reported in Pipestone came from Latin America (120 | 2.9%), Central America (119 | 2.9%), Mexico (93 | 2.2%), Asia (28 | 0.7%), and Philippines (28 | 0.7%), together accounting for 9.3% of all Pipestone residents.
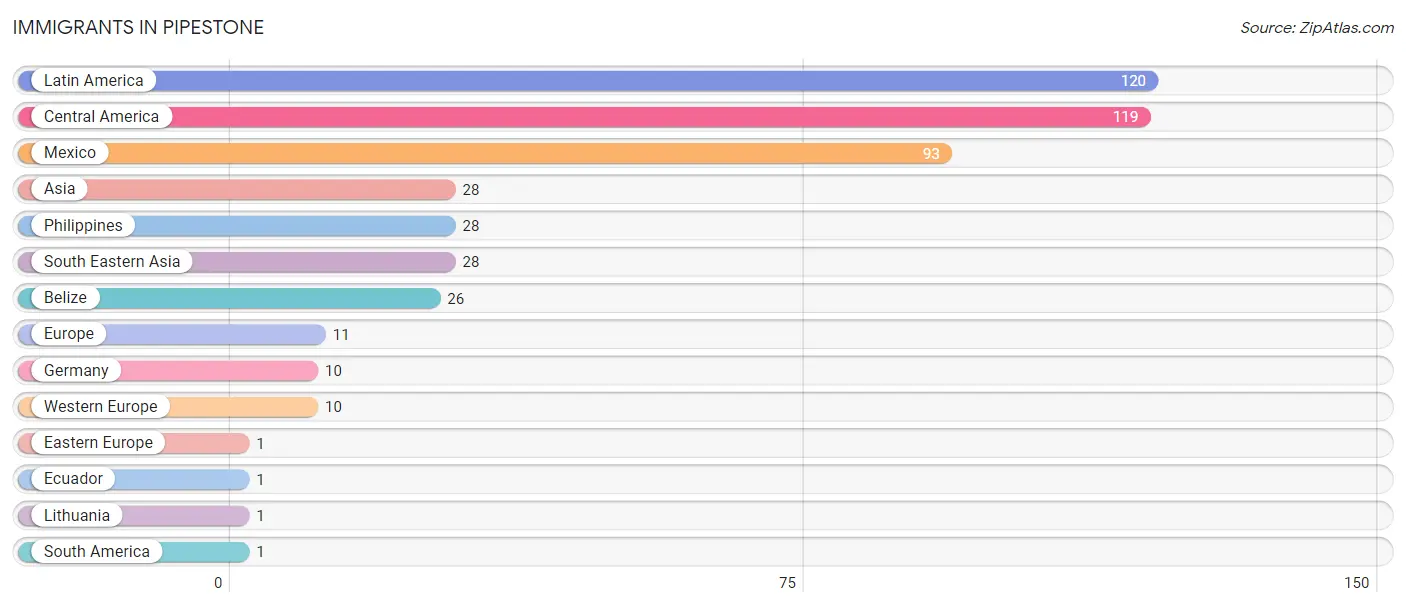
| Immigration Origin | # Population | % Population |
| Asia | 28 | 0.7% |
| Belize | 26 | 0.6% |
| Central America | 119 | 2.9% |
| Eastern Europe | 1 | 0.0% |
| Ecuador | 1 | 0.0% |
| Europe | 11 | 0.3% |
| Germany | 10 | 0.2% |
| Latin America | 120 | 2.9% |
| Lithuania | 1 | 0.0% |
| Mexico | 93 | 2.2% |
| Philippines | 28 | 0.7% |
| South America | 1 | 0.0% |
| South Eastern Asia | 28 | 0.7% |
| Western Europe | 10 | 0.2% | View All 14 Rows |
Sex and Age in Pipestone
Sex and Age in Pipestone
The most populous age groups in Pipestone are 10 to 14 Years (199 | 10.1%) for men and Under 5 Years (182 | 8.3%) for women.
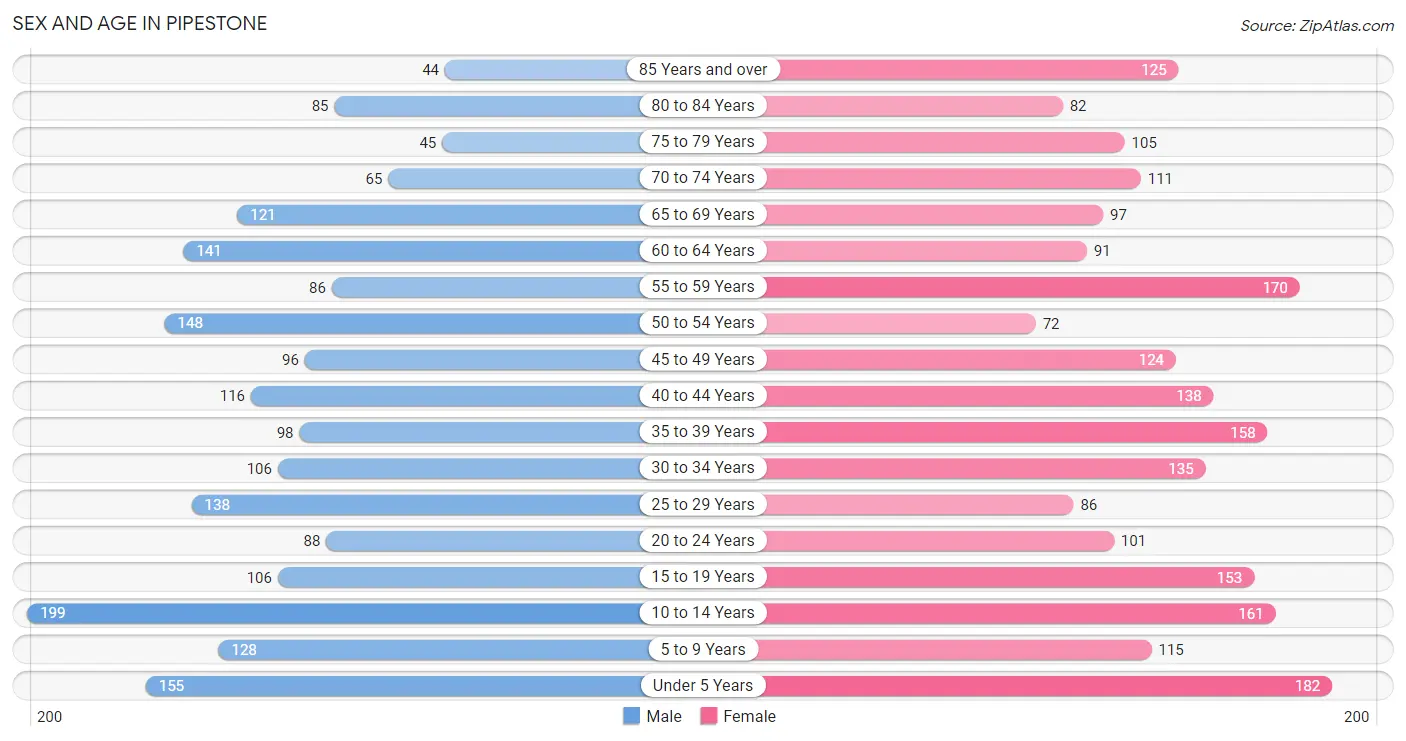
| Age Bracket | Male | Female |
| Under 5 Years | 155 (7.9%) | 182 (8.3%) |
| 5 to 9 Years | 128 (6.5%) | 115 (5.2%) |
| 10 to 14 Years | 199 (10.1%) | 161 (7.3%) |
| 15 to 19 Years | 106 (5.4%) | 153 (6.9%) |
| 20 to 24 Years | 88 (4.5%) | 101 (4.6%) |
| 25 to 29 Years | 138 (7.0%) | 86 (3.9%) |
| 30 to 34 Years | 106 (5.4%) | 135 (6.1%) |
| 35 to 39 Years | 98 (5.0%) | 158 (7.2%) |
| 40 to 44 Years | 116 (5.9%) | 138 (6.3%) |
| 45 to 49 Years | 96 (4.9%) | 124 (5.6%) |
| 50 to 54 Years | 148 (7.5%) | 72 (3.3%) |
| 55 to 59 Years | 86 (4.4%) | 170 (7.7%) |
| 60 to 64 Years | 141 (7.2%) | 91 (4.1%) |
| 65 to 69 Years | 121 (6.2%) | 97 (4.4%) |
| 70 to 74 Years | 65 (3.3%) | 111 (5.0%) |
| 75 to 79 Years | 45 (2.3%) | 105 (4.8%) |
| 80 to 84 Years | 85 (4.3%) | 82 (3.7%) |
| 85 Years and over | 44 (2.2%) | 125 (5.7%) |
| Total | 1,965 (100.0%) | 2,206 (100.0%) |
Families and Households in Pipestone
Median Family Size in Pipestone
The median family size in Pipestone is 3.03 persons per family, with single male/father families (111 | 10.8%) accounting for the largest median family size of 3.17 persons per family. On the other hand, single female/mother families (157 | 15.3%) represent the smallest median family size with 2.68 persons per family.
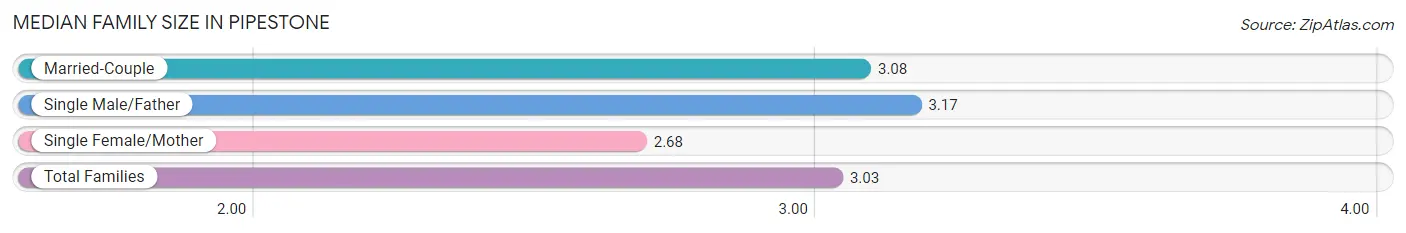
| Family Type | # Families | Family Size |
| Married-Couple | 761 (74.0%) | 3.08 |
| Single Male/Father | 111 (10.8%) | 3.17 |
| Single Female/Mother | 157 (15.3%) | 2.68 |
| Total Families | 1,029 (100.0%) | 3.03 |
Median Household Size in Pipestone
The median household size in Pipestone is 2.22 persons per household, with single male/father households (111 | 6.1%) accounting for the largest median household size of 3.78 persons per household. non-family households (788 | 43.4%) represent the smallest median household size with 1.06 persons per household.
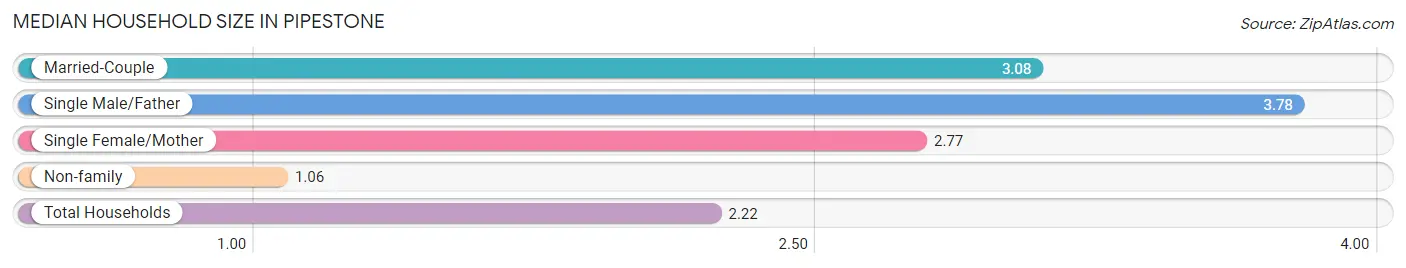
| Household Type | # Households | Household Size |
| Married-Couple | 761 (41.9%) | 3.08 |
| Single Male/Father | 111 (6.1%) | 3.78 |
| Single Female/Mother | 157 (8.6%) | 2.77 |
| Non-family | 788 (43.4%) | 1.06 |
| Total Households | 1,817 (100.0%) | 2.22 |
Household Size by Marriage Status in Pipestone
Out of a total of 1,817 households in Pipestone, 1,029 (56.6%) are family households, while 788 (43.4%) are nonfamily households. The most numerous type of family households are 2-person households, comprising 509, and the most common type of nonfamily households are 1-person households, comprising 749.
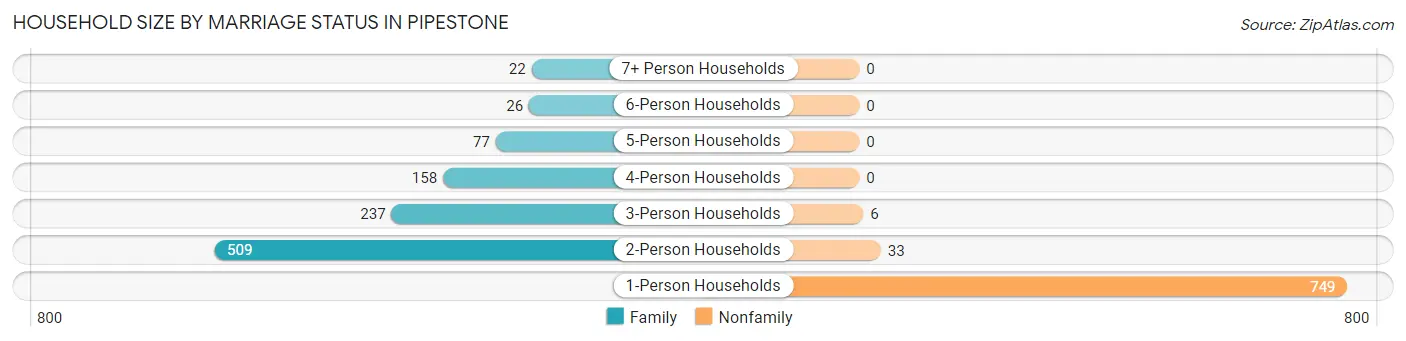
| Household Size | Family Households | Nonfamily Households |
| 1-Person Households | - | 749 (41.2%) |
| 2-Person Households | 509 (28.0%) | 33 (1.8%) |
| 3-Person Households | 237 (13.0%) | 6 (0.3%) |
| 4-Person Households | 158 (8.7%) | 0 (0.0%) |
| 5-Person Households | 77 (4.2%) | 0 (0.0%) |
| 6-Person Households | 26 (1.4%) | 0 (0.0%) |
| 7+ Person Households | 22 (1.2%) | 0 (0.0%) |
| Total | 1,029 (56.6%) | 788 (43.4%) |
Female Fertility in Pipestone
Fertility by Age in Pipestone
Average fertility rate in Pipestone is 31.0 births per 1,000 women. Women in the age bracket of 20 to 34 years have the highest fertility rate with 87.0 births per 1,000 women. Women in the age bracket of 20 to 34 years acount for 100.0% of all women with births.
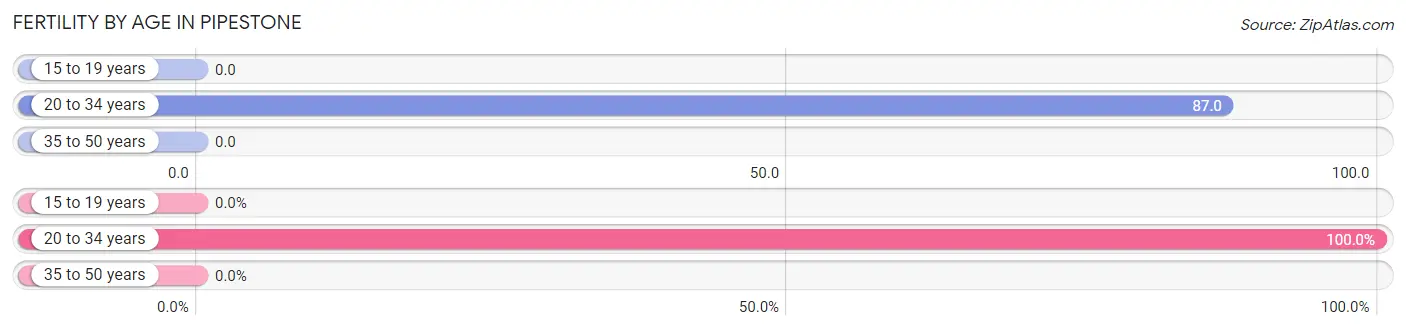
| Age Bracket | Women with Births | Births / 1,000 Women |
| 15 to 19 years | 0 (0.0%) | 0.0 |
| 20 to 34 years | 28 (100.0%) | 87.0 |
| 35 to 50 years | 0 (0.0%) | 0.0 |
| Total | 28 (100.0%) | 31.0 |
Fertility by Age by Marriage Status in Pipestone
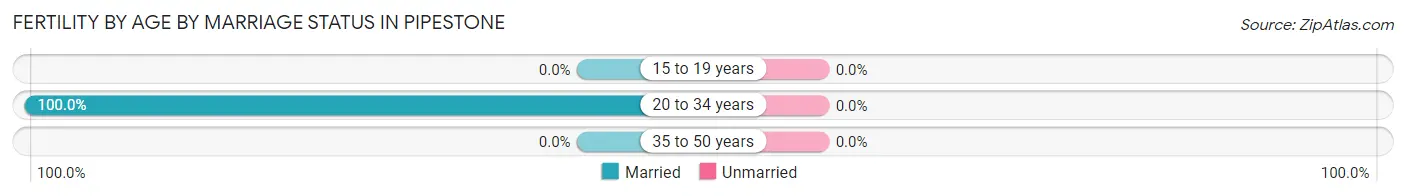
| Age Bracket | Married | Unmarried |
| 15 to 19 years | 0 (0.0%) | 0 (0.0%) |
| 20 to 34 years | 28 (100.0%) | 0 (0.0%) |
| 35 to 50 years | 0 (0.0%) | 0 (0.0%) |
| Total | 28 (100.0%) | 0 (0.0%) |
Fertility by Education in Pipestone
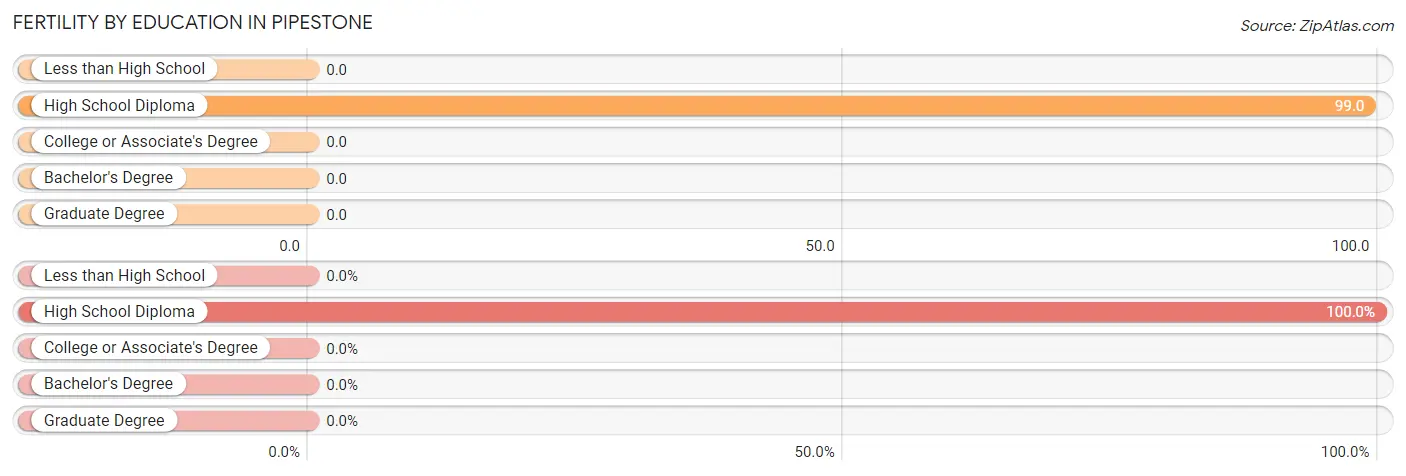
| Educational Attainment | Women with Births | Births / 1,000 Women |
| Less than High School | 0 (0.0%) | 0.0 |
| High School Diploma | 28 (100.0%) | 99.0 |
| College or Associate's Degree | 0 (0.0%) | 0.0 |
| Bachelor's Degree | 0 (0.0%) | 0.0 |
| Graduate Degree | 0 (0.0%) | 0.0 |
| Total | 28 (100.0%) | 31.0 |
Fertility by Education by Marriage Status in Pipestone
| Educational Attainment | Married | Unmarried |
| Less than High School | 0 (0.0%) | 0 (0.0%) |
| High School Diploma | 28 (100.0%) | 0 (0.0%) |
| College or Associate's Degree | 0 (0.0%) | 0 (0.0%) |
| Bachelor's Degree | 0 (0.0%) | 0 (0.0%) |
| Graduate Degree | 0 (0.0%) | 0 (0.0%) |
| Total | 28 (100.0%) | 0 (0.0%) |
Employment Characteristics in Pipestone
Employment by Class of Employer in Pipestone
Among the 1,820 employed individuals in Pipestone, private company employees (1,114 | 61.2%), not-for-profit organizations (226 | 12.4%), and local government employees (217 | 11.9%) make up the most common classes of employment.
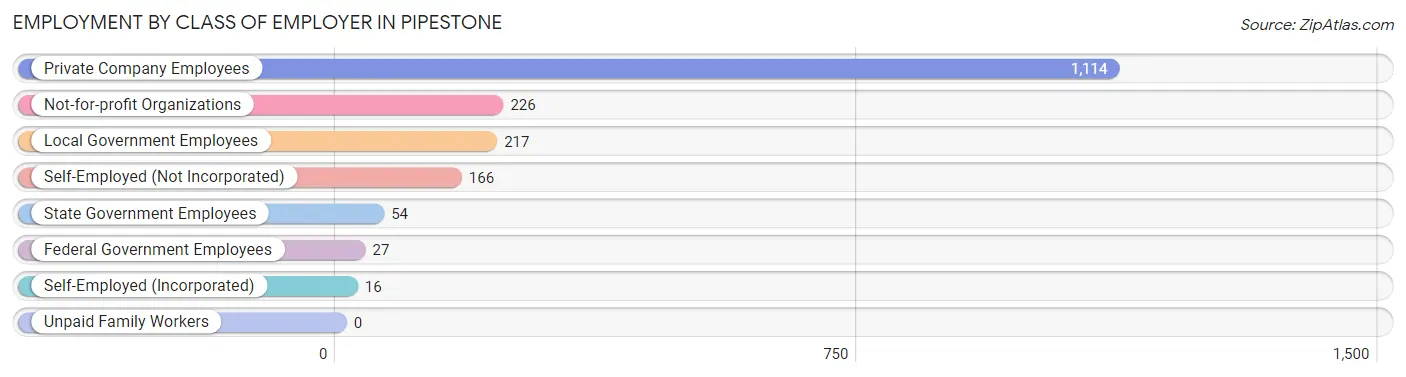
| Employer Class | # Employees | % Employees |
| Private Company Employees | 1,114 | 61.2% |
| Self-Employed (Incorporated) | 16 | 0.9% |
| Self-Employed (Not Incorporated) | 166 | 9.1% |
| Not-for-profit Organizations | 226 | 12.4% |
| Local Government Employees | 217 | 11.9% |
| State Government Employees | 54 | 3.0% |
| Federal Government Employees | 27 | 1.5% |
| Unpaid Family Workers | 0 | 0.0% |
| Total | 1,820 | 100.0% |
Employment Status by Age in Pipestone
According to the labor force statistics for Pipestone, out of the total population over 16 years of age (3,205), 60.5% or 1,939 individuals are in the labor force, with 4.0% or 78 of them unemployed. The age group with the highest labor force participation rate is 25 to 29 years, with 91.5% or 205 individuals in the labor force. Within the labor force, the 20 to 24 years age range has the highest percentage of unemployed individuals, with 20.4% or 28 of them being unemployed.
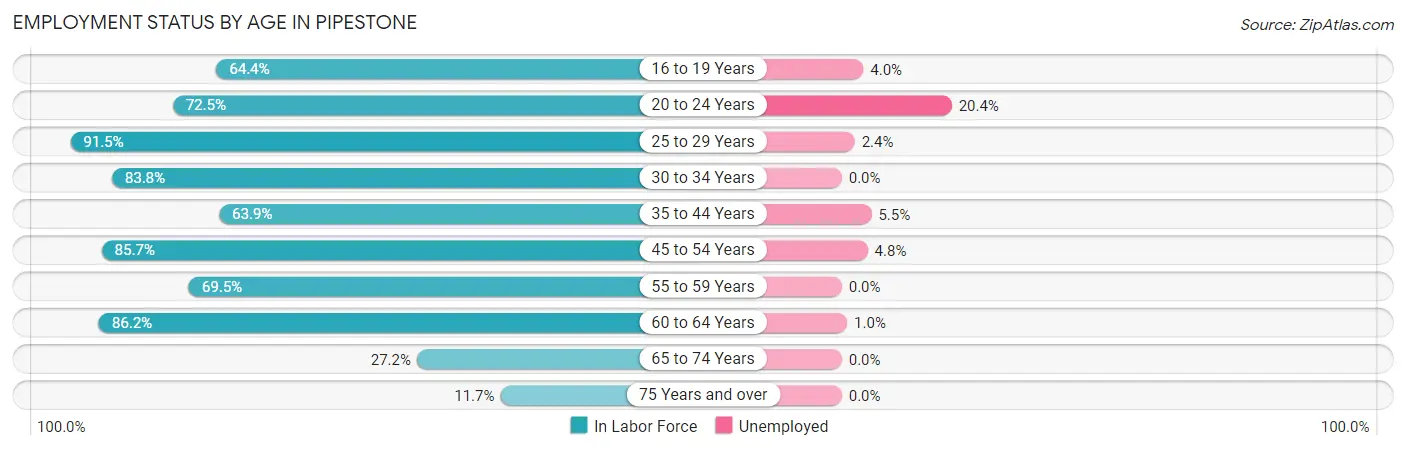
| Age Bracket | In Labor Force | Unemployed |
| 16 to 19 Years | 150 (64.4%) | 6 (4.0%) |
| 20 to 24 Years | 137 (72.5%) | 28 (20.4%) |
| 25 to 29 Years | 205 (91.5%) | 5 (2.4%) |
| 30 to 34 Years | 202 (83.8%) | 0 (0.0%) |
| 35 to 44 Years | 326 (63.9%) | 18 (5.5%) |
| 45 to 54 Years | 377 (85.7%) | 18 (4.8%) |
| 55 to 59 Years | 178 (69.5%) | 0 (0.0%) |
| 60 to 64 Years | 200 (86.2%) | 2 (1.0%) |
| 65 to 74 Years | 107 (27.2%) | 0 (0.0%) |
| 75 Years and over | 57 (11.7%) | 0 (0.0%) |
| Total | 1,939 (60.5%) | 78 (4.0%) |
Employment Status by Educational Attainment in Pipestone
According to labor force statistics for Pipestone, 78.2% of individuals (1,488) out of the total population between 25 and 64 years of age (1,903) are in the labor force, with 2.9% or 43 of them being unemployed. The group with the highest labor force participation rate are those with the educational attainment of college / associate degree, with 91.1% or 624 individuals in the labor force. Within the labor force, individuals with less than high school education have the highest percentage of unemployment, with 16.3% or 7 of them being unemployed.
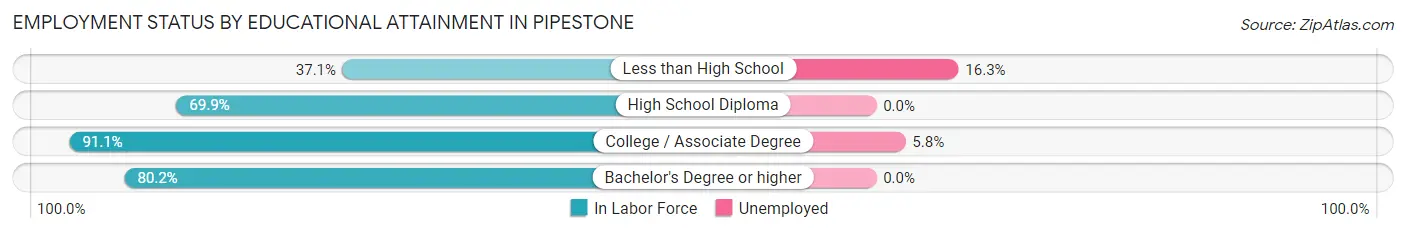
| Educational Attainment | In Labor Force | Unemployed |
| Less than High School | 43 (37.1%) | 19 (16.3%) |
| High School Diploma | 427 (69.9%) | 0 (0.0%) |
| College / Associate Degree | 624 (91.1%) | 40 (5.8%) |
| Bachelor's Degree or higher | 394 (80.2%) | 0 (0.0%) |
| Total | 1,488 (78.2%) | 55 (2.9%) |
Employment Occupations by Sex in Pipestone
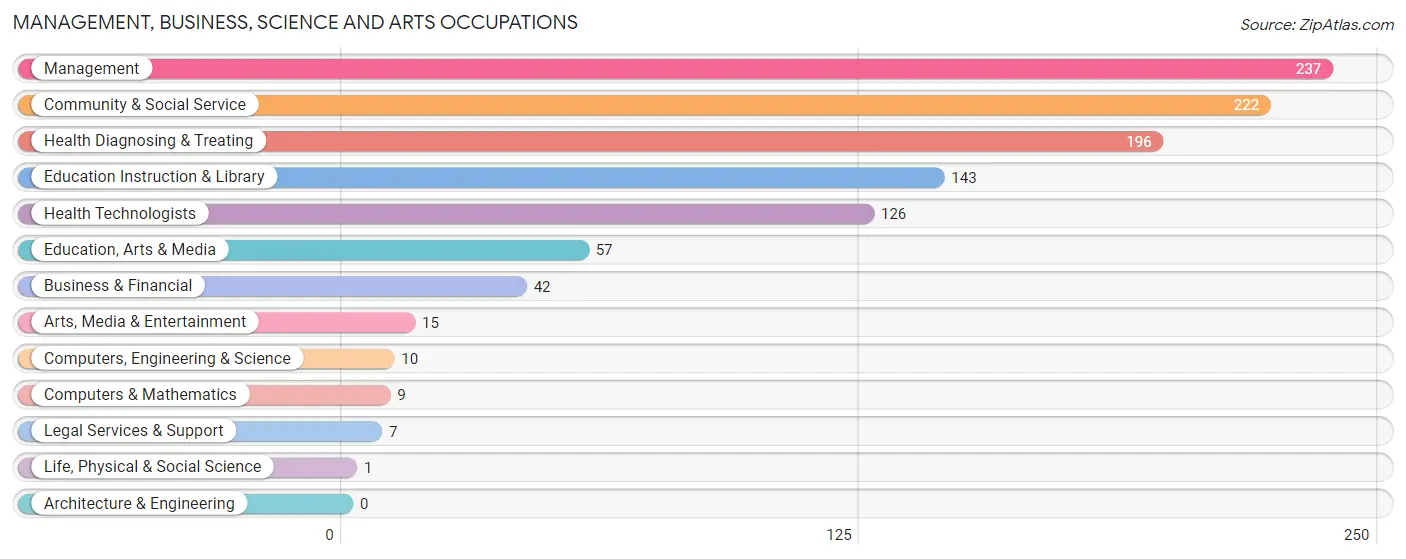
Management, Business, Science and Arts Occupations
The most common Management, Business, Science and Arts occupations in Pipestone are Management (237 | 12.7%), Community & Social Service (222 | 11.9%), Health Diagnosing & Treating (196 | 10.5%), Education Instruction & Library (143 | 7.7%), and Health Technologists (126 | 6.8%).
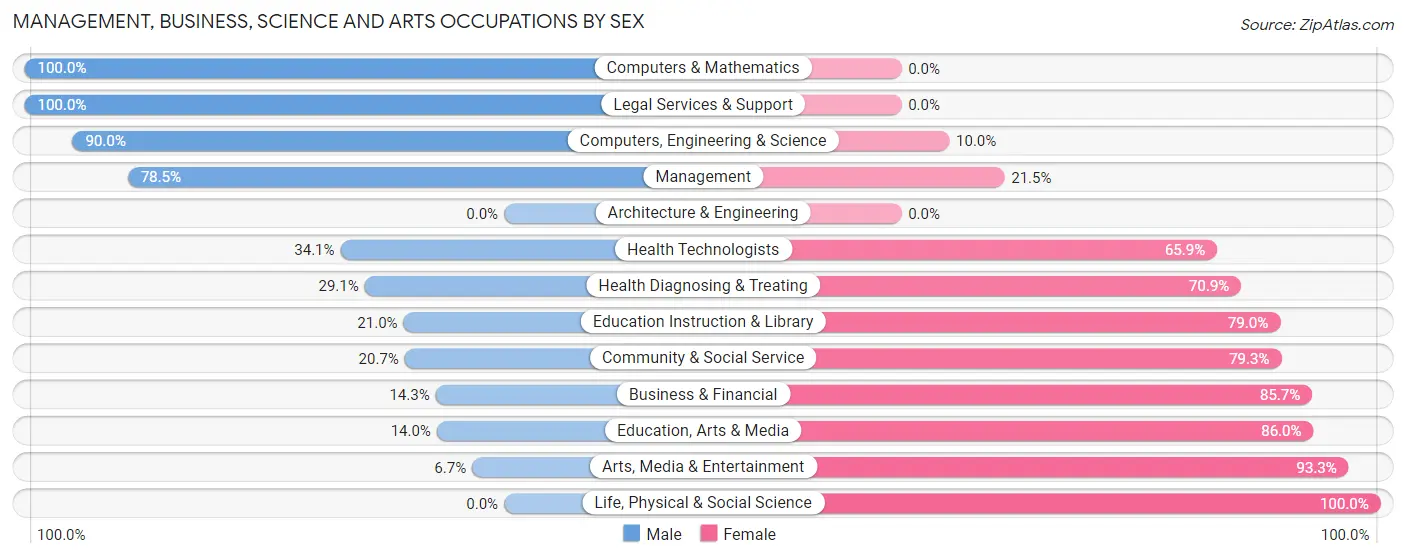
Management, Business, Science and Arts Occupations by Sex
Within the Management, Business, Science and Arts occupations in Pipestone, the most male-oriented occupations are Computers & Mathematics (100.0%), Legal Services & Support (100.0%), and Computers, Engineering & Science (90.0%), while the most female-oriented occupations are Life, Physical & Social Science (100.0%), Arts, Media & Entertainment (93.3%), and Education, Arts & Media (86.0%).
| Occupation | Male | Female |
| Management | 186 (78.5%) | 51 (21.5%) |
| Business & Financial | 6 (14.3%) | 36 (85.7%) |
| Computers, Engineering & Science | 9 (90.0%) | 1 (10.0%) |
| Computers & Mathematics | 9 (100.0%) | 0 (0.0%) |
| Architecture & Engineering | 0 (0.0%) | 0 (0.0%) |
| Life, Physical & Social Science | 0 (0.0%) | 1 (100.0%) |
| Community & Social Service | 46 (20.7%) | 176 (79.3%) |
| Education, Arts & Media | 8 (14.0%) | 49 (86.0%) |
| Legal Services & Support | 7 (100.0%) | 0 (0.0%) |
| Education Instruction & Library | 30 (21.0%) | 113 (79.0%) |
| Arts, Media & Entertainment | 1 (6.7%) | 14 (93.3%) |
| Health Diagnosing & Treating | 57 (29.1%) | 139 (70.9%) |
| Health Technologists | 43 (34.1%) | 83 (65.9%) |
| Total (Category) | 304 (43.0%) | 403 (57.0%) |
| Total (Overall) | 911 (48.9%) | 951 (51.1%) |
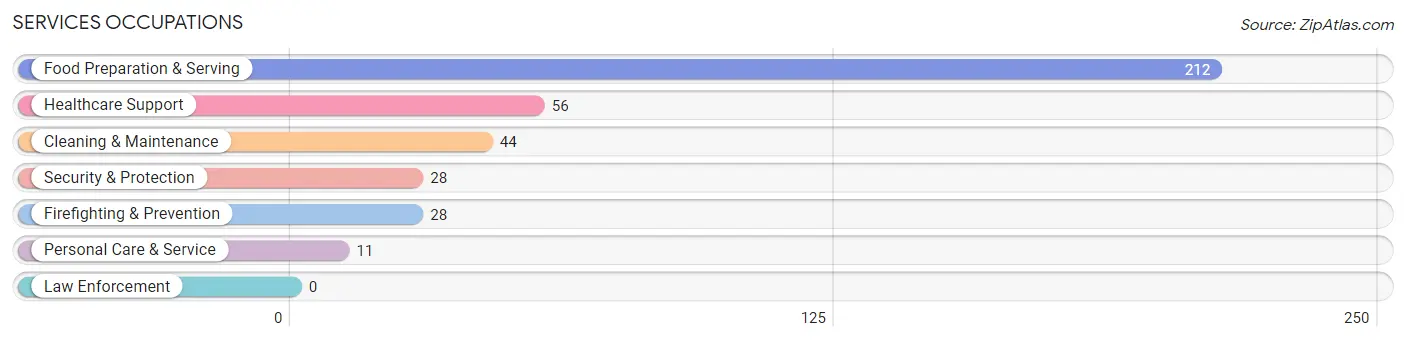
Services Occupations
The most common Services occupations in Pipestone are Food Preparation & Serving (212 | 11.4%), Healthcare Support (56 | 3.0%), Cleaning & Maintenance (44 | 2.4%), Security & Protection (28 | 1.5%), and Firefighting & Prevention (28 | 1.5%).
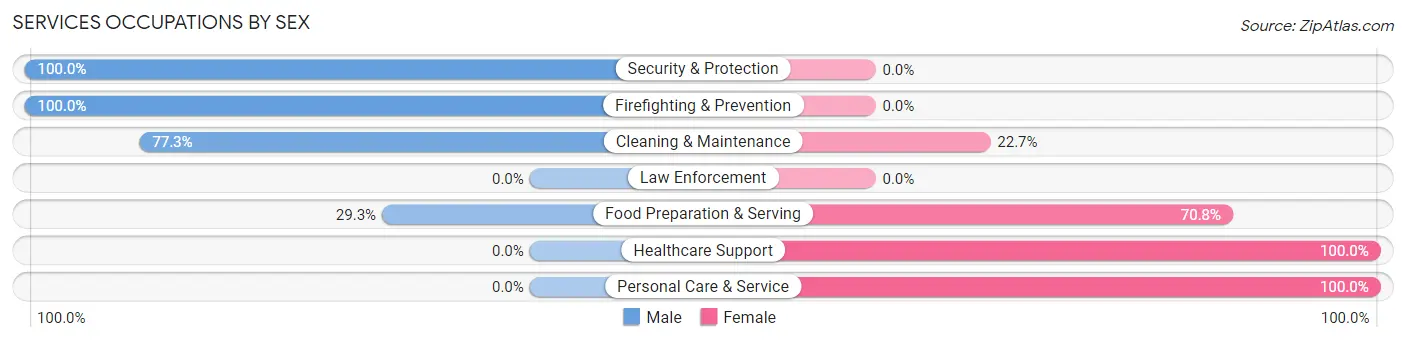
Services Occupations by Sex
Within the Services occupations in Pipestone, the most male-oriented occupations are Security & Protection (100.0%), Firefighting & Prevention (100.0%), and Cleaning & Maintenance (77.3%), while the most female-oriented occupations are Healthcare Support (100.0%), Personal Care & Service (100.0%), and Food Preparation & Serving (70.8%).
| Occupation | Male | Female |
| Healthcare Support | 0 (0.0%) | 56 (100.0%) |
| Security & Protection | 28 (100.0%) | 0 (0.0%) |
| Firefighting & Prevention | 28 (100.0%) | 0 (0.0%) |
| Law Enforcement | 0 (0.0%) | 0 (0.0%) |
| Food Preparation & Serving | 62 (29.2%) | 150 (70.8%) |
| Cleaning & Maintenance | 34 (77.3%) | 10 (22.7%) |
| Personal Care & Service | 0 (0.0%) | 11 (100.0%) |
| Total (Category) | 124 (35.3%) | 227 (64.7%) |
| Total (Overall) | 911 (48.9%) | 951 (51.1%) |
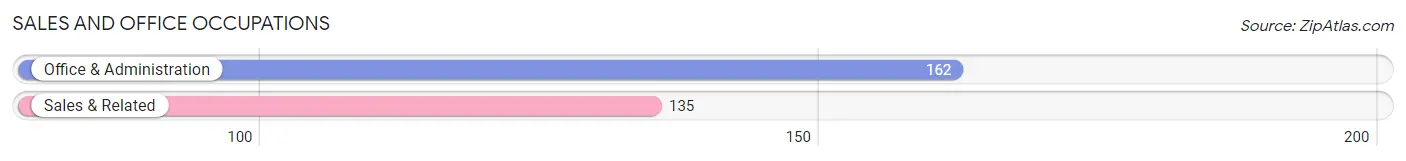
Sales and Office Occupations
The most common Sales and Office occupations in Pipestone are Office & Administration (162 | 8.7%), and Sales & Related (135 | 7.2%).
Sales and Office Occupations by Sex
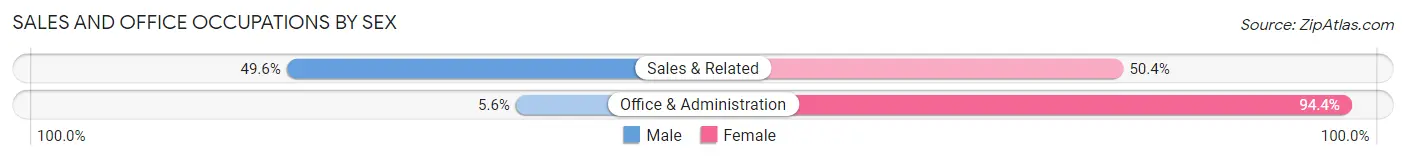
| Occupation | Male | Female |
| Sales & Related | 67 (49.6%) | 68 (50.4%) |
| Office & Administration | 9 (5.6%) | 153 (94.4%) |
| Total (Category) | 76 (25.6%) | 221 (74.4%) |
| Total (Overall) | 911 (48.9%) | 951 (51.1%) |
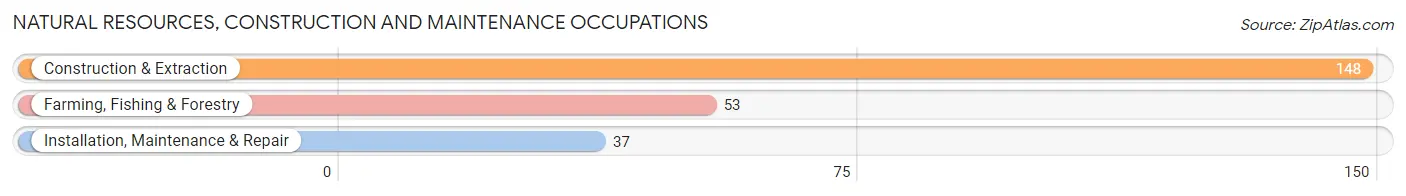
Natural Resources, Construction and Maintenance Occupations
The most common Natural Resources, Construction and Maintenance occupations in Pipestone are Construction & Extraction (148 | 8.0%), Farming, Fishing & Forestry (53 | 2.9%), and Installation, Maintenance & Repair (37 | 2.0%).
Natural Resources, Construction and Maintenance Occupations by Sex
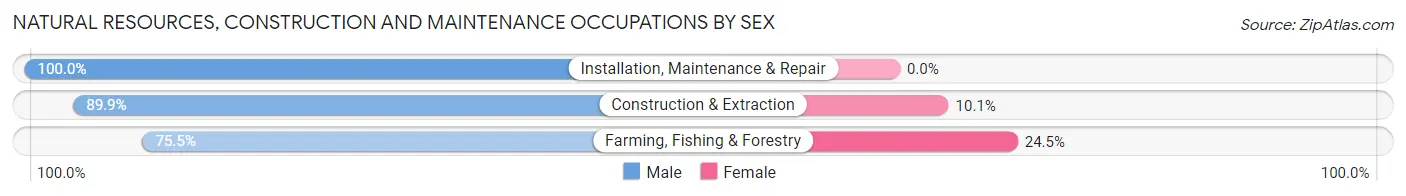
| Occupation | Male | Female |
| Farming, Fishing & Forestry | 40 (75.5%) | 13 (24.5%) |
| Construction & Extraction | 133 (89.9%) | 15 (10.1%) |
| Installation, Maintenance & Repair | 37 (100.0%) | 0 (0.0%) |
| Total (Category) | 210 (88.2%) | 28 (11.8%) |
| Total (Overall) | 911 (48.9%) | 951 (51.1%) |
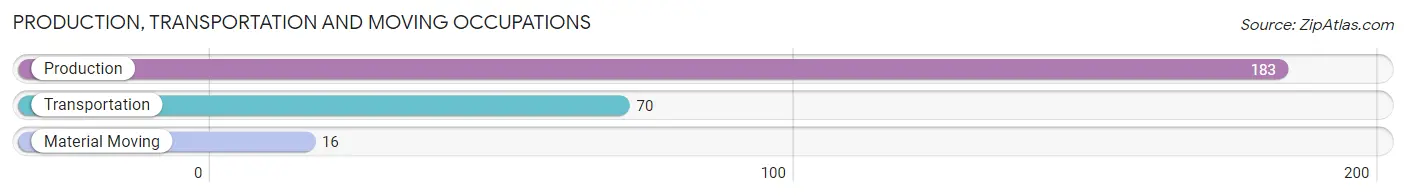
Production, Transportation and Moving Occupations
The most common Production, Transportation and Moving occupations in Pipestone are Production (183 | 9.8%), Transportation (70 | 3.8%), and Material Moving (16 | 0.9%).
Production, Transportation and Moving Occupations by Sex
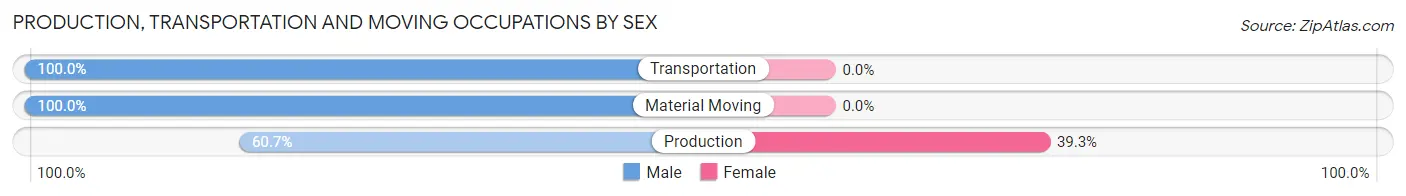
| Occupation | Male | Female |
| Production | 111 (60.7%) | 72 (39.3%) |
| Transportation | 70 (100.0%) | 0 (0.0%) |
| Material Moving | 16 (100.0%) | 0 (0.0%) |
| Total (Category) | 197 (73.2%) | 72 (26.8%) |
| Total (Overall) | 911 (48.9%) | 951 (51.1%) |
Employment Industries by Sex in Pipestone
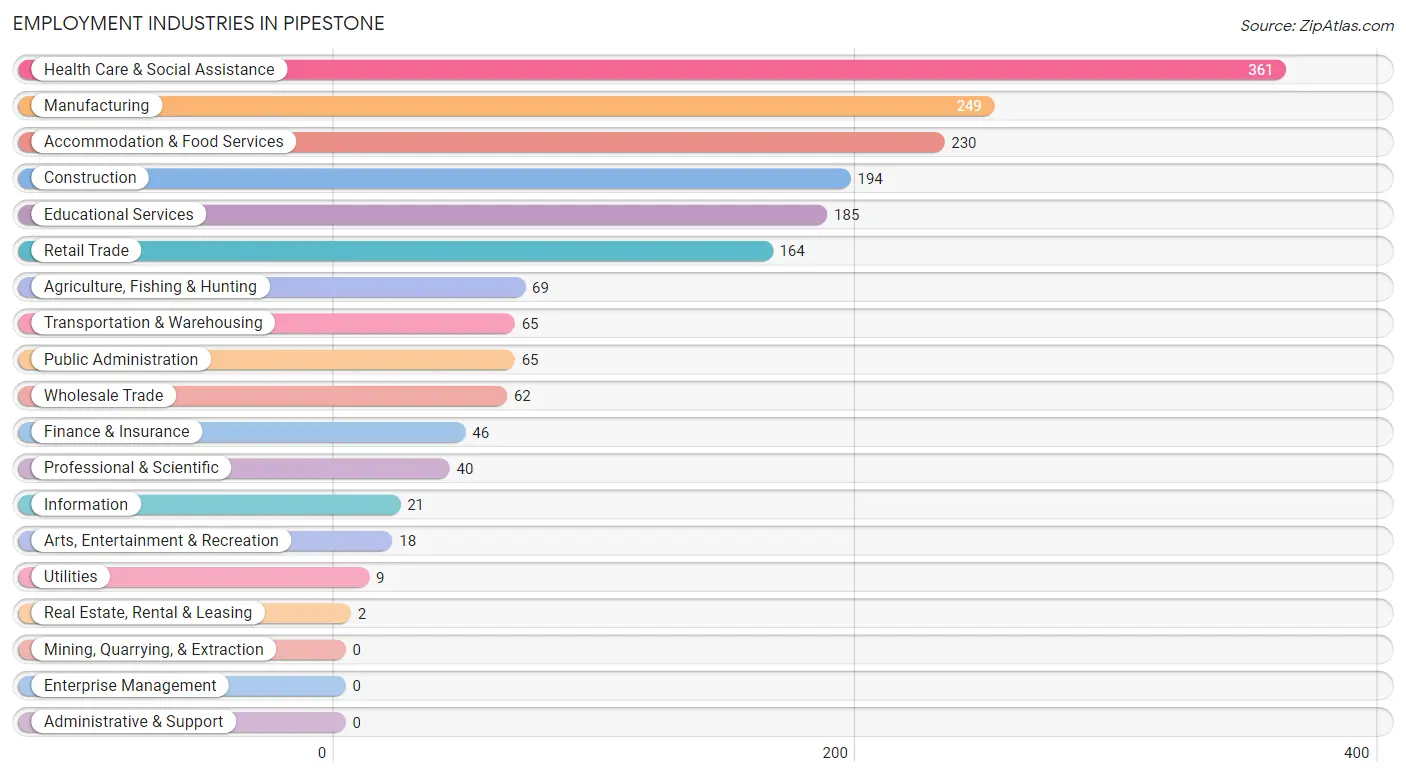
Employment Industries in Pipestone
The major employment industries in Pipestone include Health Care & Social Assistance (361 | 19.4%), Manufacturing (249 | 13.4%), Accommodation & Food Services (230 | 12.3%), Construction (194 | 10.4%), and Educational Services (185 | 9.9%).
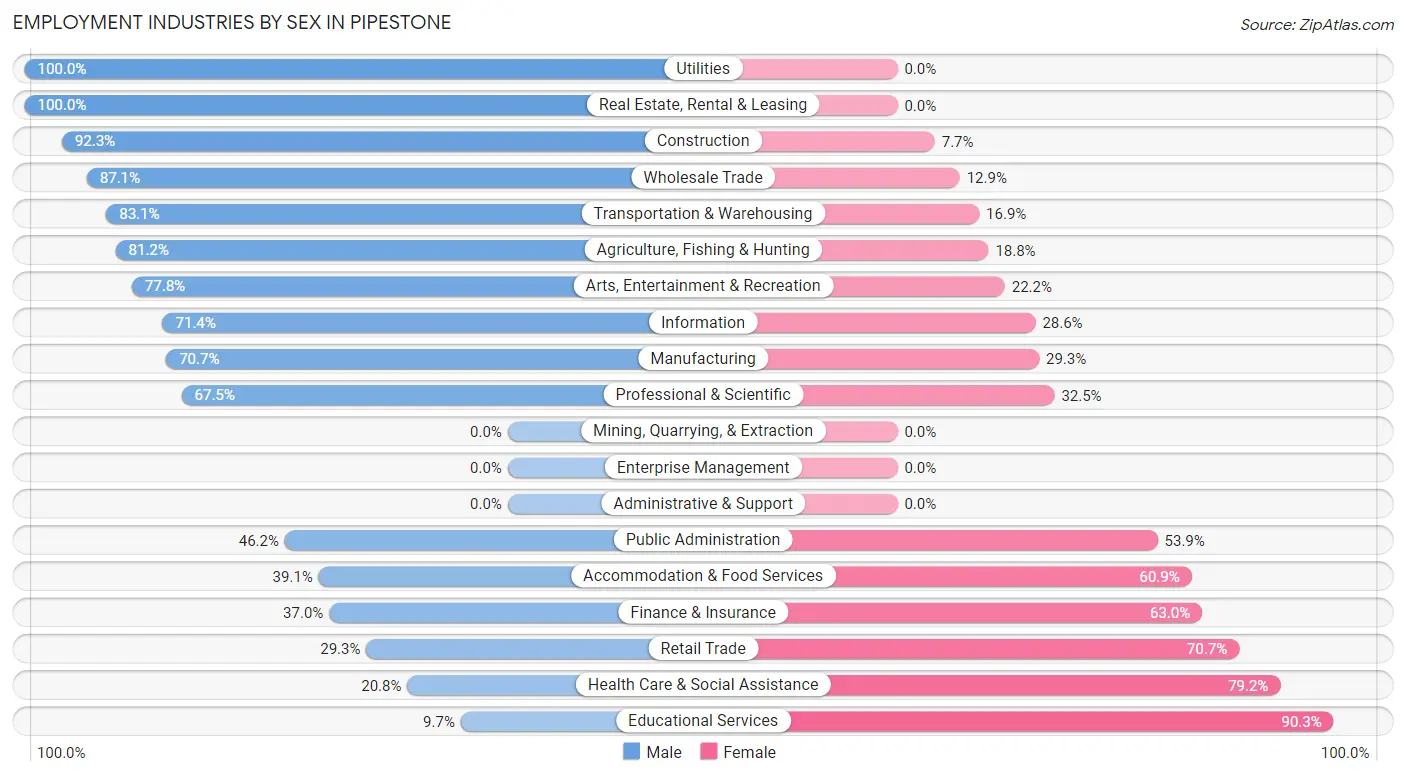
Employment Industries by Sex in Pipestone
The Pipestone industries that see more men than women are Utilities (100.0%), Real Estate, Rental & Leasing (100.0%), and Construction (92.3%), whereas the industries that tend to have a higher number of women are Educational Services (90.3%), Health Care & Social Assistance (79.2%), and Retail Trade (70.7%).
| Industry | Male | Female |
| Agriculture, Fishing & Hunting | 56 (81.2%) | 13 (18.8%) |
| Mining, Quarrying, & Extraction | 0 (0.0%) | 0 (0.0%) |
| Construction | 179 (92.3%) | 15 (7.7%) |
| Manufacturing | 176 (70.7%) | 73 (29.3%) |
| Wholesale Trade | 54 (87.1%) | 8 (12.9%) |
| Retail Trade | 48 (29.3%) | 116 (70.7%) |
| Transportation & Warehousing | 54 (83.1%) | 11 (16.9%) |
| Utilities | 9 (100.0%) | 0 (0.0%) |
| Information | 15 (71.4%) | 6 (28.6%) |
| Finance & Insurance | 17 (37.0%) | 29 (63.0%) |
| Real Estate, Rental & Leasing | 2 (100.0%) | 0 (0.0%) |
| Professional & Scientific | 27 (67.5%) | 13 (32.5%) |
| Enterprise Management | 0 (0.0%) | 0 (0.0%) |
| Administrative & Support | 0 (0.0%) | 0 (0.0%) |
| Educational Services | 18 (9.7%) | 167 (90.3%) |
| Health Care & Social Assistance | 75 (20.8%) | 286 (79.2%) |
| Arts, Entertainment & Recreation | 14 (77.8%) | 4 (22.2%) |
| Accommodation & Food Services | 90 (39.1%) | 140 (60.9%) |
| Public Administration | 30 (46.2%) | 35 (53.8%) |
| Total | 911 (48.9%) | 951 (51.1%) |
Education in Pipestone
School Enrollment in Pipestone
The most common levels of schooling among the 935 students in Pipestone are high school (272 | 29.1%), middle school (207 | 22.1%), and elementary school (192 | 20.5%).
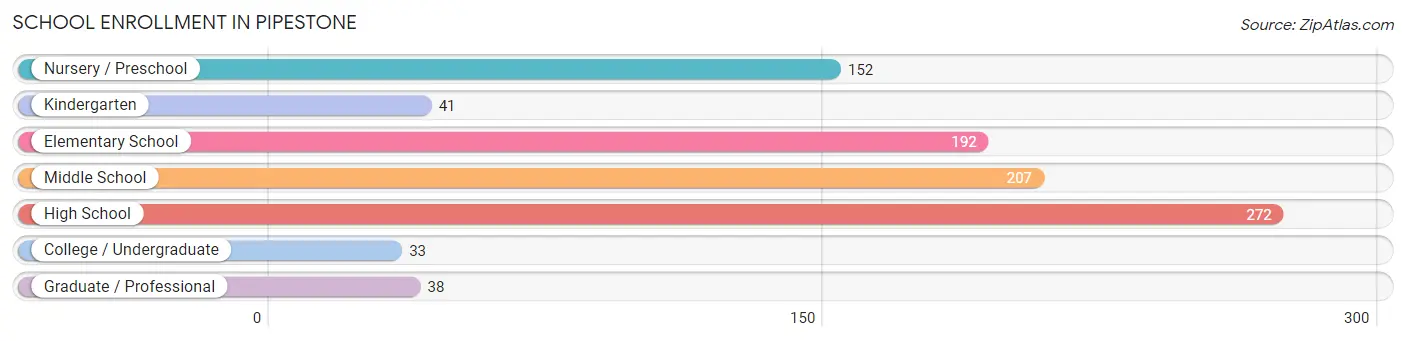
| School Level | # Students | % Students |
| Nursery / Preschool | 152 | 16.3% |
| Kindergarten | 41 | 4.4% |
| Elementary School | 192 | 20.5% |
| Middle School | 207 | 22.1% |
| High School | 272 | 29.1% |
| College / Undergraduate | 33 | 3.5% |
| Graduate / Professional | 38 | 4.1% |
| Total | 935 | 100.0% |
School Enrollment by Age by Funding Source in Pipestone
Out of a total of 935 students who are enrolled in schools in Pipestone, 145 (15.5%) attend a private institution, while the remaining 790 (84.5%) are enrolled in public schools. The age group of 25 to 34 year olds has the highest likelihood of being enrolled in private schools, with 18 (100.0% in the age bracket) enrolled. Conversely, the age group of 15 to 17 year olds has the lowest likelihood of being enrolled in a private school, with 184 (100.0% in the age bracket) attending a public institution.
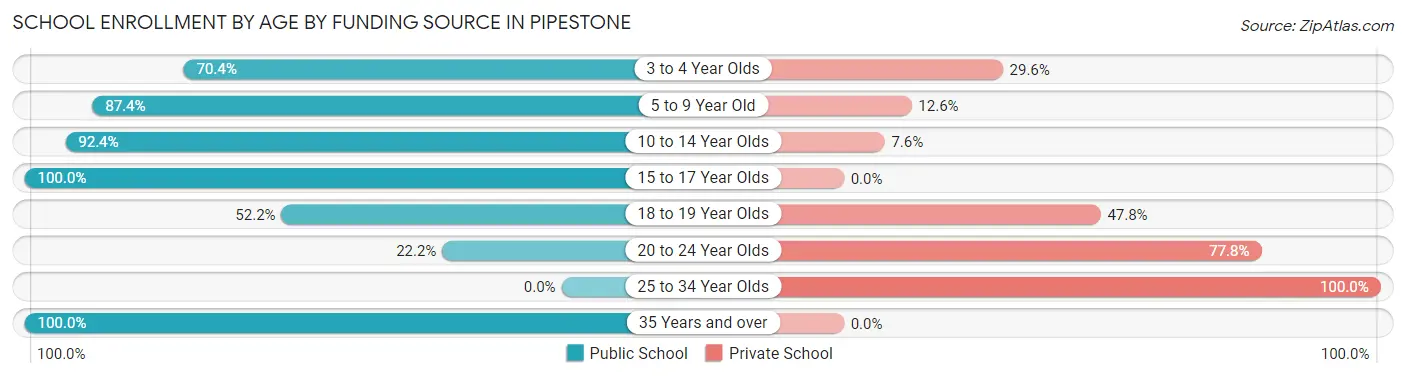
| Age Bracket | Public School | Private School |
| 3 to 4 Year Olds | 88 (70.4%) | 37 (29.6%) |
| 5 to 9 Year Old | 180 (87.4%) | 26 (12.6%) |
| 10 to 14 Year Olds | 304 (92.4%) | 25 (7.6%) |
| 15 to 17 Year Olds | 184 (100.0%) | 0 (0.0%) |
| 18 to 19 Year Olds | 12 (52.2%) | 11 (47.8%) |
| 20 to 24 Year Olds | 8 (22.2%) | 28 (77.8%) |
| 25 to 34 Year Olds | 0 (0.0%) | 18 (100.0%) |
| 35 Years and over | 14 (100.0%) | 0 (0.0%) |
| Total | 790 (84.5%) | 145 (15.5%) |
Educational Attainment by Field of Study in Pipestone
Education (184 | 26.7%), business (149 | 21.6%), bio, nature & agricultural (106 | 15.4%), science & technology (85 | 12.3%), and liberal arts & history (49 | 7.1%) are the most common fields of study among 689 individuals in Pipestone who have obtained a bachelor's degree or higher.
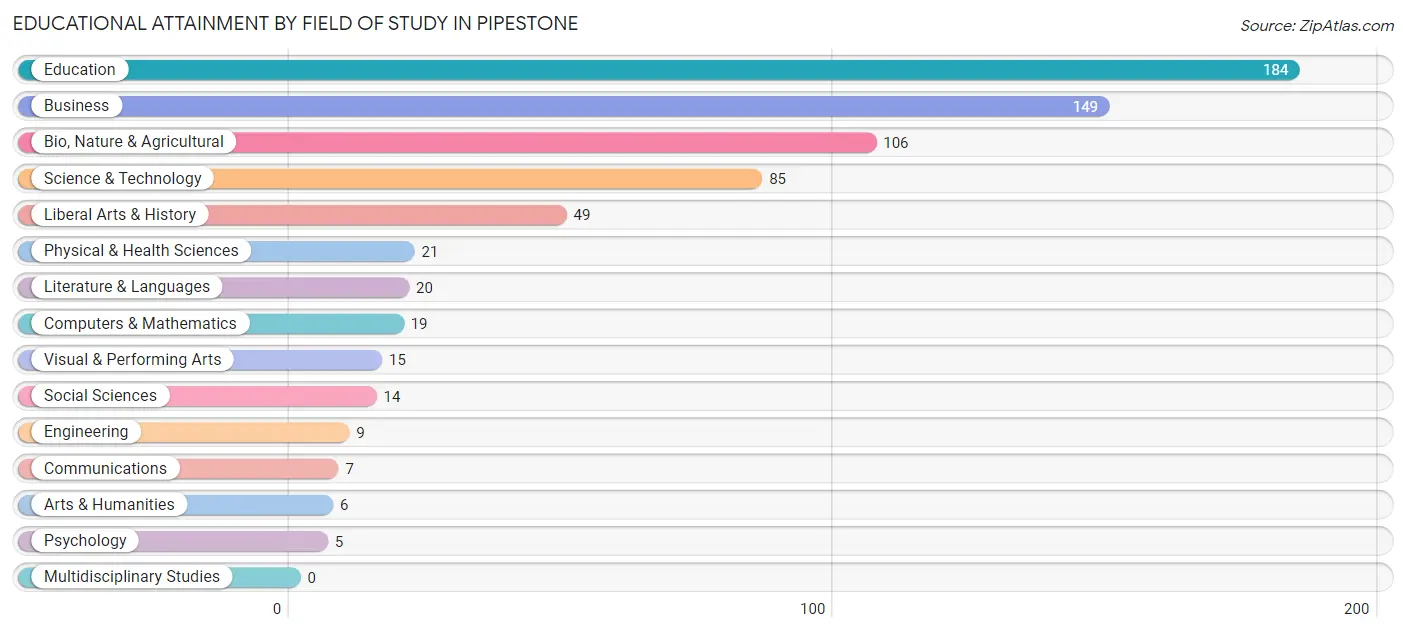
| Field of Study | # Graduates | % Graduates |
| Computers & Mathematics | 19 | 2.8% |
| Bio, Nature & Agricultural | 106 | 15.4% |
| Physical & Health Sciences | 21 | 3.0% |
| Psychology | 5 | 0.7% |
| Social Sciences | 14 | 2.0% |
| Engineering | 9 | 1.3% |
| Multidisciplinary Studies | 0 | 0.0% |
| Science & Technology | 85 | 12.3% |
| Business | 149 | 21.6% |
| Education | 184 | 26.7% |
| Literature & Languages | 20 | 2.9% |
| Liberal Arts & History | 49 | 7.1% |
| Visual & Performing Arts | 15 | 2.2% |
| Communications | 7 | 1.0% |
| Arts & Humanities | 6 | 0.9% |
| Total | 689 | 100.0% |
Transportation & Commute in Pipestone
Vehicle Availability by Sex in Pipestone
The most prevalent vehicle ownership categories in Pipestone are males with 2 vehicles (364, accounting for 41.6%) and females with 2 vehicles (281, making up 38.6%).
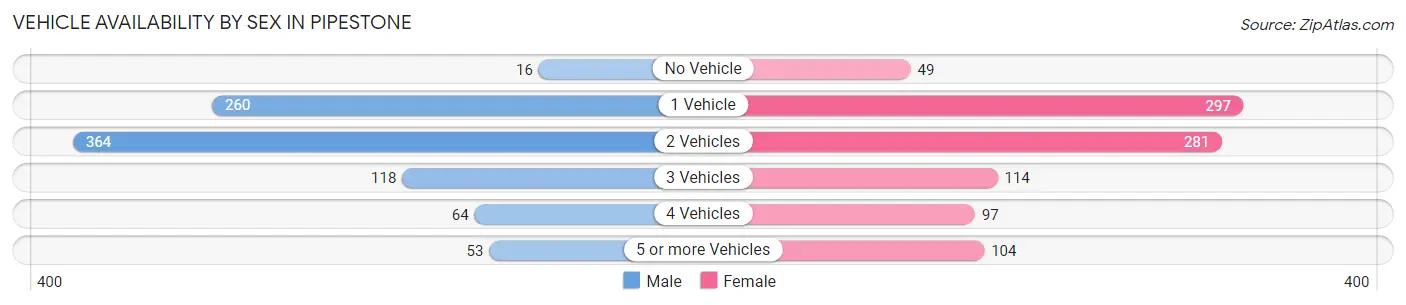
| Vehicles Available | Male | Female |
| No Vehicle | 16 (1.8%) | 49 (5.2%) |
| 1 Vehicle | 260 (29.7%) | 297 (31.5%) |
| 2 Vehicles | 364 (41.6%) | 281 (29.8%) |
| 3 Vehicles | 118 (13.5%) | 114 (12.1%) |
| 4 Vehicles | 64 (7.3%) | 97 (10.3%) |
| 5 or more Vehicles | 53 (6.1%) | 104 (11.0%) |
| Total | 875 (100.0%) | 942 (100.0%) |
Commute Time in Pipestone
The most frequently occuring commute durations in Pipestone are 5 to 9 minutes (667 commuters, 39.0%), less than 5 minutes (357 commuters, 20.8%), and 10 to 14 minutes (222 commuters, 13.0%).
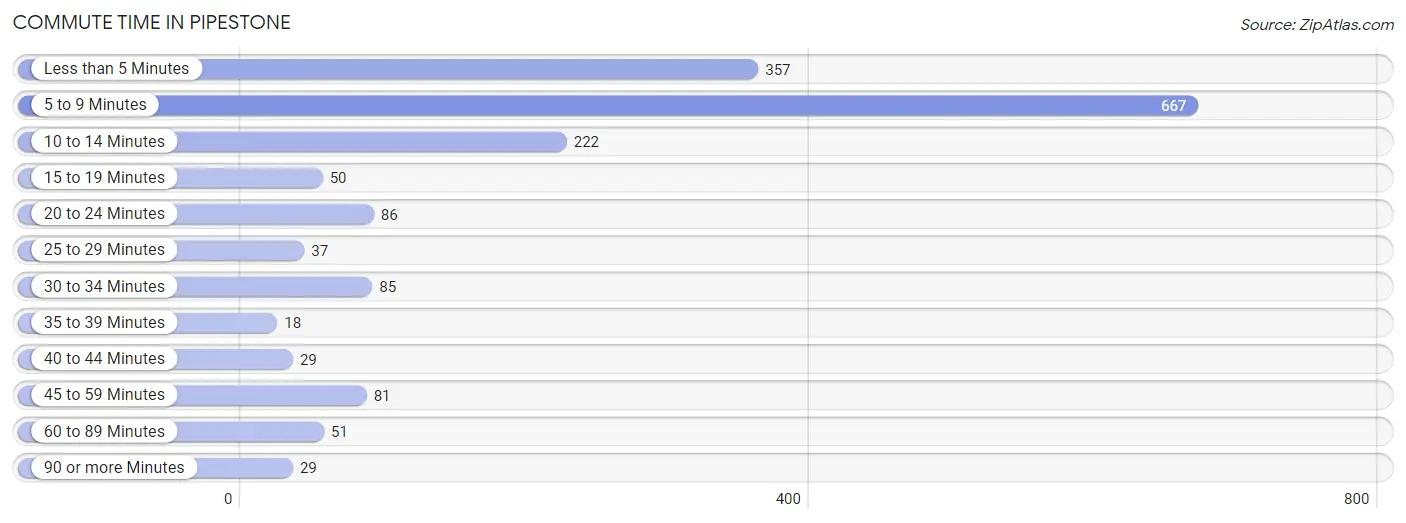
| Commute Time | # Commuters | % Commuters |
| Less than 5 Minutes | 357 | 20.8% |
| 5 to 9 Minutes | 667 | 39.0% |
| 10 to 14 Minutes | 222 | 13.0% |
| 15 to 19 Minutes | 50 | 2.9% |
| 20 to 24 Minutes | 86 | 5.0% |
| 25 to 29 Minutes | 37 | 2.2% |
| 30 to 34 Minutes | 85 | 5.0% |
| 35 to 39 Minutes | 18 | 1.1% |
| 40 to 44 Minutes | 29 | 1.7% |
| 45 to 59 Minutes | 81 | 4.7% |
| 60 to 89 Minutes | 51 | 3.0% |
| 90 or more Minutes | 29 | 1.7% |
Commute Time by Sex in Pipestone
The most common commute times in Pipestone are 5 to 9 minutes (325 commuters, 38.8%) for males and 5 to 9 minutes (342 commuters, 39.1%) for females.
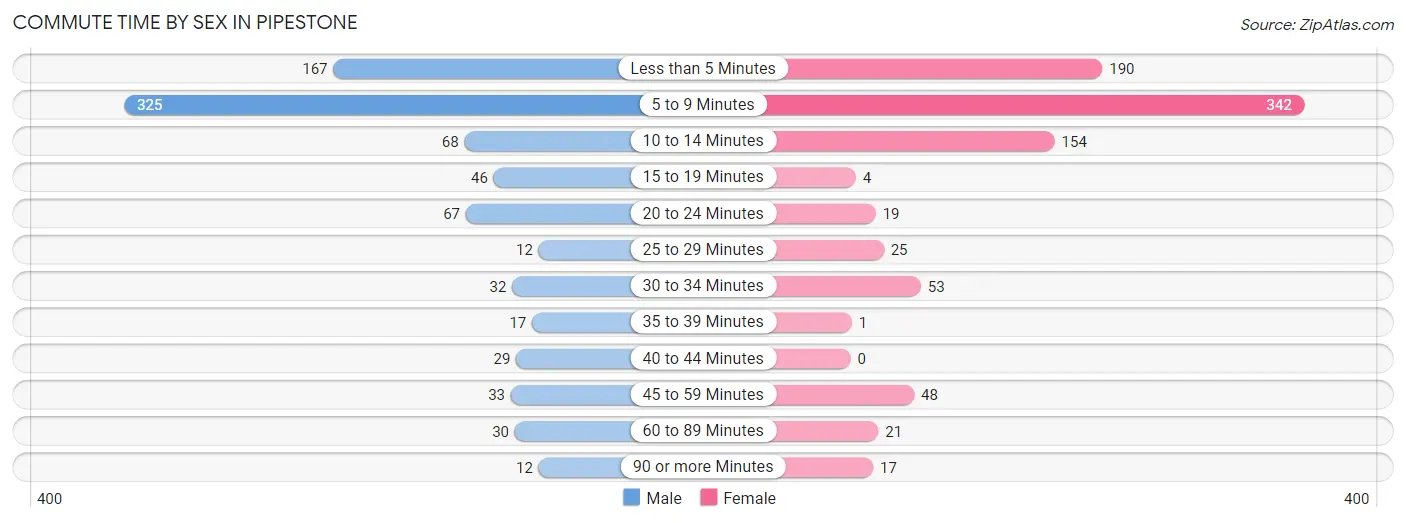
| Commute Time | Male | Female |
| Less than 5 Minutes | 167 (19.9%) | 190 (21.7%) |
| 5 to 9 Minutes | 325 (38.8%) | 342 (39.1%) |
| 10 to 14 Minutes | 68 (8.1%) | 154 (17.6%) |
| 15 to 19 Minutes | 46 (5.5%) | 4 (0.5%) |
| 20 to 24 Minutes | 67 (8.0%) | 19 (2.2%) |
| 25 to 29 Minutes | 12 (1.4%) | 25 (2.9%) |
| 30 to 34 Minutes | 32 (3.8%) | 53 (6.1%) |
| 35 to 39 Minutes | 17 (2.0%) | 1 (0.1%) |
| 40 to 44 Minutes | 29 (3.5%) | 0 (0.0%) |
| 45 to 59 Minutes | 33 (3.9%) | 48 (5.5%) |
| 60 to 89 Minutes | 30 (3.6%) | 21 (2.4%) |
| 90 or more Minutes | 12 (1.4%) | 17 (1.9%) |
Time of Departure to Work by Sex in Pipestone
The most frequent times of departure to work in Pipestone are 6:30 AM to 6:59 AM (117, 14.0%) for males and 7:30 AM to 7:59 AM (216, 24.7%) for females.
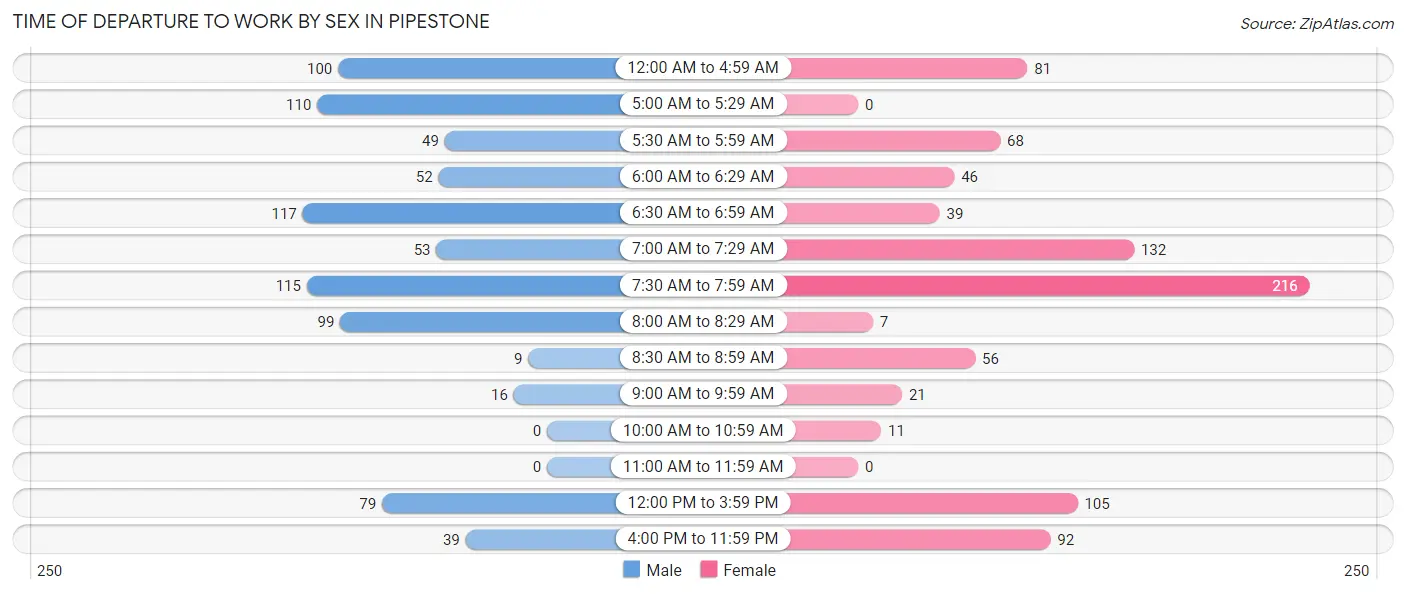
| Time of Departure | Male | Female |
| 12:00 AM to 4:59 AM | 100 (11.9%) | 81 (9.3%) |
| 5:00 AM to 5:29 AM | 110 (13.1%) | 0 (0.0%) |
| 5:30 AM to 5:59 AM | 49 (5.9%) | 68 (7.8%) |
| 6:00 AM to 6:29 AM | 52 (6.2%) | 46 (5.3%) |
| 6:30 AM to 6:59 AM | 117 (14.0%) | 39 (4.5%) |
| 7:00 AM to 7:29 AM | 53 (6.3%) | 132 (15.1%) |
| 7:30 AM to 7:59 AM | 115 (13.7%) | 216 (24.7%) |
| 8:00 AM to 8:29 AM | 99 (11.8%) | 7 (0.8%) |
| 8:30 AM to 8:59 AM | 9 (1.1%) | 56 (6.4%) |
| 9:00 AM to 9:59 AM | 16 (1.9%) | 21 (2.4%) |
| 10:00 AM to 10:59 AM | 0 (0.0%) | 11 (1.3%) |
| 11:00 AM to 11:59 AM | 0 (0.0%) | 0 (0.0%) |
| 12:00 PM to 3:59 PM | 79 (9.4%) | 105 (12.0%) |
| 4:00 PM to 11:59 PM | 39 (4.6%) | 92 (10.5%) |
| Total | 838 (100.0%) | 874 (100.0%) |
Housing Occupancy in Pipestone
Occupancy by Ownership in Pipestone
Of the total 1,817 dwellings in Pipestone, owner-occupied units account for 1,285 (70.7%), while renter-occupied units make up 532 (29.3%).
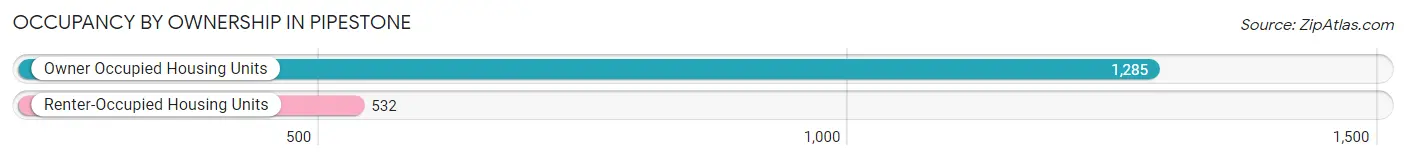
| Occupancy | # Housing Units | % Housing Units |
| Owner Occupied Housing Units | 1,285 | 70.7% |
| Renter-Occupied Housing Units | 532 | 29.3% |
| Total Occupied Housing Units | 1,817 | 100.0% |
Occupancy by Household Size in Pipestone
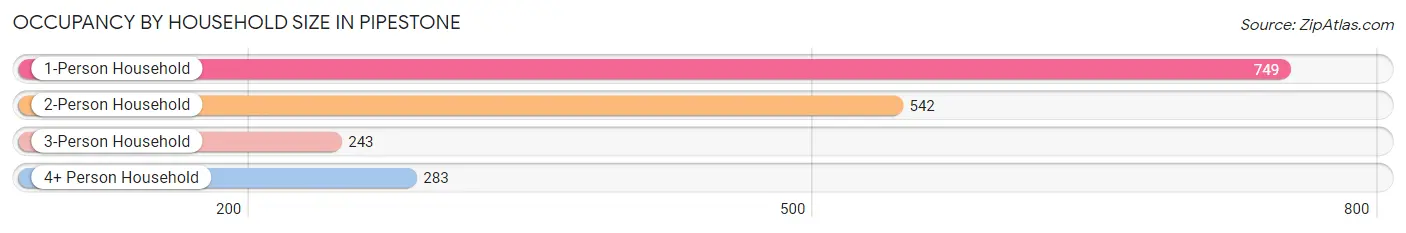
| Household Size | # Housing Units | % Housing Units |
| 1-Person Household | 749 | 41.2% |
| 2-Person Household | 542 | 29.8% |
| 3-Person Household | 243 | 13.4% |
| 4+ Person Household | 283 | 15.6% |
| Total Housing Units | 1,817 | 100.0% |
Occupancy by Ownership by Household Size in Pipestone
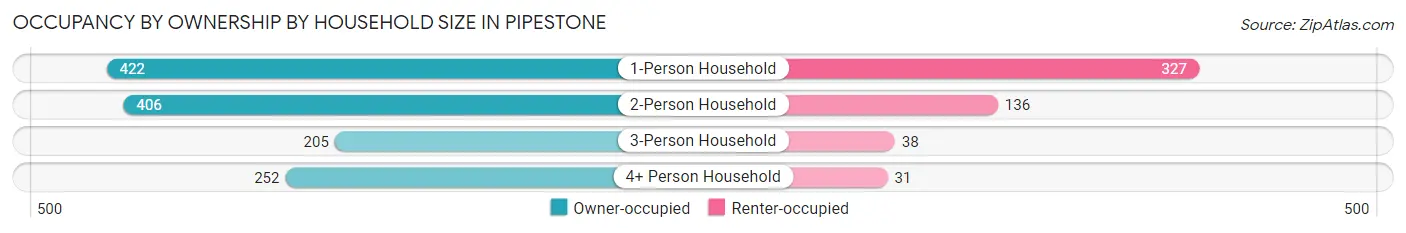
| Household Size | Owner-occupied | Renter-occupied |
| 1-Person Household | 422 (56.3%) | 327 (43.7%) |
| 2-Person Household | 406 (74.9%) | 136 (25.1%) |
| 3-Person Household | 205 (84.4%) | 38 (15.6%) |
| 4+ Person Household | 252 (89.0%) | 31 (11.0%) |
| Total Housing Units | 1,285 (70.7%) | 532 (29.3%) |
Occupancy by Educational Attainment in Pipestone
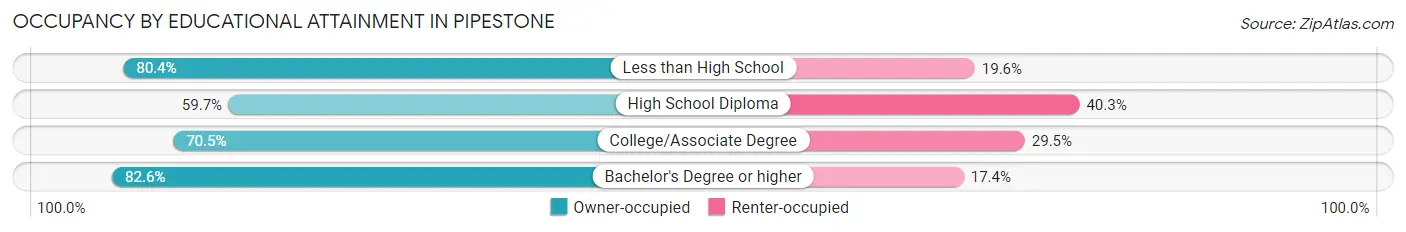
| Household Size | Owner-occupied | Renter-occupied |
| Less than High School | 74 (80.4%) | 18 (19.6%) |
| High School Diploma | 345 (59.7%) | 233 (40.3%) |
| College/Associate Degree | 476 (70.5%) | 199 (29.5%) |
| Bachelor's Degree or higher | 390 (82.6%) | 82 (17.4%) |
Occupancy by Age of Householder in Pipestone
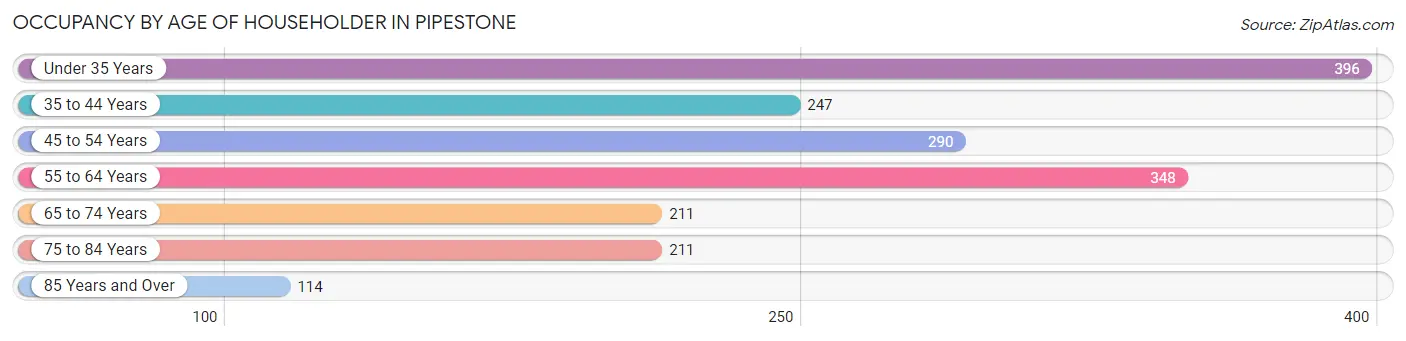
| Age Bracket | # Households | % Households |
| Under 35 Years | 396 | 21.8% |
| 35 to 44 Years | 247 | 13.6% |
| 45 to 54 Years | 290 | 16.0% |
| 55 to 64 Years | 348 | 19.2% |
| 65 to 74 Years | 211 | 11.6% |
| 75 to 84 Years | 211 | 11.6% |
| 85 Years and Over | 114 | 6.3% |
| Total | 1,817 | 100.0% |
Housing Finances in Pipestone
Median Income by Occupancy in Pipestone
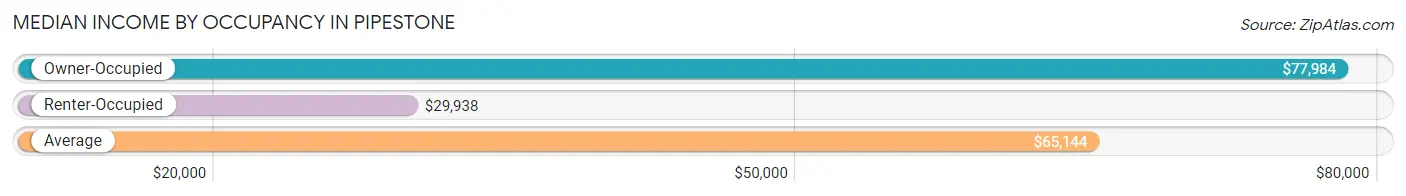
| Occupancy Type | # Households | Median Income |
| Owner-Occupied | 1,285 (70.7%) | $77,984 |
| Renter-Occupied | 532 (29.3%) | $29,938 |
| Average | 1,817 (100.0%) | $65,144 |
Occupancy by Householder Income Bracket in Pipestone
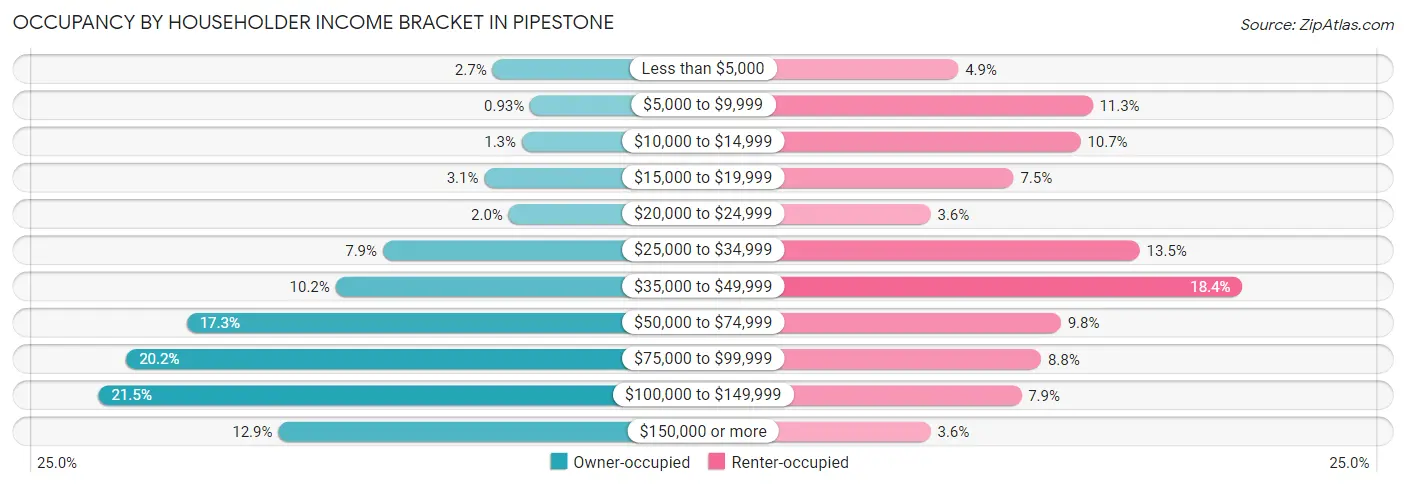
| Income Bracket | Owner-occupied | Renter-occupied |
| Less than $5,000 | 35 (2.7%) | 26 (4.9%) |
| $5,000 to $9,999 | 12 (0.9%) | 60 (11.3%) |
| $10,000 to $14,999 | 17 (1.3%) | 57 (10.7%) |
| $15,000 to $19,999 | 40 (3.1%) | 40 (7.5%) |
| $20,000 to $24,999 | 25 (1.9%) | 19 (3.6%) |
| $25,000 to $34,999 | 102 (7.9%) | 72 (13.5%) |
| $35,000 to $49,999 | 131 (10.2%) | 98 (18.4%) |
| $50,000 to $74,999 | 222 (17.3%) | 52 (9.8%) |
| $75,000 to $99,999 | 259 (20.2%) | 47 (8.8%) |
| $100,000 to $149,999 | 276 (21.5%) | 42 (7.9%) |
| $150,000 or more | 166 (12.9%) | 19 (3.6%) |
| Total | 1,285 (100.0%) | 532 (100.0%) |
Monthly Housing Cost Tiers in Pipestone
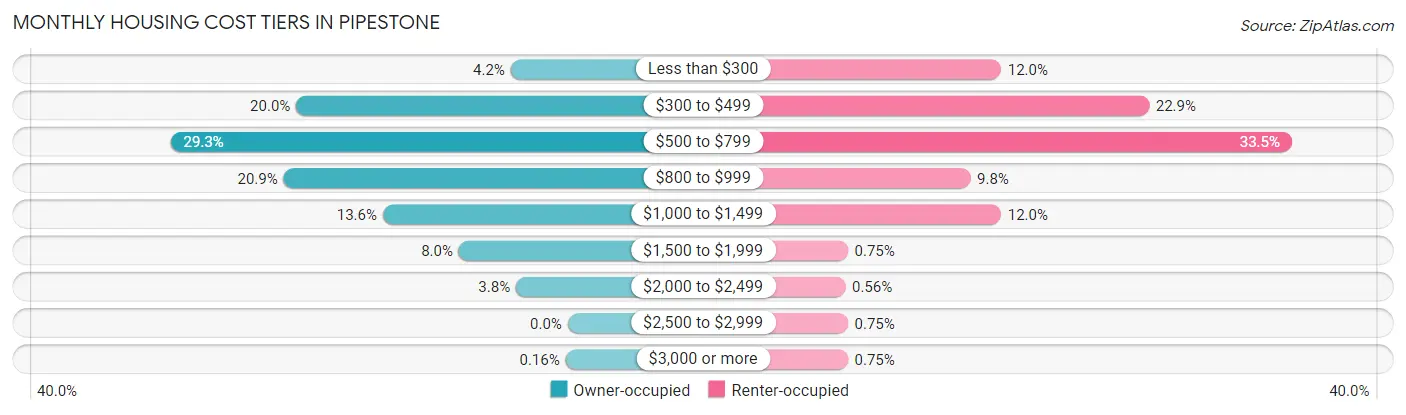
| Monthly Cost | Owner-occupied | Renter-occupied |
| Less than $300 | 54 (4.2%) | 64 (12.0%) |
| $300 to $499 | 257 (20.0%) | 122 (22.9%) |
| $500 to $799 | 376 (29.3%) | 178 (33.5%) |
| $800 to $999 | 269 (20.9%) | 52 (9.8%) |
| $1,000 to $1,499 | 175 (13.6%) | 64 (12.0%) |
| $1,500 to $1,999 | 103 (8.0%) | 4 (0.7%) |
| $2,000 to $2,499 | 49 (3.8%) | 3 (0.6%) |
| $2,500 to $2,999 | 0 (0.0%) | 4 (0.7%) |
| $3,000 or more | 2 (0.2%) | 4 (0.7%) |
| Total | 1,285 (100.0%) | 532 (100.0%) |
Physical Housing Characteristics in Pipestone
Housing Structures in Pipestone
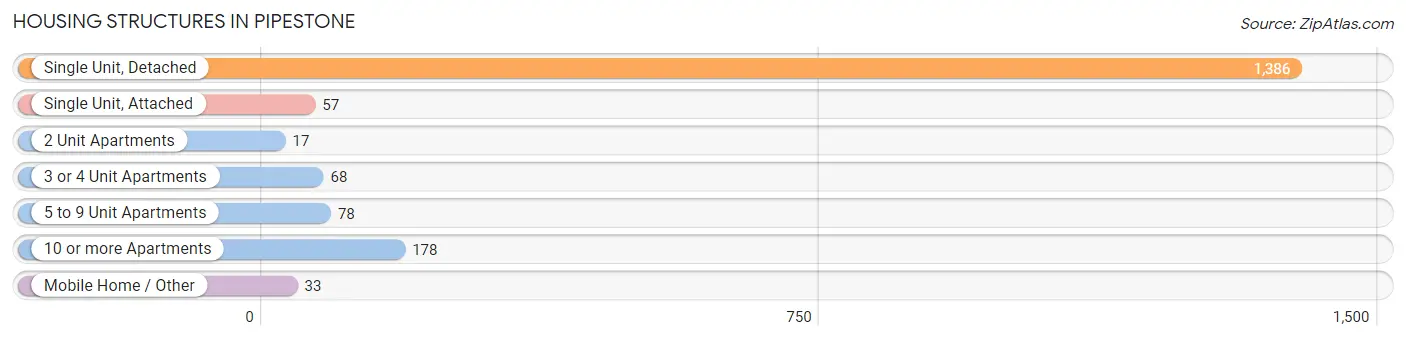
| Structure Type | # Housing Units | % Housing Units |
| Single Unit, Detached | 1,386 | 76.3% |
| Single Unit, Attached | 57 | 3.1% |
| 2 Unit Apartments | 17 | 0.9% |
| 3 or 4 Unit Apartments | 68 | 3.7% |
| 5 to 9 Unit Apartments | 78 | 4.3% |
| 10 or more Apartments | 178 | 9.8% |
| Mobile Home / Other | 33 | 1.8% |
| Total | 1,817 | 100.0% |
Housing Structures by Occupancy in Pipestone
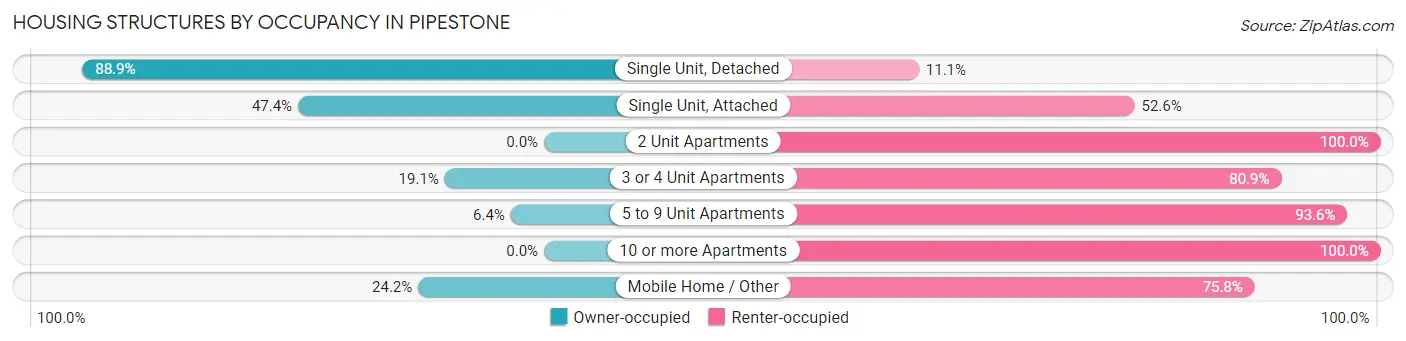
| Structure Type | Owner-occupied | Renter-occupied |
| Single Unit, Detached | 1,232 (88.9%) | 154 (11.1%) |
| Single Unit, Attached | 27 (47.4%) | 30 (52.6%) |
| 2 Unit Apartments | 0 (0.0%) | 17 (100.0%) |
| 3 or 4 Unit Apartments | 13 (19.1%) | 55 (80.9%) |
| 5 to 9 Unit Apartments | 5 (6.4%) | 73 (93.6%) |
| 10 or more Apartments | 0 (0.0%) | 178 (100.0%) |
| Mobile Home / Other | 8 (24.2%) | 25 (75.8%) |
| Total | 1,285 (70.7%) | 532 (29.3%) |
Housing Structures by Number of Rooms in Pipestone
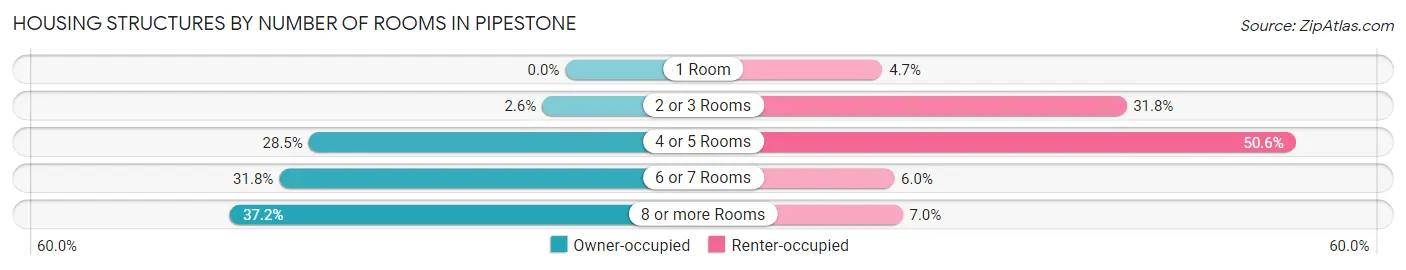
| Number of Rooms | Owner-occupied | Renter-occupied |
| 1 Room | 0 (0.0%) | 25 (4.7%) |
| 2 or 3 Rooms | 33 (2.6%) | 169 (31.8%) |
| 4 or 5 Rooms | 366 (28.5%) | 269 (50.6%) |
| 6 or 7 Rooms | 408 (31.8%) | 32 (6.0%) |
| 8 or more Rooms | 478 (37.2%) | 37 (7.0%) |
| Total | 1,285 (100.0%) | 532 (100.0%) |
Housing Structure by Heating Type in Pipestone
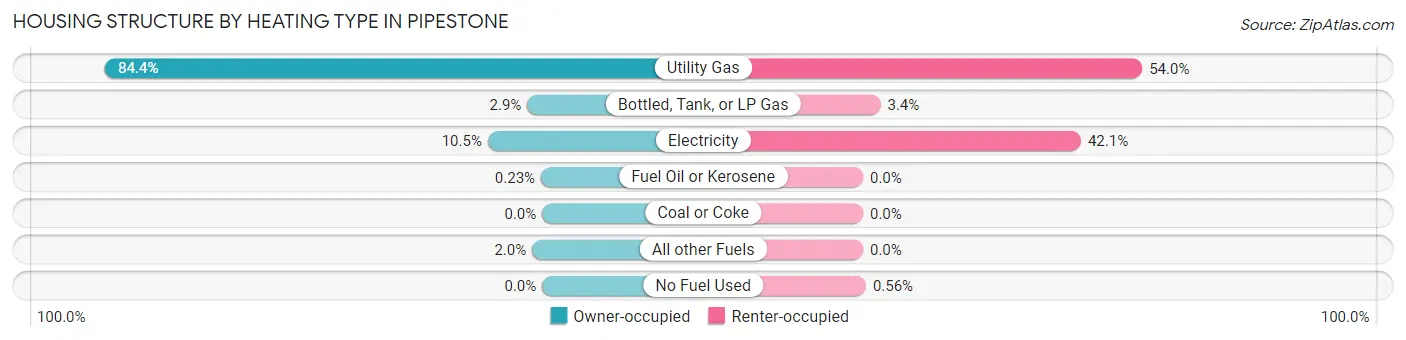
| Heating Type | Owner-occupied | Renter-occupied |
| Utility Gas | 1,085 (84.4%) | 287 (53.9%) |
| Bottled, Tank, or LP Gas | 37 (2.9%) | 18 (3.4%) |
| Electricity | 135 (10.5%) | 224 (42.1%) |
| Fuel Oil or Kerosene | 3 (0.2%) | 0 (0.0%) |
| Coal or Coke | 0 (0.0%) | 0 (0.0%) |
| All other Fuels | 25 (1.9%) | 0 (0.0%) |
| No Fuel Used | 0 (0.0%) | 3 (0.6%) |
| Total | 1,285 (100.0%) | 532 (100.0%) |
Household Vehicle Usage in Pipestone
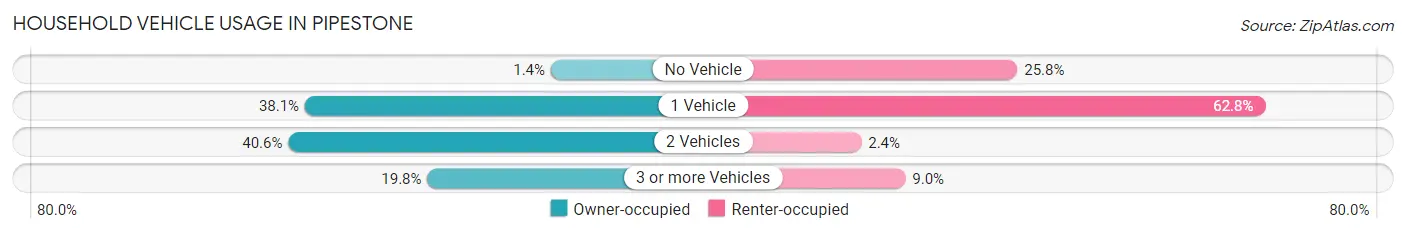
| Vehicles per Household | Owner-occupied | Renter-occupied |
| No Vehicle | 18 (1.4%) | 137 (25.8%) |
| 1 Vehicle | 490 (38.1%) | 334 (62.8%) |
| 2 Vehicles | 522 (40.6%) | 13 (2.4%) |
| 3 or more Vehicles | 255 (19.8%) | 48 (9.0%) |
| Total | 1,285 (100.0%) | 532 (100.0%) |
Real Estate & Mortgages in Pipestone
Real Estate and Mortgage Overview in Pipestone
| Characteristic | Without Mortgage | With Mortgage |
| Housing Units | 549 | 736 |
| Median Property Value | $113,400 | $86,700 |
| Median Household Income | $62,188 | $124 |
| Monthly Housing Costs | $508 | $2 |
| Real Estate Taxes | $1,235 | $0 |
Property Value by Mortgage Status in Pipestone
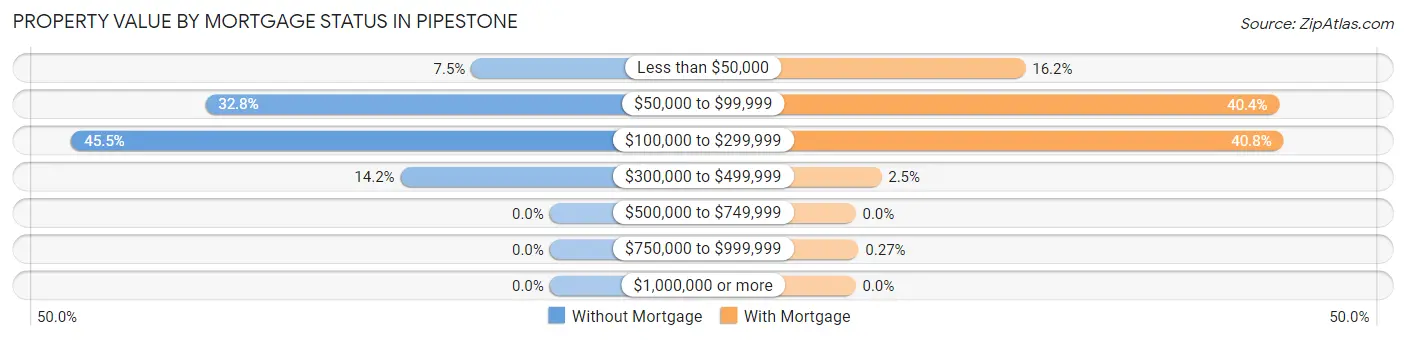
| Property Value | Without Mortgage | With Mortgage |
| Less than $50,000 | 41 (7.5%) | 119 (16.2%) |
| $50,000 to $99,999 | 180 (32.8%) | 297 (40.4%) |
| $100,000 to $299,999 | 250 (45.5%) | 300 (40.8%) |
| $300,000 to $499,999 | 78 (14.2%) | 18 (2.5%) |
| $500,000 to $749,999 | 0 (0.0%) | 0 (0.0%) |
| $750,000 to $999,999 | 0 (0.0%) | 2 (0.3%) |
| $1,000,000 or more | 0 (0.0%) | 0 (0.0%) |
| Total | 549 (100.0%) | 736 (100.0%) |
Household Income by Mortgage Status in Pipestone
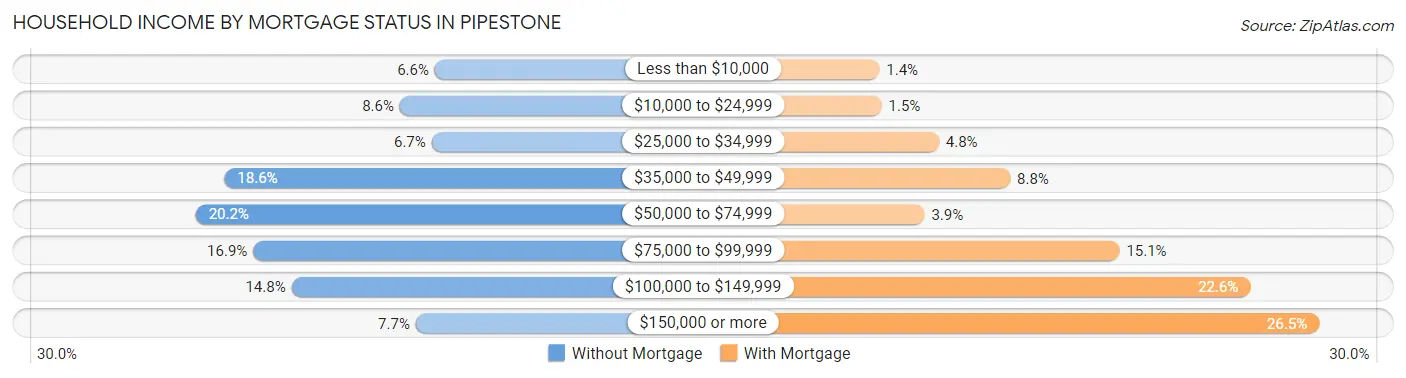
| Household Income | Without Mortgage | With Mortgage |
| Less than $10,000 | 36 (6.6%) | 10 (1.4%) |
| $10,000 to $24,999 | 47 (8.6%) | 11 (1.5%) |
| $25,000 to $34,999 | 37 (6.7%) | 35 (4.8%) |
| $35,000 to $49,999 | 102 (18.6%) | 65 (8.8%) |
| $50,000 to $74,999 | 111 (20.2%) | 29 (3.9%) |
| $75,000 to $99,999 | 93 (16.9%) | 111 (15.1%) |
| $100,000 to $149,999 | 81 (14.7%) | 166 (22.6%) |
| $150,000 or more | 42 (7.6%) | 195 (26.5%) |
| Total | 549 (100.0%) | 736 (100.0%) |
Property Value to Household Income Ratio in Pipestone
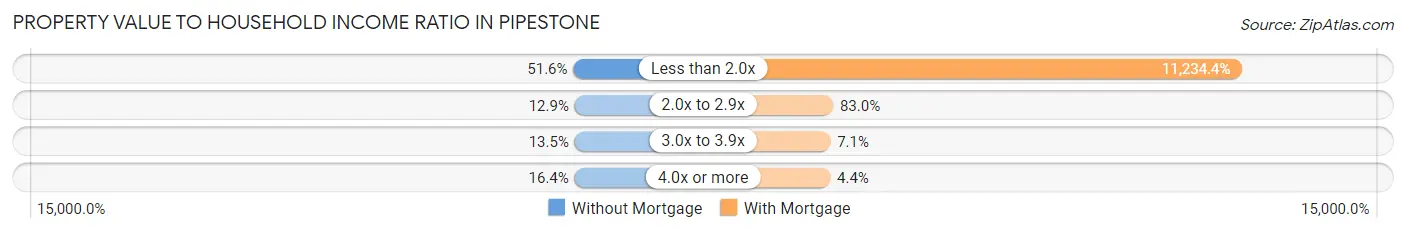
| Value-to-Income Ratio | Without Mortgage | With Mortgage |
| Less than 2.0x | 283 (51.5%) | 82,685 (11,234.4%) |
| 2.0x to 2.9x | 71 (12.9%) | 611 (83.0%) |
| 3.0x to 3.9x | 74 (13.5%) | 52 (7.1%) |
| 4.0x or more | 90 (16.4%) | 32 (4.3%) |
| Total | 549 (100.0%) | 736 (100.0%) |
Real Estate Taxes by Mortgage Status in Pipestone
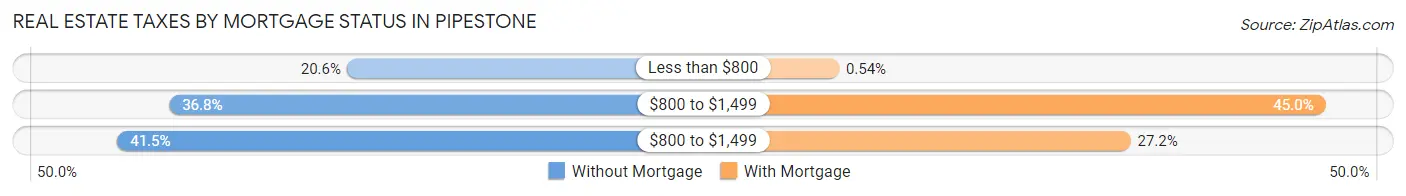
| Property Taxes | Without Mortgage | With Mortgage |
| Less than $800 | 113 (20.6%) | 4 (0.5%) |
| $800 to $1,499 | 202 (36.8%) | 331 (45.0%) |
| $800 to $1,499 | 228 (41.5%) | 200 (27.2%) |
| Total | 549 (100.0%) | 736 (100.0%) |
Health & Disability in Pipestone
Health Insurance Coverage by Age in Pipestone
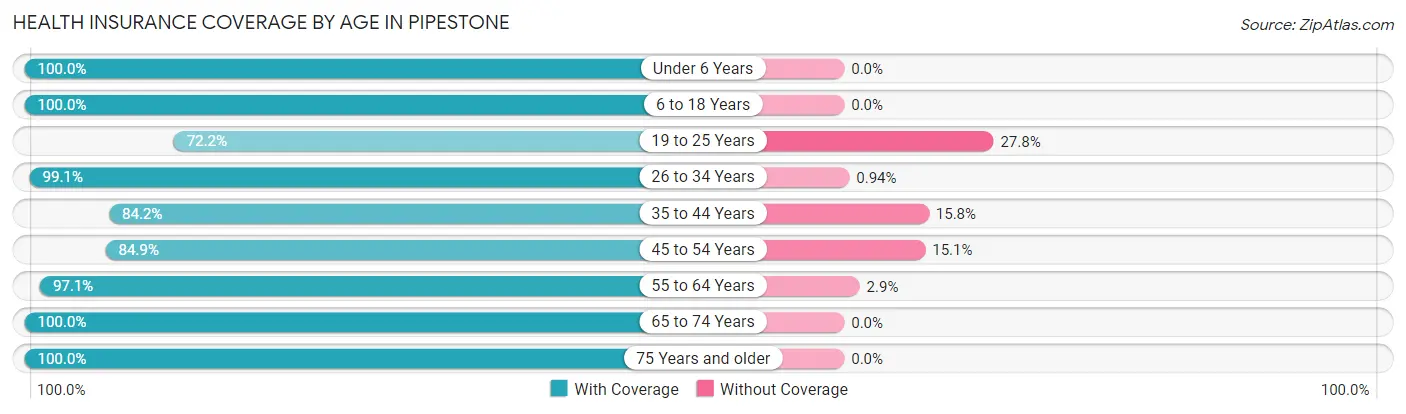
| Age Bracket | With Coverage | Without Coverage |
| Under 6 Years | 398 (100.0%) | 0 (0.0%) |
| 6 to 18 Years | 754 (100.0%) | 0 (0.0%) |
| 19 to 25 Years | 192 (72.2%) | 74 (27.8%) |
| 26 to 34 Years | 421 (99.1%) | 4 (0.9%) |
| 35 to 44 Years | 422 (84.2%) | 79 (15.8%) |
| 45 to 54 Years | 371 (84.9%) | 66 (15.1%) |
| 55 to 64 Years | 473 (97.1%) | 14 (2.9%) |
| 65 to 74 Years | 375 (100.0%) | 0 (0.0%) |
| 75 Years and older | 408 (100.0%) | 0 (0.0%) |
| Total | 3,814 (94.2%) | 237 (5.9%) |
Health Insurance Coverage by Citizenship Status in Pipestone
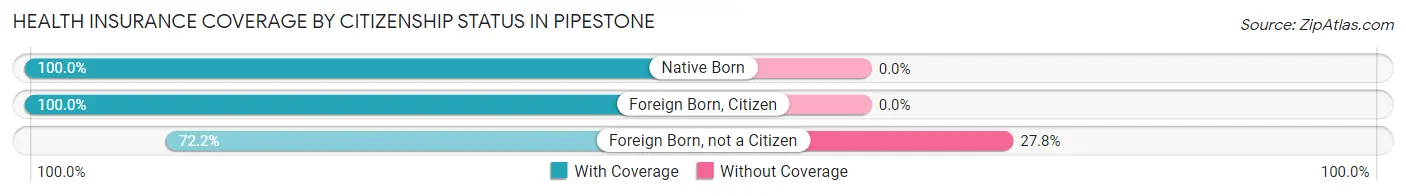
| Citizenship Status | With Coverage | Without Coverage |
| Native Born | 398 (100.0%) | 0 (0.0%) |
| Foreign Born, Citizen | 754 (100.0%) | 0 (0.0%) |
| Foreign Born, not a Citizen | 192 (72.2%) | 74 (27.8%) |
Health Insurance Coverage by Household Income in Pipestone
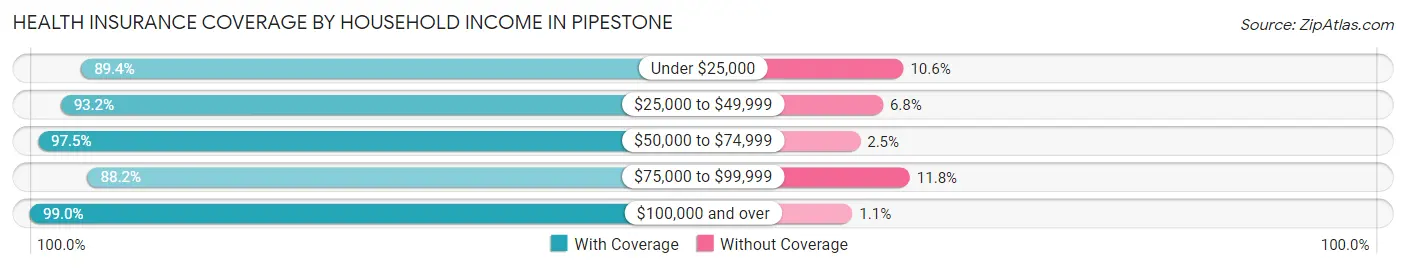
| Household Income | With Coverage | Without Coverage |
| Under $25,000 | 572 (89.4%) | 68 (10.6%) |
| $25,000 to $49,999 | 729 (93.2%) | 53 (6.8%) |
| $50,000 to $74,999 | 424 (97.5%) | 11 (2.5%) |
| $75,000 to $99,999 | 664 (88.2%) | 89 (11.8%) |
| $100,000 and over | 1,411 (99.0%) | 15 (1.1%) |
Public vs Private Health Insurance Coverage by Age in Pipestone
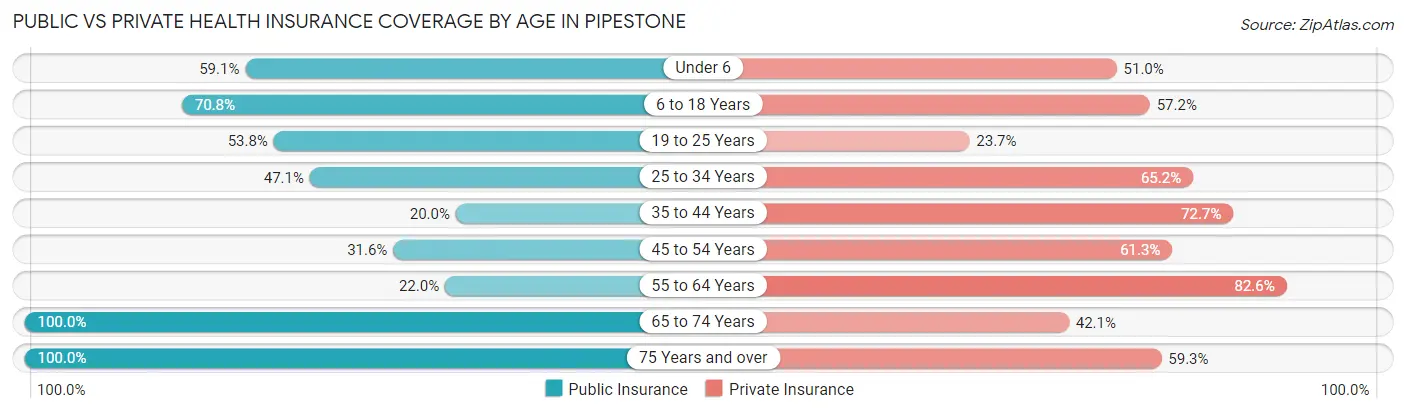
| Age Bracket | Public Insurance | Private Insurance |
| Under 6 | 235 (59.1%) | 203 (51.0%) |
| 6 to 18 Years | 534 (70.8%) | 431 (57.2%) |
| 19 to 25 Years | 143 (53.8%) | 63 (23.7%) |
| 25 to 34 Years | 200 (47.1%) | 277 (65.2%) |
| 35 to 44 Years | 100 (20.0%) | 364 (72.7%) |
| 45 to 54 Years | 138 (31.6%) | 268 (61.3%) |
| 55 to 64 Years | 107 (22.0%) | 402 (82.6%) |
| 65 to 74 Years | 375 (100.0%) | 158 (42.1%) |
| 75 Years and over | 408 (100.0%) | 242 (59.3%) |
| Total | 2,240 (55.3%) | 2,408 (59.4%) |
Disability Status by Sex by Age in Pipestone
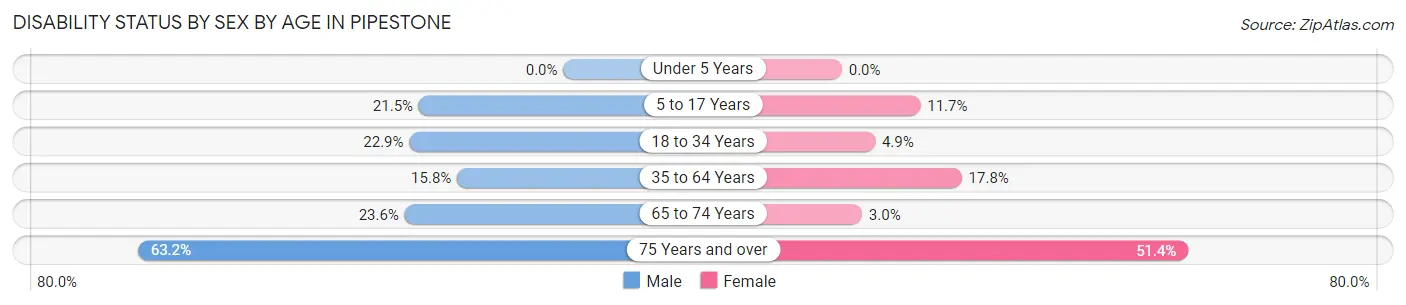
| Age Bracket | Male | Female |
| Under 5 Years | 0 (0.0%) | 0 (0.0%) |
| 5 to 17 Years | 89 (21.4%) | 45 (11.7%) |
| 18 to 34 Years | 78 (22.9%) | 18 (4.9%) |
| 35 to 64 Years | 106 (15.8%) | 134 (17.8%) |
| 65 to 74 Years | 41 (23.6%) | 6 (3.0%) |
| 75 Years and over | 103 (63.2%) | 126 (51.4%) |
Disability Class by Sex by Age in Pipestone
Disability Class: Hearing Difficulty
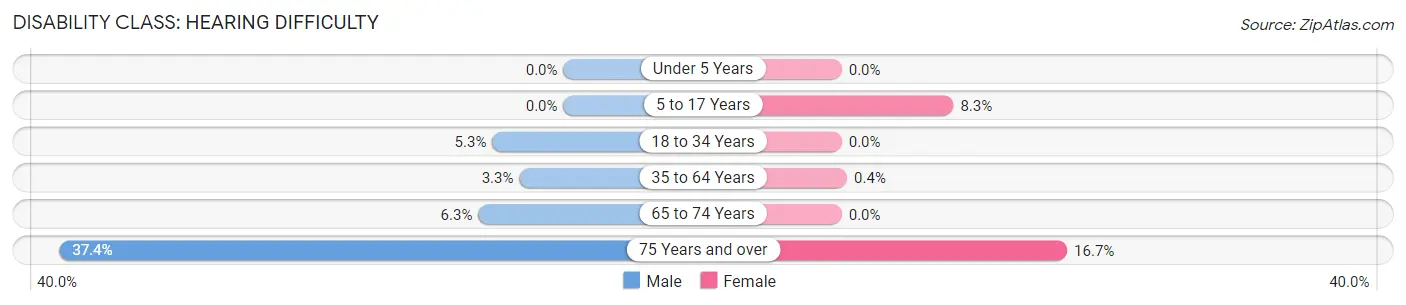
| Age Bracket | Male | Female |
| Under 5 Years | 0 (0.0%) | 0 (0.0%) |
| 5 to 17 Years | 0 (0.0%) | 32 (8.3%) |
| 18 to 34 Years | 18 (5.3%) | 0 (0.0%) |
| 35 to 64 Years | 22 (3.3%) | 3 (0.4%) |
| 65 to 74 Years | 11 (6.3%) | 0 (0.0%) |
| 75 Years and over | 61 (37.4%) | 41 (16.7%) |
Disability Class: Vision Difficulty
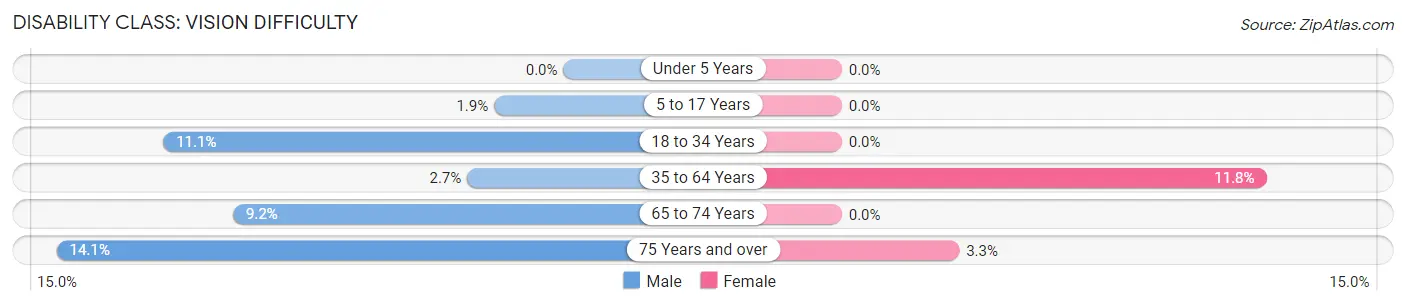
| Age Bracket | Male | Female |
| Under 5 Years | 0 (0.0%) | 0 (0.0%) |
| 5 to 17 Years | 8 (1.9%) | 0 (0.0%) |
| 18 to 34 Years | 38 (11.1%) | 0 (0.0%) |
| 35 to 64 Years | 18 (2.7%) | 89 (11.8%) |
| 65 to 74 Years | 16 (9.2%) | 0 (0.0%) |
| 75 Years and over | 23 (14.1%) | 8 (3.3%) |
Disability Class: Cognitive Difficulty
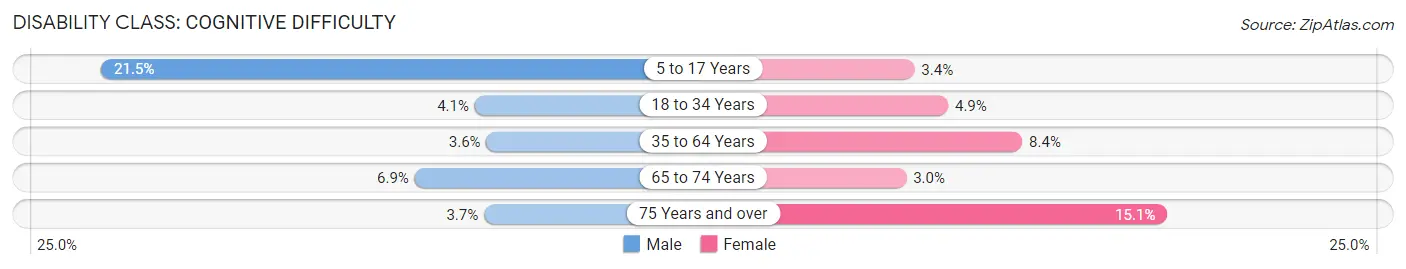
| Age Bracket | Male | Female |
| 5 to 17 Years | 89 (21.4%) | 13 (3.4%) |
| 18 to 34 Years | 14 (4.1%) | 18 (4.9%) |
| 35 to 64 Years | 24 (3.6%) | 63 (8.4%) |
| 65 to 74 Years | 12 (6.9%) | 6 (3.0%) |
| 75 Years and over | 6 (3.7%) | 37 (15.1%) |
Disability Class: Ambulatory Difficulty
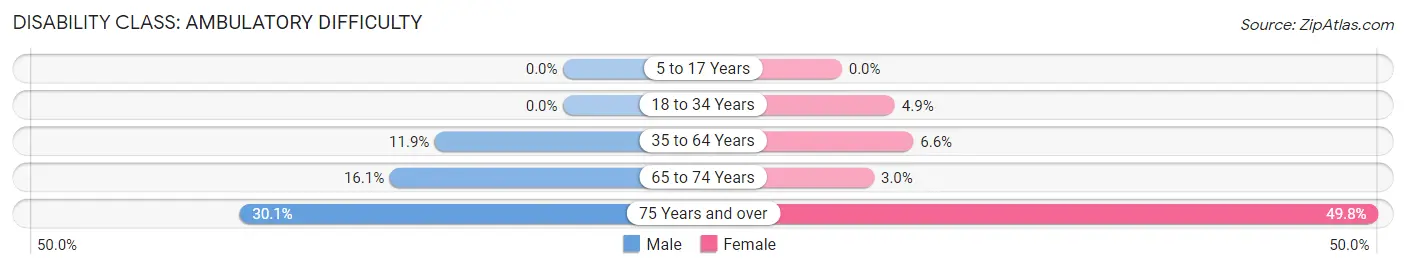
| Age Bracket | Male | Female |
| 5 to 17 Years | 0 (0.0%) | 0 (0.0%) |
| 18 to 34 Years | 0 (0.0%) | 18 (4.9%) |
| 35 to 64 Years | 80 (11.9%) | 50 (6.6%) |
| 65 to 74 Years | 28 (16.1%) | 6 (3.0%) |
| 75 Years and over | 49 (30.1%) | 122 (49.8%) |
Disability Class: Self-Care Difficulty
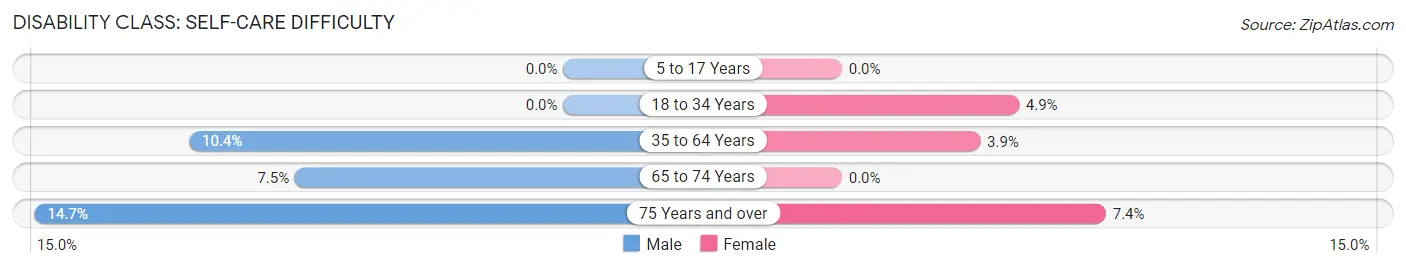
| Age Bracket | Male | Female |
| 5 to 17 Years | 0 (0.0%) | 0 (0.0%) |
| 18 to 34 Years | 0 (0.0%) | 18 (4.9%) |
| 35 to 64 Years | 70 (10.4%) | 29 (3.8%) |
| 65 to 74 Years | 13 (7.5%) | 0 (0.0%) |
| 75 Years and over | 24 (14.7%) | 18 (7.3%) |
Technology Access in Pipestone
Computing Device Access in Pipestone
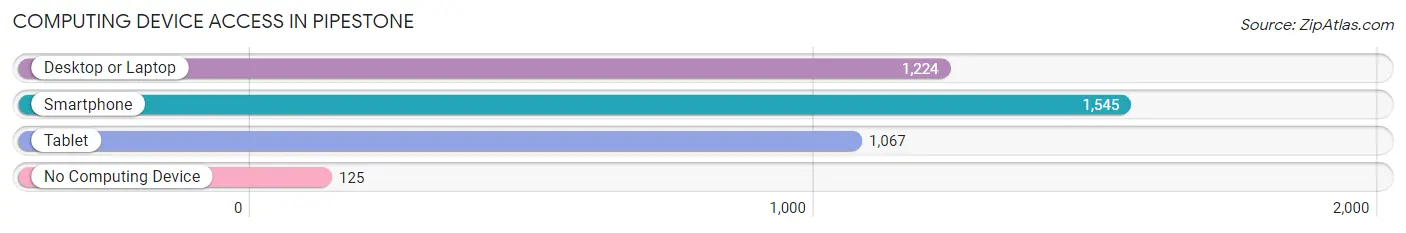
| Device Type | # Households | % Households |
| Desktop or Laptop | 1,224 | 67.4% |
| Smartphone | 1,545 | 85.0% |
| Tablet | 1,067 | 58.7% |
| No Computing Device | 125 | 6.9% |
| Total | 1,817 | 100.0% |
Internet Access in Pipestone
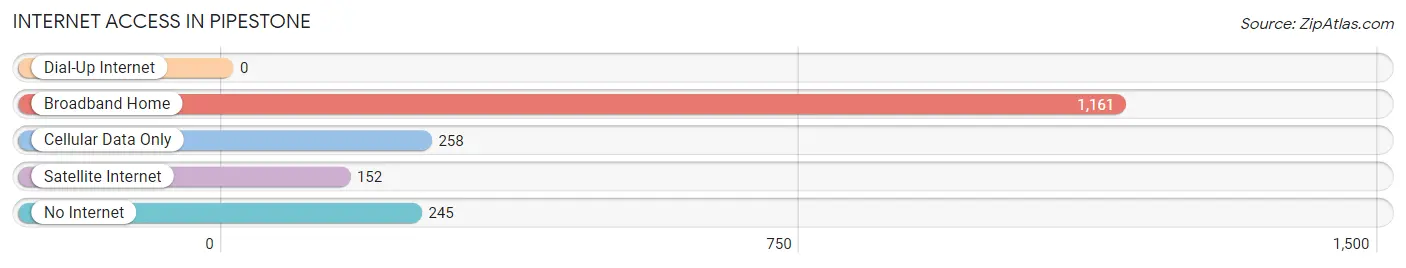
| Internet Type | # Households | % Households |
| Dial-Up Internet | 0 | 0.0% |
| Broadband Home | 1,161 | 63.9% |
| Cellular Data Only | 258 | 14.2% |
| Satellite Internet | 152 | 8.4% |
| No Internet | 245 | 13.5% |
| Total | 1,817 | 100.0% |
Pipestone Summary
Pipestone, Minnesota is a small city located in southwestern Minnesota, in Pipestone County. It is situated on the banks of the Pipestone Creek, and is the county seat of Pipestone County. The city has a population of 4,317, according to the 2010 census.
History
The area that is now Pipestone was first settled in 1871 by a group of settlers from Wisconsin. The city was originally named "Pipestone City" after the nearby Pipestone Creek, which was named for the pipestone quarries located nearby. The quarries were used by Native Americans to make pipes and other ceremonial objects. The city was incorporated in 1881.
In the late 19th century, Pipestone was a major center for the production of bricks and tile. The city was also home to a number of flour mills, and was a major shipping point for grain and livestock.
Geography
Pipestone is located in southwestern Minnesota, in Pipestone County. It is situated on the banks of the Pipestone Creek, and is the county seat of Pipestone County. The city has a total area of 2.2 square miles, all of which is land.
The city is located in the Prairie Coteau region of Minnesota, and is surrounded by rolling hills and prairies. The city is located approximately 50 miles from Sioux Falls, South Dakota, and is about a two-hour drive from Minneapolis.
Economy
Pipestone's economy is largely based on agriculture. The city is home to a number of farms, and is a major producer of corn, soybeans, and other crops. The city is also home to a number of manufacturing companies, including a tile and brick factory, a flour mill, and a feed mill.
The city is also home to a number of retail stores, restaurants, and other businesses. The city is home to a number of tourist attractions, including the Pipestone National Monument, which is a National Historic Landmark.
Demographics
According to the 2010 census, Pipestone has a population of 4,317. The racial makeup of the city is 94.3% White, 0.7% African American, 0.3% Native American, 0.2% Asian, 0.1% Pacific Islander, 2.7% from other races, and 1.9% from two or more races. Hispanic or Latino of any race were 4.3% of the population.
The median household income in Pipestone is $41,944, and the median family income is $50,938. The per capita income in Pipestone is $20,845. About 11.3% of families and 14.2% of the population are below the poverty line.
Pipestone is served by the Pipestone Area School District, which includes two elementary schools, one middle school, and one high school. The city is also home to a number of churches, including the First Presbyterian Church, the First Lutheran Church, and the First United Methodist Church.
Common Questions
What is Per Capita Income in Pipestone?
Per Capita income in Pipestone is $33,725.
What is the Median Family Income in Pipestone?
Median Family Income in Pipestone is $77,828.
What is the Median Household income in Pipestone?
Median Household Income in Pipestone is $65,144.
What is Income or Wage Gap in Pipestone?
Income or Wage Gap in Pipestone is 54.8%.
Women in Pipestone earn 45.2 cents for every dollar earned by a man.
What is Inequality or Gini Index in Pipestone?
Inequality or Gini Index in Pipestone is 0.43.
What is the Total Population of Pipestone?
Total Population of Pipestone is 4,171.
What is the Total Male Population of Pipestone?
Total Male Population of Pipestone is 1,965.
What is the Total Female Population of Pipestone?
Total Female Population of Pipestone is 2,206.
What is the Ratio of Males per 100 Females in Pipestone?
There are 89.08 Males per 100 Females in Pipestone.
What is the Ratio of Females per 100 Males in Pipestone?
There are 112.26 Females per 100 Males in Pipestone.
What is the Median Population Age in Pipestone?
Median Population Age in Pipestone is 39.2 Years.
What is the Average Family Size in Pipestone
Average Family Size in Pipestone is 3.0 People.
What is the Average Household Size in Pipestone
Average Household Size in Pipestone is 2.2 People.
How Large is the Labor Force in Pipestone?
There are 1,939 People in the Labor Forcein in Pipestone.
What is the Percentage of People in the Labor Force in Pipestone?
60.5% of People are in the Labor Force in Pipestone.
What is the Unemployment Rate in Pipestone?
Unemployment Rate in Pipestone is 4.0%.