Lindstrom, MN Map & Demographics
Lindstrom Map
Lindstrom Overview
$41,792
PER CAPITA INCOME
$124,508
AVG FAMILY INCOME
$98,456
AVG HOUSEHOLD INCOME
32.3%
WAGE / INCOME GAP [ % ]
67.7¢/ $1
WAGE / INCOME GAP [ $ ]
0.36
INEQUALITY / GINI INDEX
4,891
TOTAL POPULATION
2,520
MALE POPULATION
2,371
FEMALE POPULATION
106.28
MALES / 100 FEMALES
94.09
FEMALES / 100 MALES
37.4
MEDIAN AGE
3.1
AVG FAMILY SIZE
2.7
AVG HOUSEHOLD SIZE
2,726
LABOR FORCE [ PEOPLE ]
71.9%
PERCENT IN LABOR FORCE
2.8%
UNEMPLOYMENT RATE
Lindstrom Zip Codes
Lindstrom Area Codes
Income in Lindstrom
Income Overview in Lindstrom
Per Capita Income in Lindstrom is $41,792, while median incomes of families and households are $124,508 and $98,456 respectively.
| Characteristic | Number | Measure |
| Per Capita Income | 4,891 | $41,792 |
| Median Family Income | 1,337 | $124,508 |
| Mean Family Income | 1,337 | $129,531 |
| Median Household Income | 1,809 | $98,456 |
| Mean Household Income | 1,809 | $114,547 |
| Income Deficit | 1,337 | $0 |
| Wage / Income Gap (%) | 4,891 | 32.33% |
| Wage / Income Gap ($) | 4,891 | 67.67¢ per $1 |
| Gini / Inequality Index | 4,891 | 0.36 |
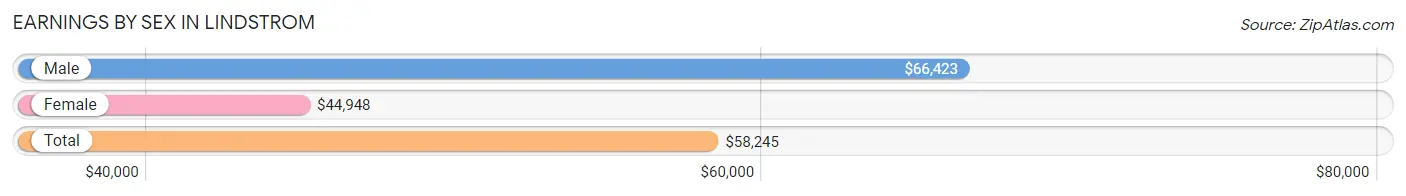
Earnings by Sex in Lindstrom
Average Earnings in Lindstrom are $58,245, $66,423 for men and $44,948 for women, a difference of 32.3%.
| Sex | Number | Average Earnings |
| Male | 1,550 (56.2%) | $66,423 |
| Female | 1,208 (43.8%) | $44,948 |
| Total | 2,758 (100.0%) | $58,245 |
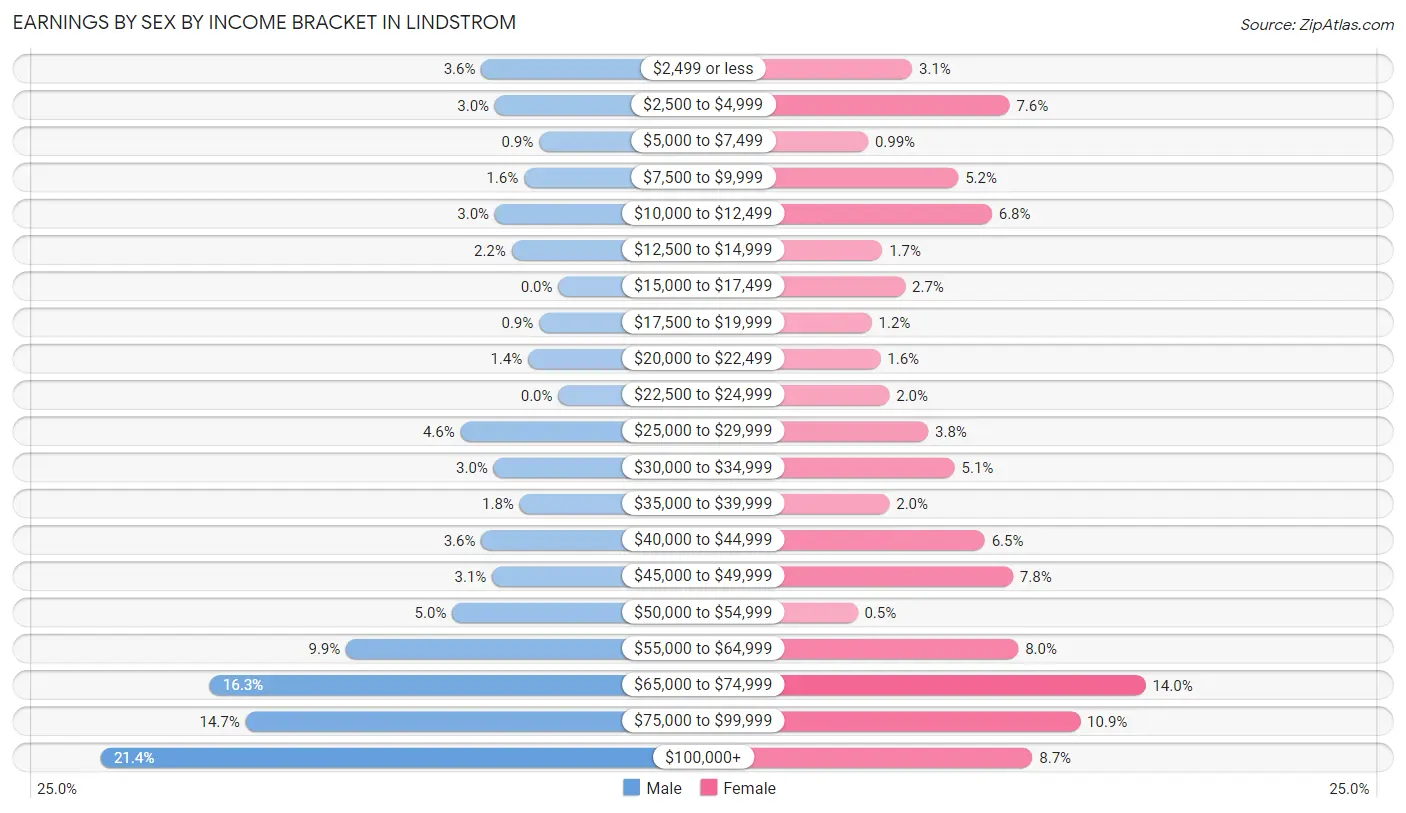
Earnings by Sex by Income Bracket in Lindstrom
The most common earnings brackets in Lindstrom are $100,000+ for men (332 | 21.4%) and $65,000 to $74,999 for women (169 | 14.0%).
| Income | Male | Female |
| $2,499 or less | 56 (3.6%) | 37 (3.1%) |
| $2,500 to $4,999 | 46 (3.0%) | 92 (7.6%) |
| $5,000 to $7,499 | 14 (0.9%) | 12 (1.0%) |
| $7,500 to $9,999 | 25 (1.6%) | 63 (5.2%) |
| $10,000 to $12,499 | 46 (3.0%) | 82 (6.8%) |
| $12,500 to $14,999 | 34 (2.2%) | 20 (1.7%) |
| $15,000 to $17,499 | 0 (0.0%) | 33 (2.7%) |
| $17,500 to $19,999 | 14 (0.9%) | 14 (1.2%) |
| $20,000 to $22,499 | 22 (1.4%) | 19 (1.6%) |
| $22,500 to $24,999 | 0 (0.0%) | 24 (2.0%) |
| $25,000 to $29,999 | 71 (4.6%) | 46 (3.8%) |
| $30,000 to $34,999 | 47 (3.0%) | 61 (5.1%) |
| $35,000 to $39,999 | 28 (1.8%) | 24 (2.0%) |
| $40,000 to $44,999 | 56 (3.6%) | 78 (6.5%) |
| $45,000 to $49,999 | 48 (3.1%) | 94 (7.8%) |
| $50,000 to $54,999 | 77 (5.0%) | 6 (0.5%) |
| $55,000 to $64,999 | 154 (9.9%) | 97 (8.0%) |
| $65,000 to $74,999 | 253 (16.3%) | 169 (14.0%) |
| $75,000 to $99,999 | 227 (14.6%) | 132 (10.9%) |
| $100,000+ | 332 (21.4%) | 105 (8.7%) |
| Total | 1,550 (100.0%) | 1,208 (100.0%) |
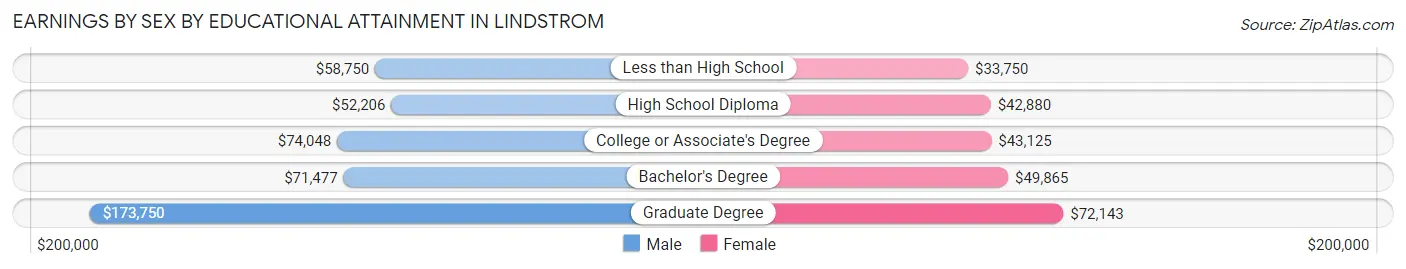
Earnings by Sex by Educational Attainment in Lindstrom
Average earnings in Lindstrom are $72,889 for men and $48,733 for women, a difference of 33.1%. Men with an educational attainment of graduate degree enjoy the highest average annual earnings of $173,750, while those with high school diploma education earn the least with $52,206. Women with an educational attainment of graduate degree earn the most with the average annual earnings of $72,143, while those with less than high school education have the smallest earnings of $33,750.
| Educational Attainment | Male Income | Female Income |
| Less than High School | $58,750 | $33,750 |
| High School Diploma | $52,206 | $42,880 |
| College or Associate's Degree | $74,048 | $43,125 |
| Bachelor's Degree | $71,477 | $49,865 |
| Graduate Degree | $173,750 | $72,143 |
| Total | $72,889 | $48,733 |
Family Income in Lindstrom
Family Income Brackets in Lindstrom
According to the Lindstrom family income data, there are 305 families falling into the $100,000 to $149,999 income range, which is the most common income bracket and makes up 22.8% of all families.
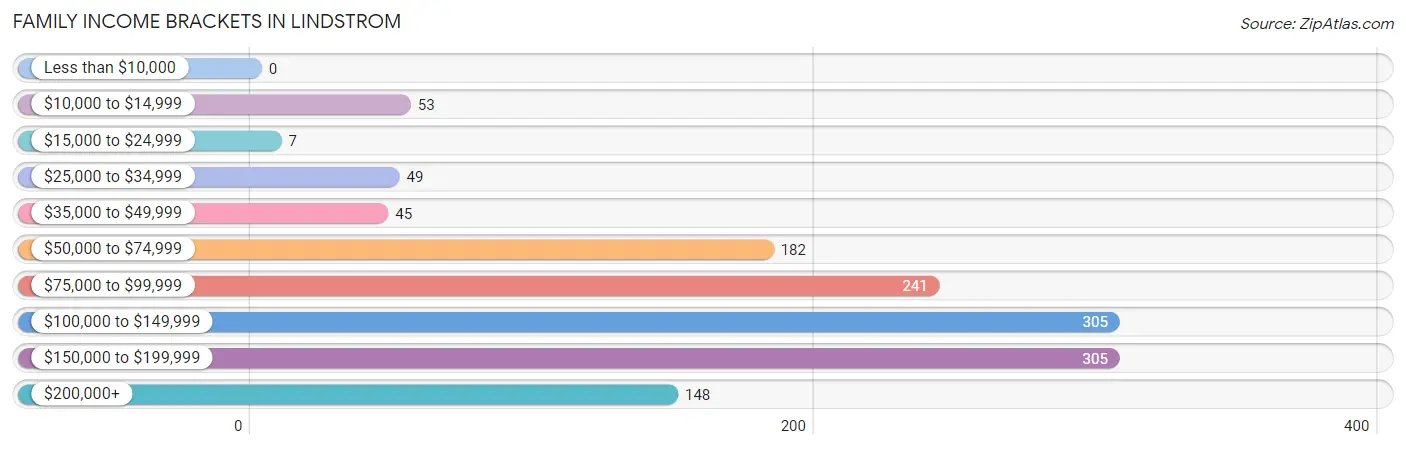
| Income Bracket | # Families | % Families |
| Less than $10,000 | 0 | 0.0% |
| $10,000 to $14,999 | 53 | 4.0% |
| $15,000 to $24,999 | 7 | 0.5% |
| $25,000 to $34,999 | 49 | 3.7% |
| $35,000 to $49,999 | 45 | 3.4% |
| $50,000 to $74,999 | 182 | 13.6% |
| $75,000 to $99,999 | 241 | 18.0% |
| $100,000 to $149,999 | 305 | 22.8% |
| $150,000 to $199,999 | 305 | 22.8% |
| $200,000+ | 148 | 11.1% |
Family Income by Famaliy Size in Lindstrom
4-person families (311 | 23.3%) account for the highest median family income in Lindstrom with $143,705 per family, while 2-person families (585 | 43.8%) have the highest median income of $42,662 per family member.
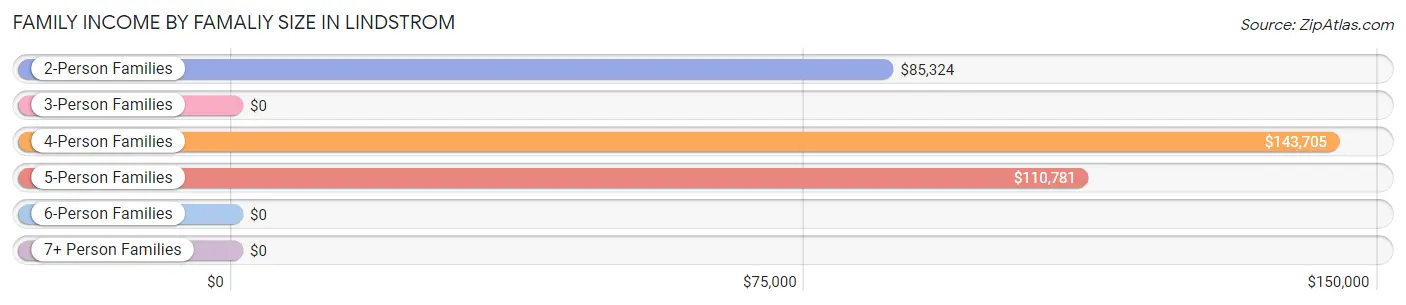
| Income Bracket | # Families | Median Income |
| 2-Person Families | 585 (43.8%) | $85,324 |
| 3-Person Families | 181 (13.5%) | $0 |
| 4-Person Families | 311 (23.3%) | $143,705 |
| 5-Person Families | 151 (11.3%) | $110,781 |
| 6-Person Families | 109 (8.2%) | $0 |
| 7+ Person Families | 0 (0.0%) | $0 |
| Total | 1,337 (100.0%) | $124,508 |
Family Income by Number of Earners in Lindstrom
The median family income in Lindstrom is $124,508, with families comprising 3+ earners (212) having the highest median family income of $156,034, while families with no earners (93) have the lowest median family income of $63,068, accounting for 15.9% and 7.0% of families, respectively.
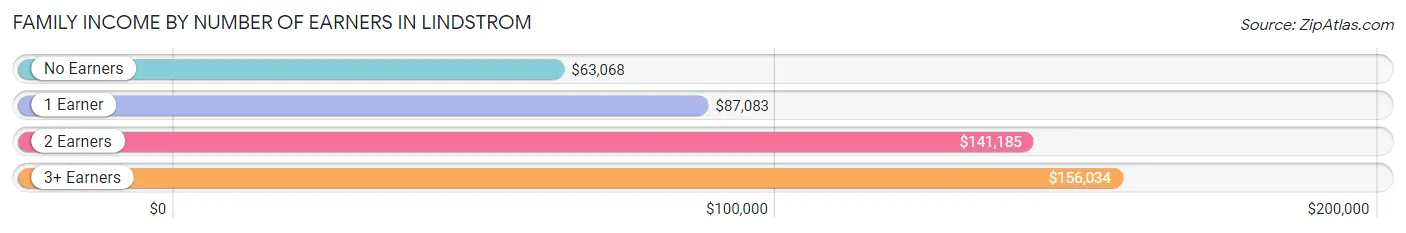
| Number of Earners | # Families | Median Income |
| No Earners | 93 (7.0%) | $63,068 |
| 1 Earner | 417 (31.2%) | $87,083 |
| 2 Earners | 615 (46.0%) | $141,185 |
| 3+ Earners | 212 (15.9%) | $156,034 |
| Total | 1,337 (100.0%) | $124,508 |
Household Income in Lindstrom
Household Income Brackets in Lindstrom
With 423 households falling in the category, the $100,000 to $149,999 income range is the most frequent in Lindstrom, accounting for 23.4% of all households. In contrast, only 22 households (1.2%) fall into the less than $10,000 income bracket, making it the least populous group.
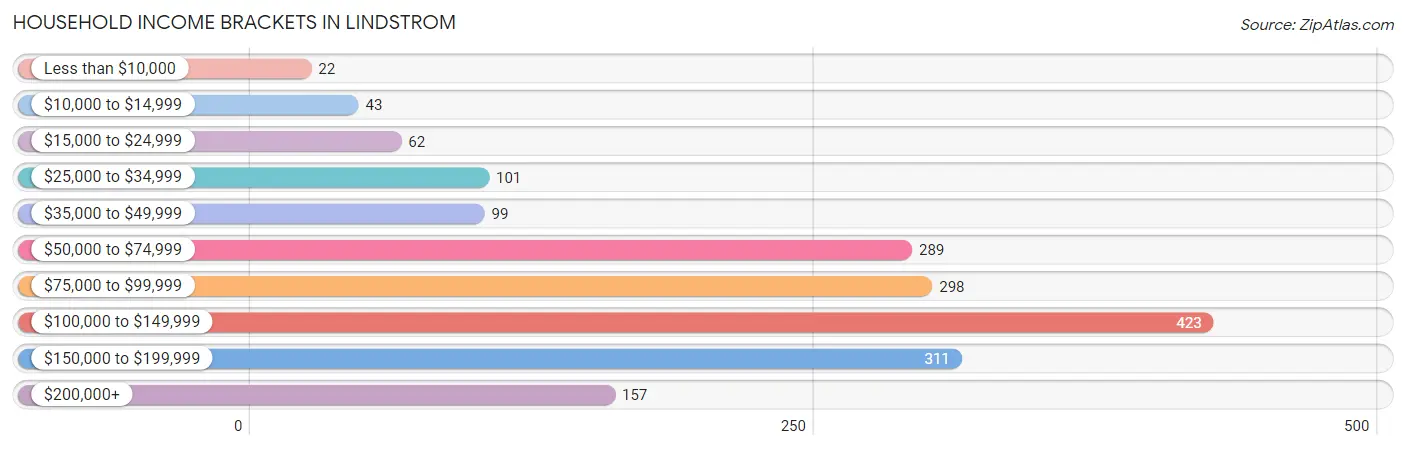
| Income Bracket | # Households | % Households |
| Less than $10,000 | 22 | 1.2% |
| $10,000 to $14,999 | 43 | 2.4% |
| $15,000 to $24,999 | 62 | 3.4% |
| $25,000 to $34,999 | 101 | 5.6% |
| $35,000 to $49,999 | 99 | 5.5% |
| $50,000 to $74,999 | 289 | 16.0% |
| $75,000 to $99,999 | 298 | 16.5% |
| $100,000 to $149,999 | 423 | 23.4% |
| $150,000 to $199,999 | 311 | 17.2% |
| $200,000+ | 157 | 8.7% |
Household Income by Householder Age in Lindstrom
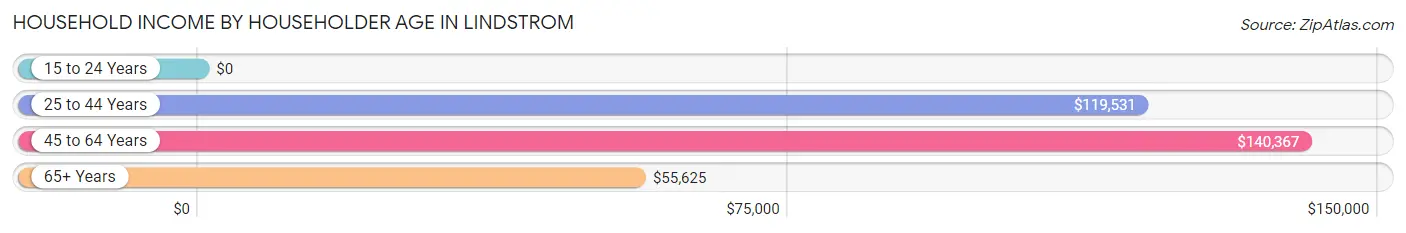
The median household income in Lindstrom is $98,456, with the highest median household income of $140,367 found in the 45 to 64 years age bracket for the primary householder. A total of 796 households (44.0%) fall into this category. Meanwhile, the 15 to 24 years age bracket for the primary householder has the lowest median household income of $0, with 8 households (0.4%) in this group.
| Income Bracket | # Households | Median Income |
| 15 to 24 Years | 8 (0.4%) | $0 |
| 25 to 44 Years | 571 (31.6%) | $119,531 |
| 45 to 64 Years | 796 (44.0%) | $140,367 |
| 65+ Years | 434 (24.0%) | $55,625 |
| Total | 1,809 (100.0%) | $98,456 |
Poverty in Lindstrom
Income Below Poverty by Sex and Age in Lindstrom
With 3.5% poverty level for males and 7.8% for females among the residents of Lindstrom, under 5 year old males and 75 year old and over females are the most vulnerable to poverty, with 23 males (15.3%) and 27 females (21.8%) in their respective age groups living below the poverty level.
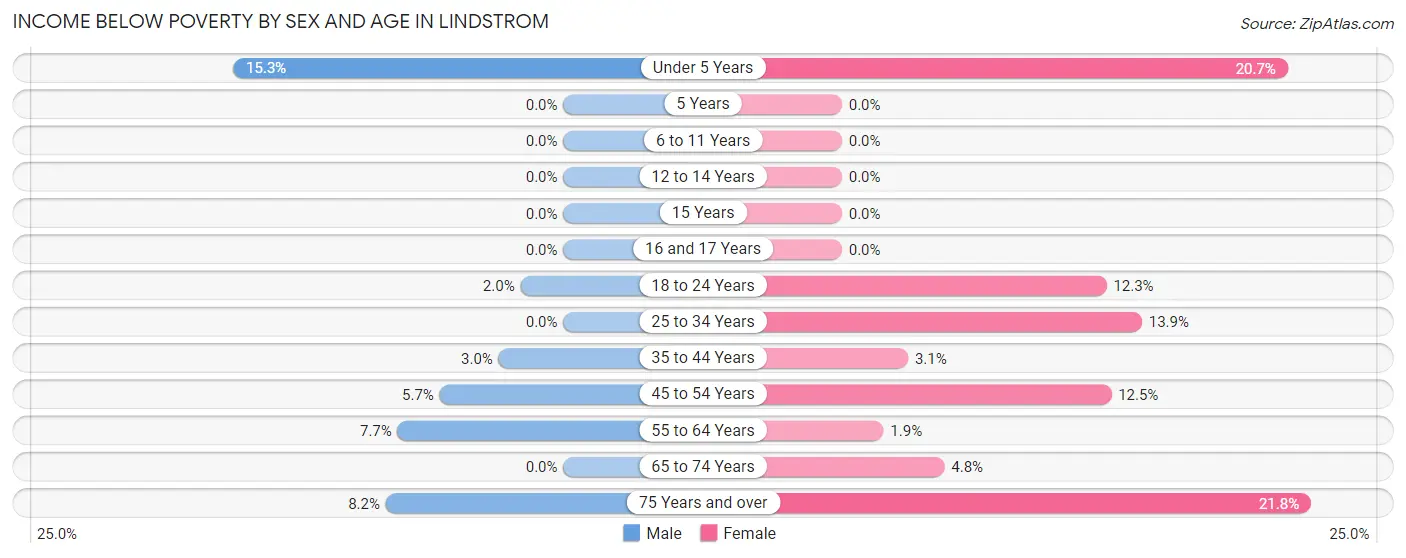
| Age Bracket | Male | Female |
| Under 5 Years | 23 (15.3%) | 42 (20.7%) |
| 5 Years | 0 (0.0%) | 0 (0.0%) |
| 6 to 11 Years | 0 (0.0%) | 0 (0.0%) |
| 12 to 14 Years | 0 (0.0%) | 0 (0.0%) |
| 15 Years | 0 (0.0%) | 0 (0.0%) |
| 16 and 17 Years | 0 (0.0%) | 0 (0.0%) |
| 18 to 24 Years | 3 (2.0%) | 14 (12.3%) |
| 25 to 34 Years | 0 (0.0%) | 43 (13.9%) |
| 35 to 44 Years | 9 (3.0%) | 10 (3.1%) |
| 45 to 54 Years | 19 (5.7%) | 31 (12.5%) |
| 55 to 64 Years | 26 (7.7%) | 7 (1.9%) |
| 65 to 74 Years | 0 (0.0%) | 10 (4.8%) |
| 75 Years and over | 7 (8.2%) | 27 (21.8%) |
| Total | 87 (3.5%) | 184 (7.8%) |
Income Above Poverty by Sex and Age in Lindstrom
According to the poverty statistics in Lindstrom, males aged 5 years and females aged 5 years are the age groups that are most secure financially, with 100.0% of males and 100.0% of females in these age groups living above the poverty line.
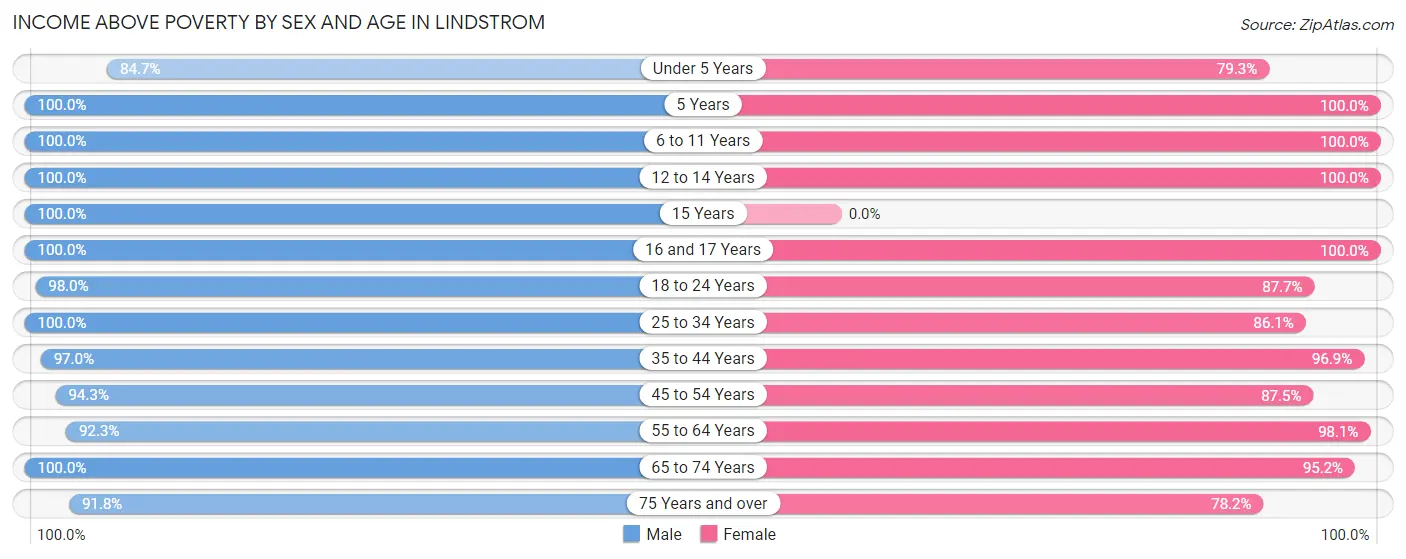
| Age Bracket | Male | Female |
| Under 5 Years | 127 (84.7%) | 161 (79.3%) |
| 5 Years | 14 (100.0%) | 20 (100.0%) |
| 6 to 11 Years | 244 (100.0%) | 33 (100.0%) |
| 12 to 14 Years | 125 (100.0%) | 250 (100.0%) |
| 15 Years | 27 (100.0%) | 0 (0.0%) |
| 16 and 17 Years | 153 (100.0%) | 148 (100.0%) |
| 18 to 24 Years | 148 (98.0%) | 100 (87.7%) |
| 25 to 34 Years | 341 (100.0%) | 266 (86.1%) |
| 35 to 44 Years | 291 (97.0%) | 316 (96.9%) |
| 45 to 54 Years | 312 (94.3%) | 217 (87.5%) |
| 55 to 64 Years | 312 (92.3%) | 355 (98.1%) |
| 65 to 74 Years | 251 (100.0%) | 200 (95.2%) |
| 75 Years and over | 78 (91.8%) | 97 (78.2%) |
| Total | 2,423 (96.5%) | 2,163 (92.2%) |
Income Below Poverty Among Married-Couple Families in Lindstrom
The poverty statistics for married-couple families in Lindstrom show that 0.6% or 7 of the total 1,118 families live below the poverty line. Families with no children have the highest poverty rate of 1.3%, comprising of 7 families. On the other hand, families with 1 or 2 children have the lowest poverty rate of 0.0%, which includes 0 families.
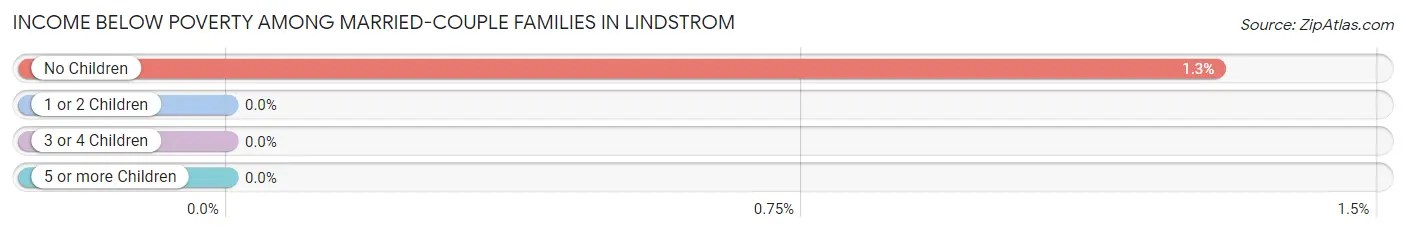
| Children | Above Poverty | Below Poverty |
| No Children | 537 (98.7%) | 7 (1.3%) |
| 1 or 2 Children | 358 (100.0%) | 0 (0.0%) |
| 3 or 4 Children | 216 (100.0%) | 0 (0.0%) |
| 5 or more Children | 0 (0.0%) | 0 (0.0%) |
| Total | 1,111 (99.4%) | 7 (0.6%) |
Income Below Poverty Among Single-Parent Households in Lindstrom
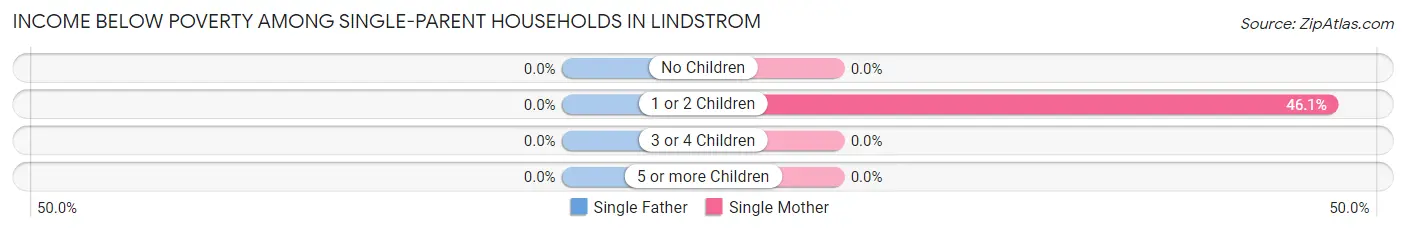
| Children | Single Father | Single Mother |
| No Children | 0 (0.0%) | 0 (0.0%) |
| 1 or 2 Children | 0 (0.0%) | 53 (46.1%) |
| 3 or 4 Children | 0 (0.0%) | 0 (0.0%) |
| 5 or more Children | 0 (0.0%) | 0 (0.0%) |
| Total | 0 (0.0%) | 53 (38.7%) |
Income Below Poverty Among Married-Couple vs Single-Parent Households in Lindstrom
The poverty data for Lindstrom shows that 7 of the married-couple family households (0.6%) and 53 of the single-parent households (24.2%) are living below the poverty level. Within the married-couple family households, those with no children have the highest poverty rate, with 7 households (1.3%) falling below the poverty line. Among the single-parent households, those with 1 or 2 children have the highest poverty rate, with 53 household (36.0%) living below poverty.
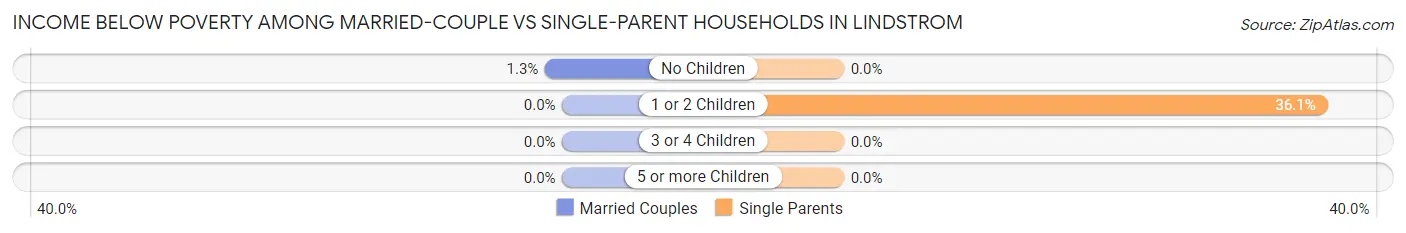
| Children | Married-Couple Families | Single-Parent Households |
| No Children | 7 (1.3%) | 0 (0.0%) |
| 1 or 2 Children | 0 (0.0%) | 53 (36.0%) |
| 3 or 4 Children | 0 (0.0%) | 0 (0.0%) |
| 5 or more Children | 0 (0.0%) | 0 (0.0%) |
| Total | 7 (0.6%) | 53 (24.2%) |
Race in Lindstrom
The most populous races in Lindstrom are White / Caucasian (4,574 | 93.5%), Two or more Races (236 | 4.8%), and Hispanic or Latino (159 | 3.3%).
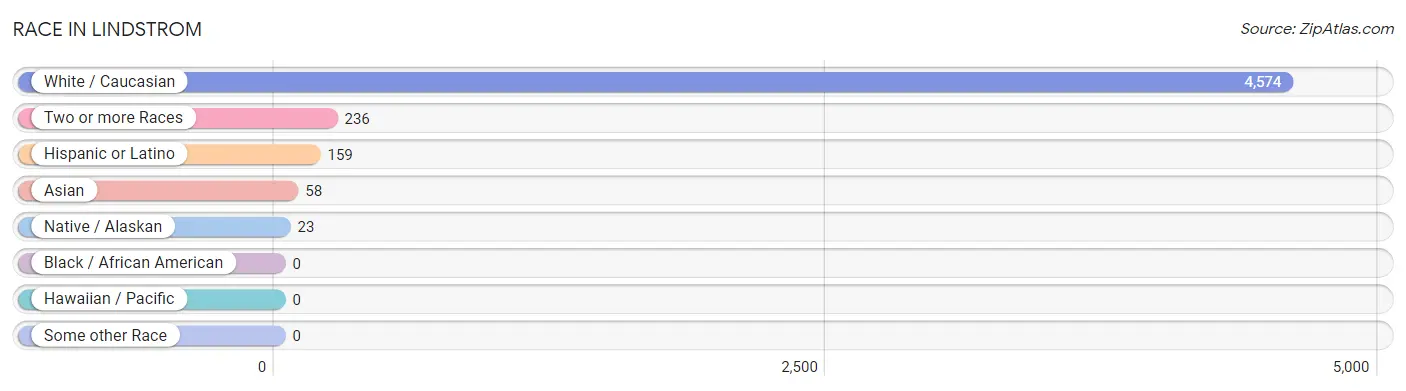
| Race | # Population | % Population |
| Asian | 58 | 1.2% |
| Black / African American | 0 | 0.0% |
| Hawaiian / Pacific | 0 | 0.0% |
| Hispanic or Latino | 159 | 3.3% |
| Native / Alaskan | 23 | 0.5% |
| White / Caucasian | 4,574 | 93.5% |
| Two or more Races | 236 | 4.8% |
| Some other Race | 0 | 0.0% |
| Total | 4,891 | 100.0% |
Ancestry in Lindstrom
The most populous ancestries reported in Lindstrom are German (1,968 | 40.2%), Norwegian (1,068 | 21.8%), Swedish (990 | 20.2%), Irish (555 | 11.4%), and Polish (352 | 7.2%), together accounting for 100.9% of all Lindstrom residents.
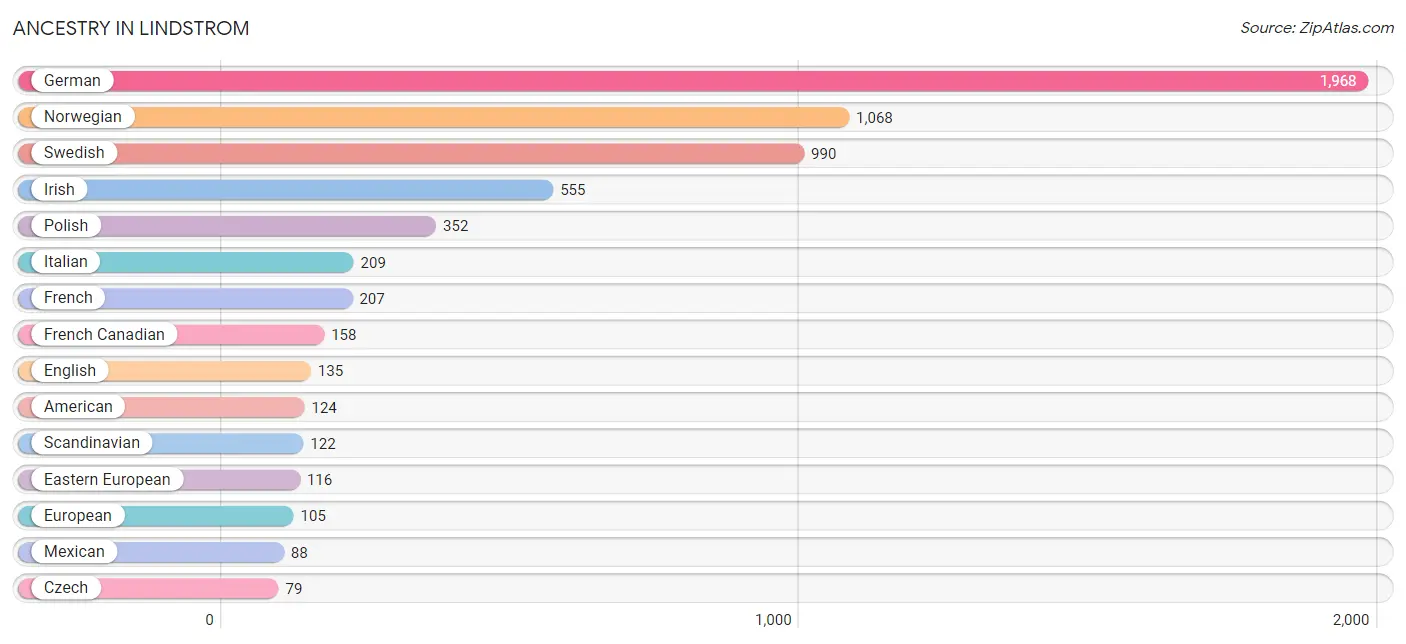
| Ancestry | # Population | % Population |
| American | 124 | 2.5% |
| Arab | 6 | 0.1% |
| Austrian | 9 | 0.2% |
| Bangladeshi | 40 | 0.8% |
| British | 6 | 0.1% |
| Central American | 71 | 1.5% |
| Central American Indian | 41 | 0.8% |
| Chippewa | 35 | 0.7% |
| Costa Rican | 17 | 0.4% |
| Czech | 79 | 1.6% |
| Danish | 24 | 0.5% |
| Dutch | 36 | 0.7% |
| Eastern European | 116 | 2.4% |
| English | 135 | 2.8% |
| European | 105 | 2.1% |
| Finnish | 73 | 1.5% |
| French | 207 | 4.2% |
| French Canadian | 158 | 3.2% |
| German | 1,968 | 40.2% |
| Greek | 10 | 0.2% |
| Honduran | 41 | 0.8% |
| Irish | 555 | 11.4% |
| Italian | 209 | 4.3% |
| Jamaican | 17 | 0.4% |
| Korean | 18 | 0.4% |
| Lebanese | 6 | 0.1% |
| Mexican | 88 | 1.8% |
| Nicaraguan | 13 | 0.3% |
| Norwegian | 1,068 | 21.8% |
| Polish | 352 | 7.2% |
| Scandinavian | 122 | 2.5% |
| Scotch-Irish | 13 | 0.3% |
| Scottish | 20 | 0.4% |
| Slovak | 10 | 0.2% |
| Swedish | 990 | 20.2% |
| Ukrainian | 9 | 0.2% |
| Welsh | 35 | 0.7% | View All 37 Rows |
Immigrants in Lindstrom
The most numerous immigrant groups reported in Lindstrom came from Central America (62 | 1.3%), Latin America (62 | 1.3%), Mexico (50 | 1.0%), Asia (24 | 0.5%), and South Eastern Asia (24 | 0.5%), together accounting for 4.5% of all Lindstrom residents.
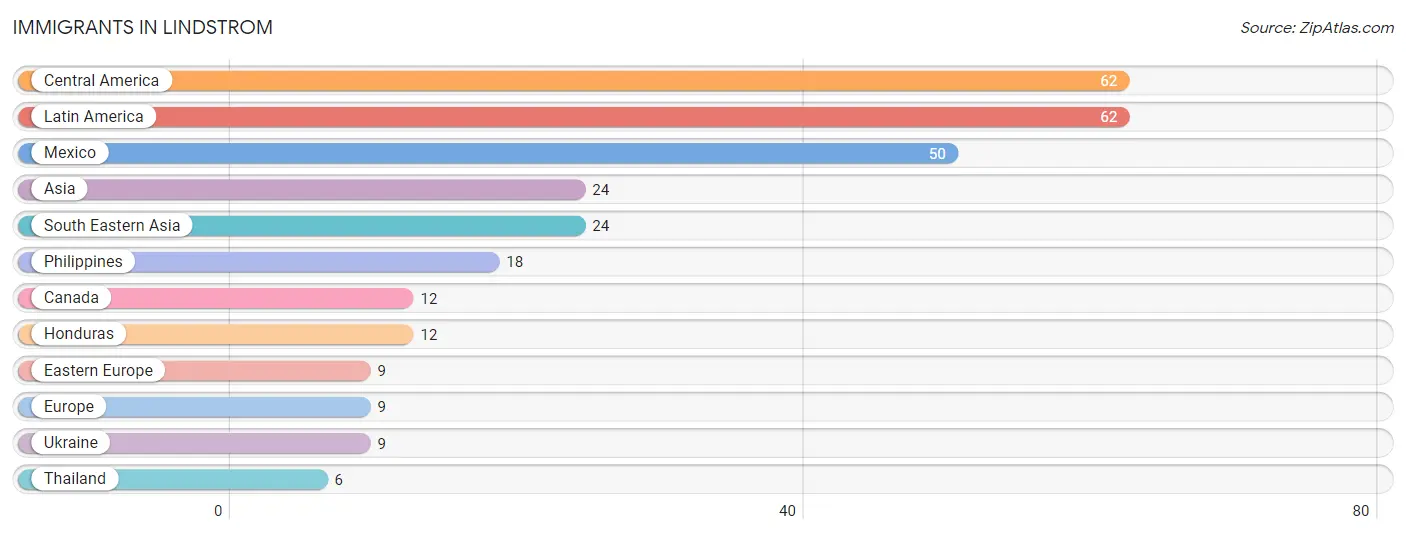
| Immigration Origin | # Population | % Population |
| Asia | 24 | 0.5% |
| Canada | 12 | 0.3% |
| Central America | 62 | 1.3% |
| Eastern Europe | 9 | 0.2% |
| Europe | 9 | 0.2% |
| Honduras | 12 | 0.3% |
| Latin America | 62 | 1.3% |
| Mexico | 50 | 1.0% |
| Philippines | 18 | 0.4% |
| South Eastern Asia | 24 | 0.5% |
| Thailand | 6 | 0.1% |
| Ukraine | 9 | 0.2% | View All 12 Rows |
Sex and Age in Lindstrom
Sex and Age in Lindstrom
The most populous age groups in Lindstrom are 45 to 49 Years (248 | 9.8%) for men and 10 to 14 Years (286 | 12.1%) for women.
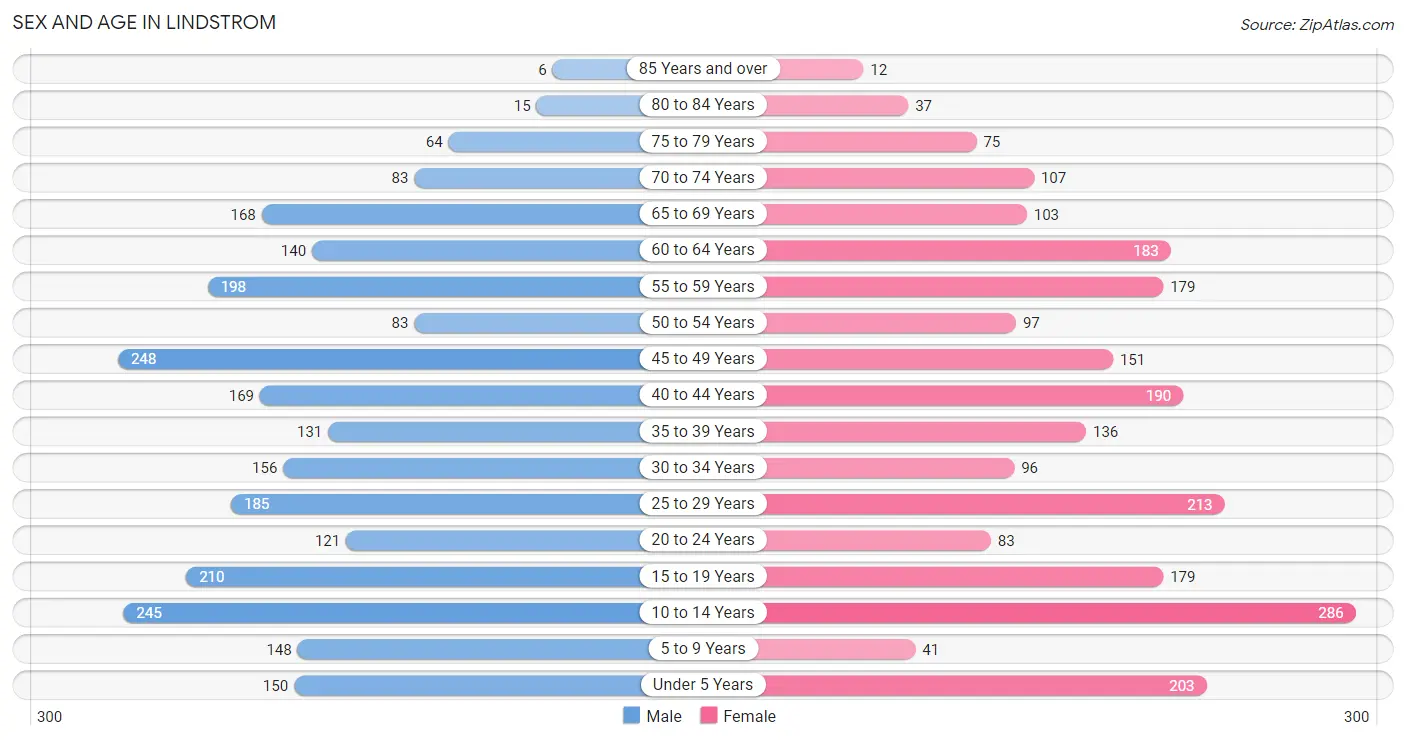
| Age Bracket | Male | Female |
| Under 5 Years | 150 (5.9%) | 203 (8.6%) |
| 5 to 9 Years | 148 (5.9%) | 41 (1.7%) |
| 10 to 14 Years | 245 (9.7%) | 286 (12.1%) |
| 15 to 19 Years | 210 (8.3%) | 179 (7.5%) |
| 20 to 24 Years | 121 (4.8%) | 83 (3.5%) |
| 25 to 29 Years | 185 (7.3%) | 213 (9.0%) |
| 30 to 34 Years | 156 (6.2%) | 96 (4.1%) |
| 35 to 39 Years | 131 (5.2%) | 136 (5.7%) |
| 40 to 44 Years | 169 (6.7%) | 190 (8.0%) |
| 45 to 49 Years | 248 (9.8%) | 151 (6.4%) |
| 50 to 54 Years | 83 (3.3%) | 97 (4.1%) |
| 55 to 59 Years | 198 (7.9%) | 179 (7.5%) |
| 60 to 64 Years | 140 (5.6%) | 183 (7.7%) |
| 65 to 69 Years | 168 (6.7%) | 103 (4.3%) |
| 70 to 74 Years | 83 (3.3%) | 107 (4.5%) |
| 75 to 79 Years | 64 (2.5%) | 75 (3.2%) |
| 80 to 84 Years | 15 (0.6%) | 37 (1.6%) |
| 85 Years and over | 6 (0.2%) | 12 (0.5%) |
| Total | 2,520 (100.0%) | 2,371 (100.0%) |
Families and Households in Lindstrom
Median Family Size in Lindstrom
The median family size in Lindstrom is 3.13 persons per family, with married-couple families (1,118 | 83.6%) accounting for the largest median family size of 3.22 persons per family. On the other hand, single male/father families (82 | 6.1%) represent the smallest median family size with 2.05 persons per family.
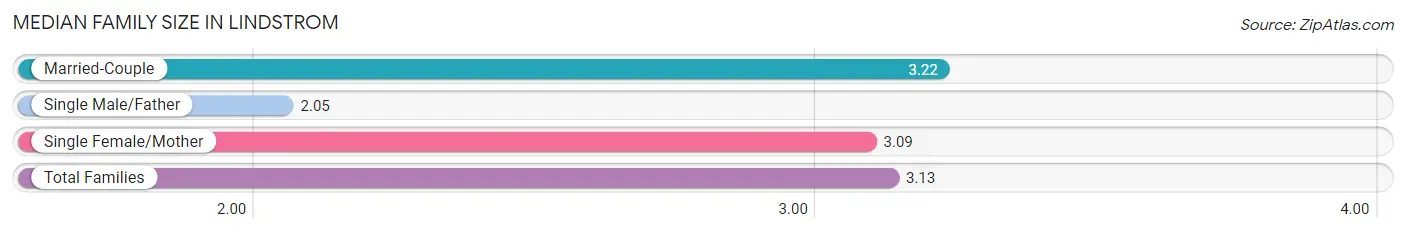
| Family Type | # Families | Family Size |
| Married-Couple | 1,118 (83.6%) | 3.22 |
| Single Male/Father | 82 (6.1%) | 2.05 |
| Single Female/Mother | 137 (10.2%) | 3.09 |
| Total Families | 1,337 (100.0%) | 3.13 |
Median Household Size in Lindstrom
The median household size in Lindstrom is 2.70 persons per household, with single female/mother households (137 | 7.6%) accounting for the largest median household size of 3.56 persons per household. non-family households (472 | 26.1%) represent the smallest median household size with 1.26 persons per household.
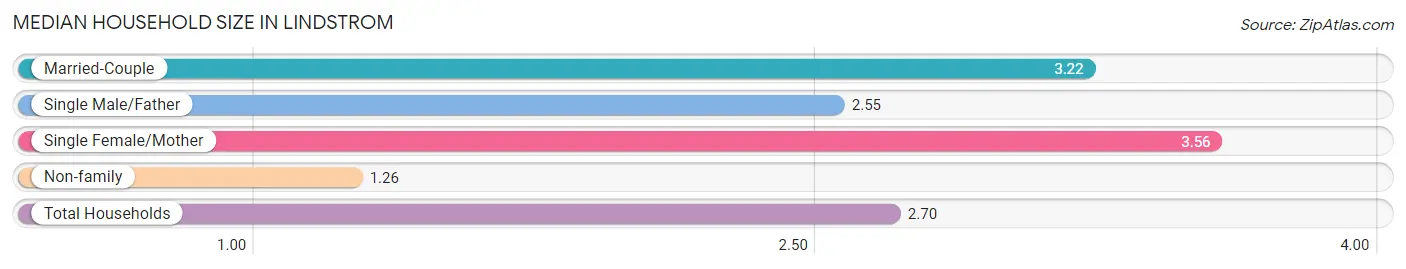
| Household Type | # Households | Household Size |
| Married-Couple | 1,118 (61.8%) | 3.22 |
| Single Male/Father | 82 (4.5%) | 2.55 |
| Single Female/Mother | 137 (7.6%) | 3.56 |
| Non-family | 472 (26.1%) | 1.26 |
| Total Households | 1,809 (100.0%) | 2.70 |
Household Size by Marriage Status in Lindstrom
Out of a total of 1,809 households in Lindstrom, 1,337 (73.9%) are family households, while 472 (26.1%) are nonfamily households. The most numerous type of family households are 2-person households, comprising 532, and the most common type of nonfamily households are 1-person households, comprising 382.
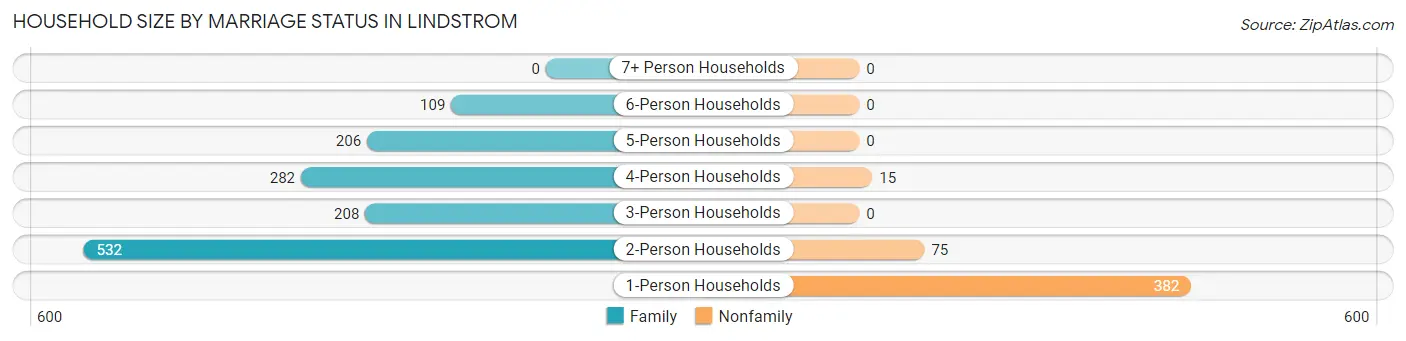
| Household Size | Family Households | Nonfamily Households |
| 1-Person Households | - | 382 (21.1%) |
| 2-Person Households | 532 (29.4%) | 75 (4.2%) |
| 3-Person Households | 208 (11.5%) | 0 (0.0%) |
| 4-Person Households | 282 (15.6%) | 15 (0.8%) |
| 5-Person Households | 206 (11.4%) | 0 (0.0%) |
| 6-Person Households | 109 (6.0%) | 0 (0.0%) |
| 7+ Person Households | 0 (0.0%) | 0 (0.0%) |
| Total | 1,337 (73.9%) | 472 (26.1%) |
Female Fertility in Lindstrom
Fertility by Age in Lindstrom
Average fertility rate in Lindstrom is 61.0 births per 1,000 women. Women in the age bracket of 20 to 34 years have the highest fertility rate with 166.0 births per 1,000 women. Women in the age bracket of 20 to 34 years acount for 100.0% of all women with births.
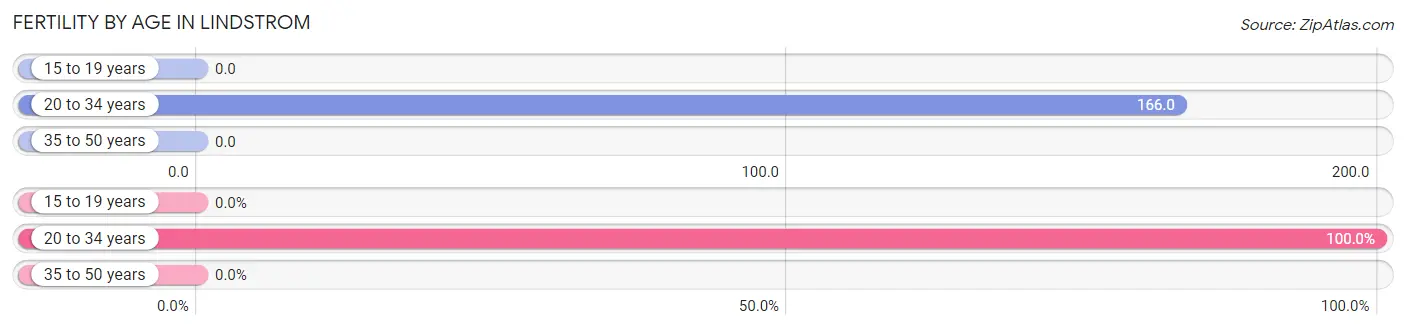
| Age Bracket | Women with Births | Births / 1,000 Women |
| 15 to 19 years | 0 (0.0%) | 0.0 |
| 20 to 34 years | 65 (100.0%) | 166.0 |
| 35 to 50 years | 0 (0.0%) | 0.0 |
| Total | 65 (100.0%) | 61.0 |
Fertility by Age by Marriage Status in Lindstrom
33.8% of women with births (65) in Lindstrom are married. The highest percentage of unmarried women with births falls into 20 to 34 years age bracket with 66.1% of them unmarried at the time of birth, while the lowest percentage of unmarried women with births belong to 20 to 34 years age bracket with 66.1% of them unmarried.
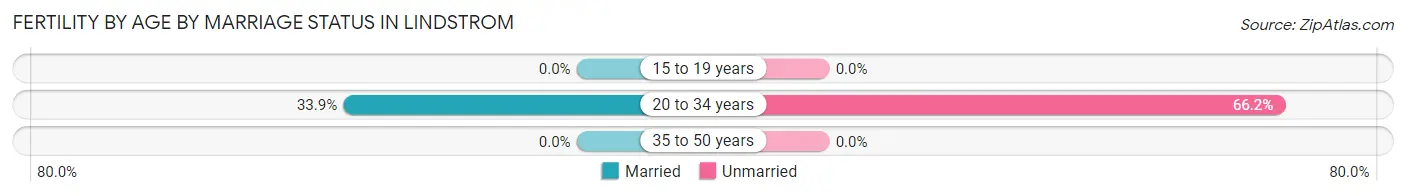
| Age Bracket | Married | Unmarried |
| 15 to 19 years | 0 (0.0%) | 0 (0.0%) |
| 20 to 34 years | 22 (33.9%) | 43 (66.1%) |
| 35 to 50 years | 0 (0.0%) | 0 (0.0%) |
| Total | 22 (33.9%) | 43 (66.1%) |
Fertility by Education in Lindstrom
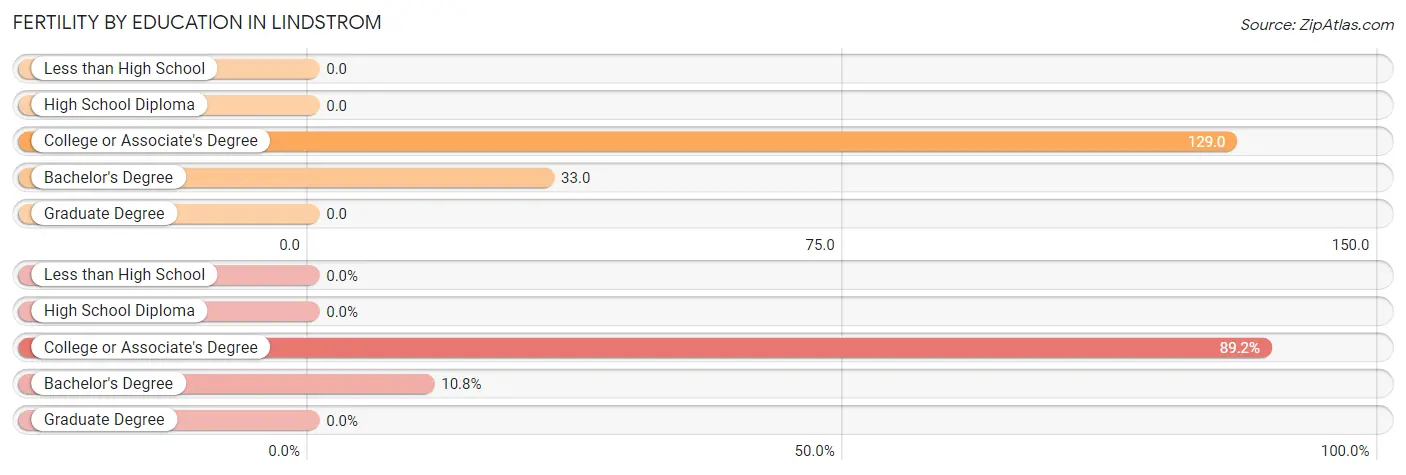
| Educational Attainment | Women with Births | Births / 1,000 Women |
| Less than High School | 0 (0.0%) | 0.0 |
| High School Diploma | 0 (0.0%) | 0.0 |
| College or Associate's Degree | 58 (89.2%) | 129.0 |
| Bachelor's Degree | 7 (10.8%) | 33.0 |
| Graduate Degree | 0 (0.0%) | 0.0 |
| Total | 65 (100.0%) | 61.0 |
Fertility by Education by Marriage Status in Lindstrom
66.1% of women with births in Lindstrom are unmarried. Women with the educational attainment of bachelor's degree are most likely to be married with 100.0% of them married at childbirth, while women with the educational attainment of college or associate's degree are least likely to be married with 74.1% of them unmarried at childbirth.
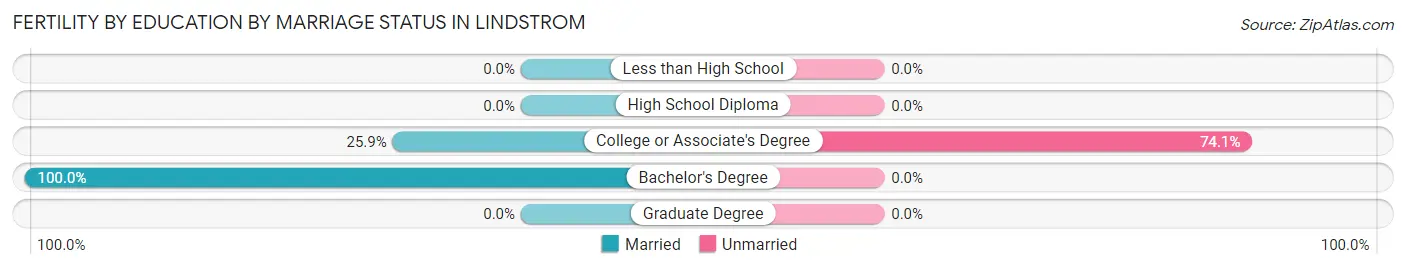
| Educational Attainment | Married | Unmarried |
| Less than High School | 0 (0.0%) | 0 (0.0%) |
| High School Diploma | 0 (0.0%) | 0 (0.0%) |
| College or Associate's Degree | 15 (25.9%) | 43 (74.1%) |
| Bachelor's Degree | 7 (100.0%) | 0 (0.0%) |
| Graduate Degree | 0 (0.0%) | 0 (0.0%) |
| Total | 22 (33.9%) | 43 (66.1%) |
Employment Characteristics in Lindstrom
Employment by Class of Employer in Lindstrom
Among the 2,564 employed individuals in Lindstrom, private company employees (1,481 | 57.8%), not-for-profit organizations (413 | 16.1%), and local government employees (200 | 7.8%) make up the most common classes of employment.
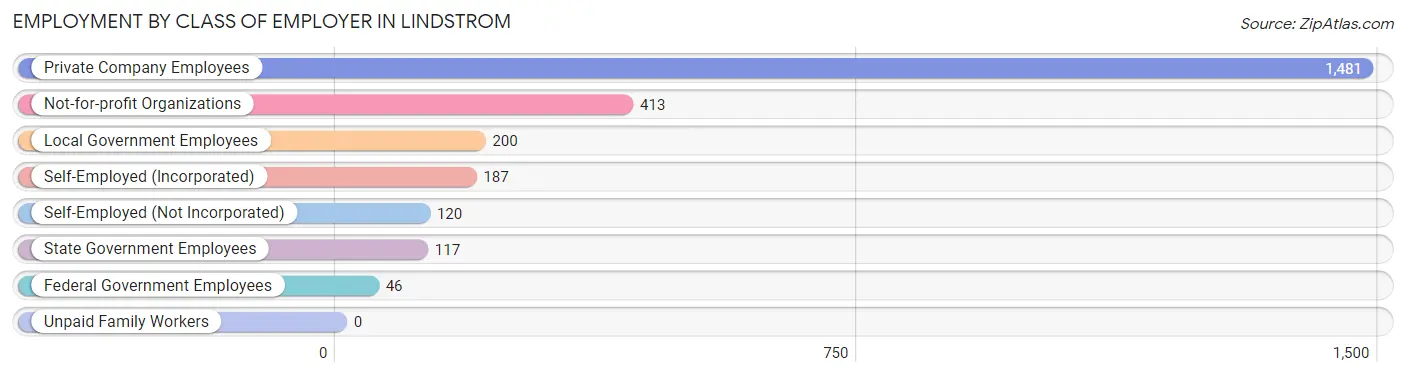
| Employer Class | # Employees | % Employees |
| Private Company Employees | 1,481 | 57.8% |
| Self-Employed (Incorporated) | 187 | 7.3% |
| Self-Employed (Not Incorporated) | 120 | 4.7% |
| Not-for-profit Organizations | 413 | 16.1% |
| Local Government Employees | 200 | 7.8% |
| State Government Employees | 117 | 4.6% |
| Federal Government Employees | 46 | 1.8% |
| Unpaid Family Workers | 0 | 0.0% |
| Total | 2,564 | 100.0% |
Employment Status by Age in Lindstrom
According to the labor force statistics for Lindstrom, out of the total population over 16 years of age (3,791), 71.9% or 2,726 individuals are in the labor force, with 2.8% or 76 of them unemployed. The age group with the highest labor force participation rate is 25 to 29 years, with 92.0% or 366 individuals in the labor force. Within the labor force, the 25 to 29 years age range has the highest percentage of unemployed individuals, with 12.8% or 47 of them being unemployed.
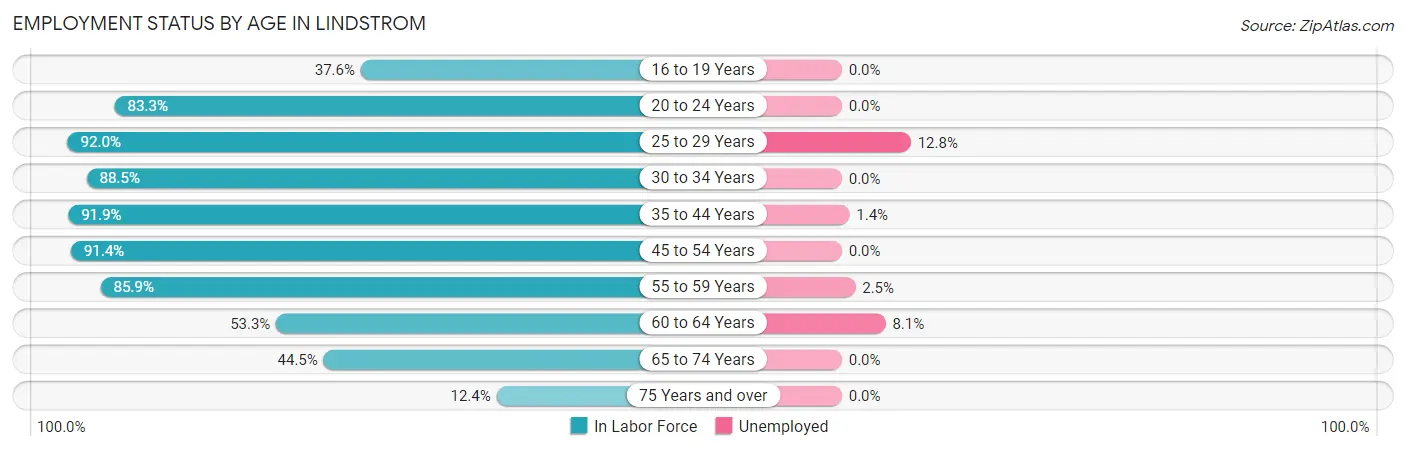
| Age Bracket | In Labor Force | Unemployed |
| 16 to 19 Years | 136 (37.6%) | 0 (0.0%) |
| 20 to 24 Years | 170 (83.3%) | 0 (0.0%) |
| 25 to 29 Years | 366 (92.0%) | 47 (12.8%) |
| 30 to 34 Years | 223 (88.5%) | 0 (0.0%) |
| 35 to 44 Years | 575 (91.9%) | 8 (1.4%) |
| 45 to 54 Years | 529 (91.4%) | 0 (0.0%) |
| 55 to 59 Years | 324 (85.9%) | 8 (2.5%) |
| 60 to 64 Years | 172 (53.3%) | 14 (8.1%) |
| 65 to 74 Years | 205 (44.5%) | 0 (0.0%) |
| 75 Years and over | 26 (12.4%) | 0 (0.0%) |
| Total | 2,726 (71.9%) | 76 (2.8%) |
Employment Status by Educational Attainment in Lindstrom
According to labor force statistics for Lindstrom, 85.7% of individuals (2,190) out of the total population between 25 and 64 years of age (2,555) are in the labor force, with 3.5% or 77 of them being unemployed. The group with the highest labor force participation rate are those with the educational attainment of less than high school, with 92.1% or 140 individuals in the labor force. Within the labor force, individuals with college / associate degree education have the highest percentage of unemployment, with 6.1% or 61 of them being unemployed.
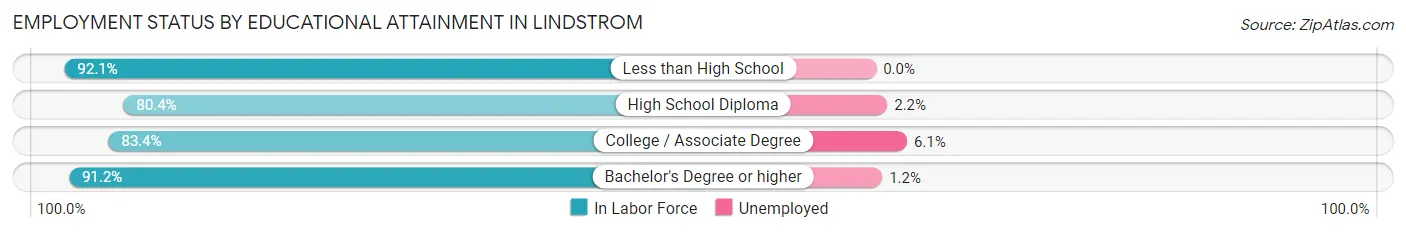
| Educational Attainment | In Labor Force | Unemployed |
| Less than High School | 140 (92.1%) | 0 (0.0%) |
| High School Diploma | 361 (80.4%) | 10 (2.2%) |
| College / Associate Degree | 1,006 (83.4%) | 74 (6.1%) |
| Bachelor's Degree or higher | 682 (91.2%) | 9 (1.2%) |
| Total | 2,190 (85.7%) | 89 (3.5%) |
Employment Occupations by Sex in Lindstrom
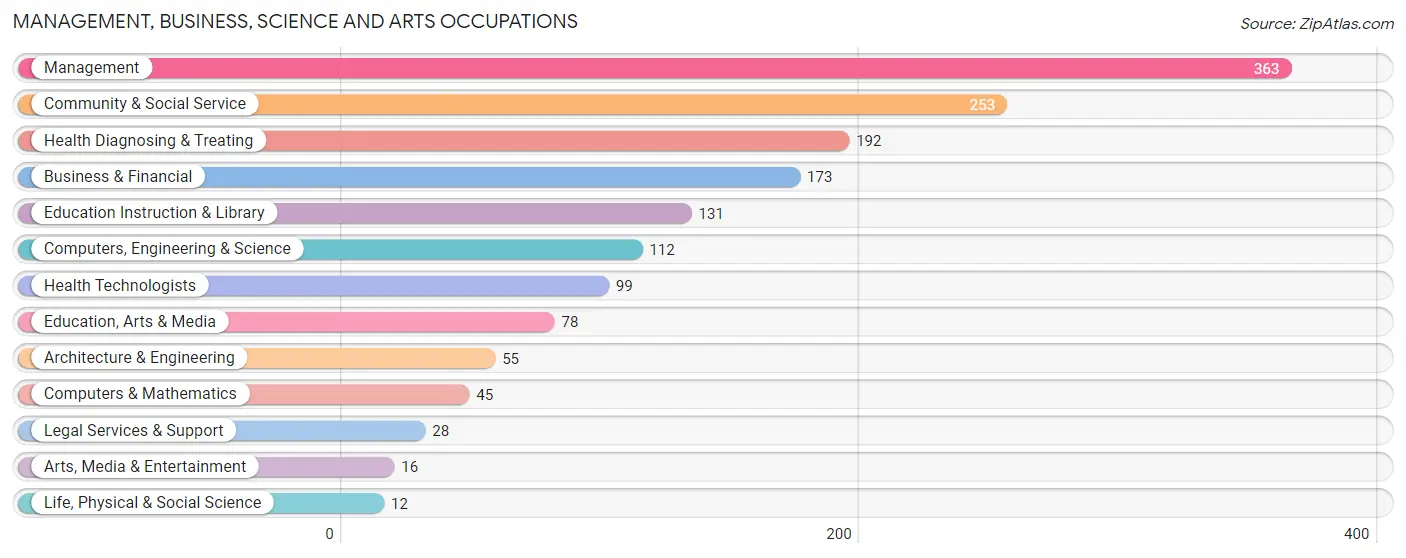
Management, Business, Science and Arts Occupations
The most common Management, Business, Science and Arts occupations in Lindstrom are Management (363 | 13.7%), Community & Social Service (253 | 9.6%), Health Diagnosing & Treating (192 | 7.2%), Business & Financial (173 | 6.5%), and Education Instruction & Library (131 | 5.0%).
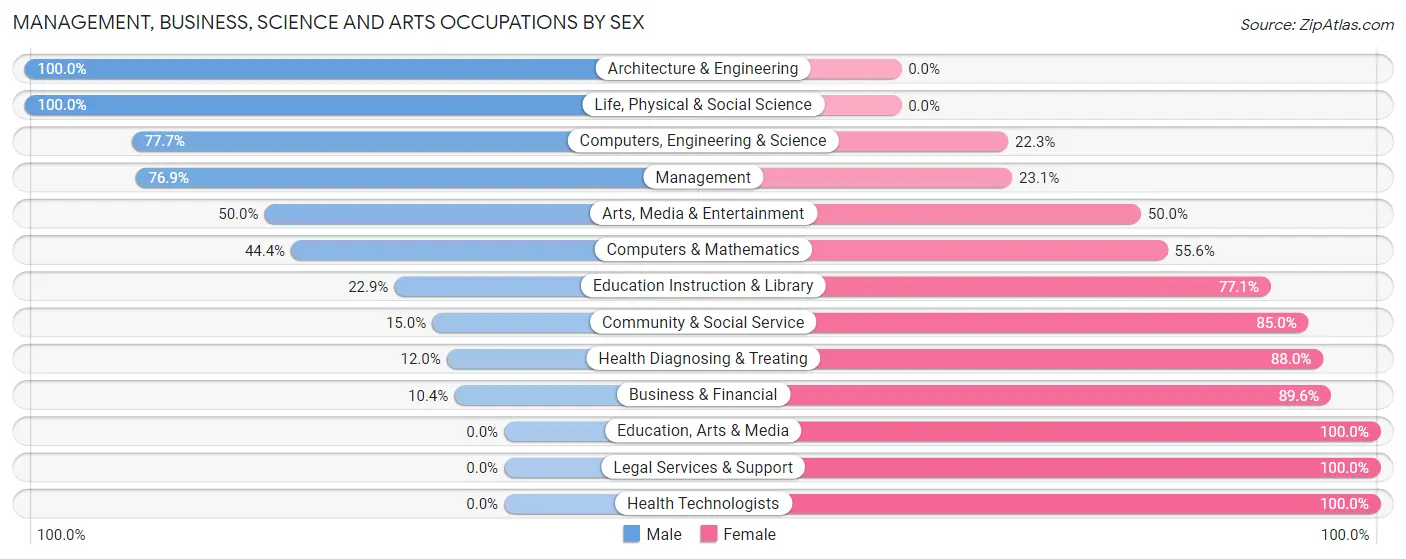
Management, Business, Science and Arts Occupations by Sex
Within the Management, Business, Science and Arts occupations in Lindstrom, the most male-oriented occupations are Architecture & Engineering (100.0%), Life, Physical & Social Science (100.0%), and Computers, Engineering & Science (77.7%), while the most female-oriented occupations are Education, Arts & Media (100.0%), Legal Services & Support (100.0%), and Health Technologists (100.0%).
| Occupation | Male | Female |
| Management | 279 (76.9%) | 84 (23.1%) |
| Business & Financial | 18 (10.4%) | 155 (89.6%) |
| Computers, Engineering & Science | 87 (77.7%) | 25 (22.3%) |
| Computers & Mathematics | 20 (44.4%) | 25 (55.6%) |
| Architecture & Engineering | 55 (100.0%) | 0 (0.0%) |
| Life, Physical & Social Science | 12 (100.0%) | 0 (0.0%) |
| Community & Social Service | 38 (15.0%) | 215 (85.0%) |
| Education, Arts & Media | 0 (0.0%) | 78 (100.0%) |
| Legal Services & Support | 0 (0.0%) | 28 (100.0%) |
| Education Instruction & Library | 30 (22.9%) | 101 (77.1%) |
| Arts, Media & Entertainment | 8 (50.0%) | 8 (50.0%) |
| Health Diagnosing & Treating | 23 (12.0%) | 169 (88.0%) |
| Health Technologists | 0 (0.0%) | 99 (100.0%) |
| Total (Category) | 445 (40.7%) | 648 (59.3%) |
| Total (Overall) | 1,487 (56.1%) | 1,162 (43.9%) |
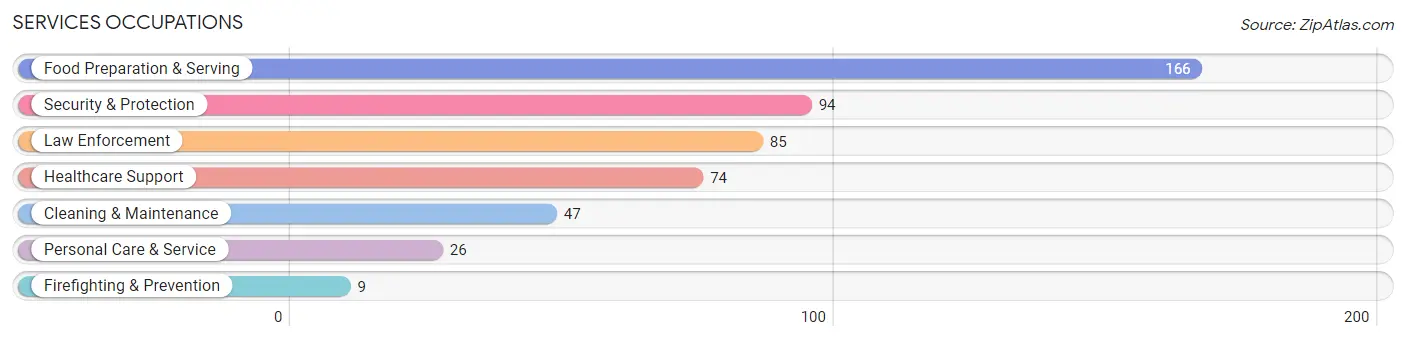
Services Occupations
The most common Services occupations in Lindstrom are Food Preparation & Serving (166 | 6.3%), Security & Protection (94 | 3.5%), Law Enforcement (85 | 3.2%), Healthcare Support (74 | 2.8%), and Cleaning & Maintenance (47 | 1.8%).
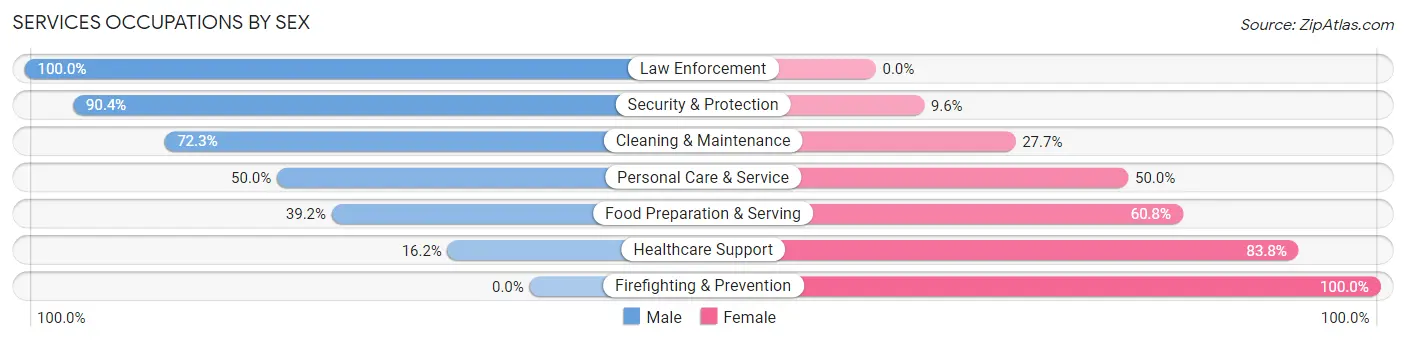
Services Occupations by Sex
Within the Services occupations in Lindstrom, the most male-oriented occupations are Law Enforcement (100.0%), Security & Protection (90.4%), and Cleaning & Maintenance (72.3%), while the most female-oriented occupations are Firefighting & Prevention (100.0%), Healthcare Support (83.8%), and Food Preparation & Serving (60.8%).
| Occupation | Male | Female |
| Healthcare Support | 12 (16.2%) | 62 (83.8%) |
| Security & Protection | 85 (90.4%) | 9 (9.6%) |
| Firefighting & Prevention | 0 (0.0%) | 9 (100.0%) |
| Law Enforcement | 85 (100.0%) | 0 (0.0%) |
| Food Preparation & Serving | 65 (39.2%) | 101 (60.8%) |
| Cleaning & Maintenance | 34 (72.3%) | 13 (27.7%) |
| Personal Care & Service | 13 (50.0%) | 13 (50.0%) |
| Total (Category) | 209 (51.3%) | 198 (48.6%) |
| Total (Overall) | 1,487 (56.1%) | 1,162 (43.9%) |
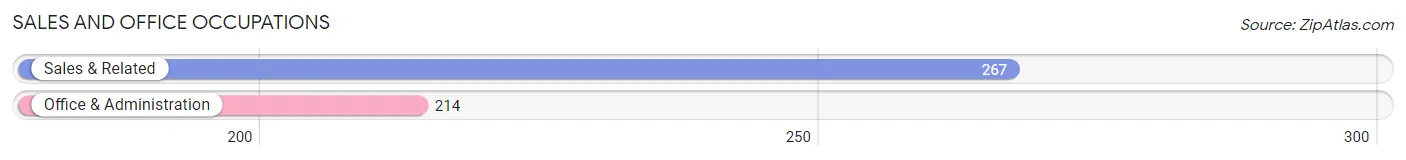
Sales and Office Occupations
The most common Sales and Office occupations in Lindstrom are Sales & Related (267 | 10.1%), and Office & Administration (214 | 8.1%).
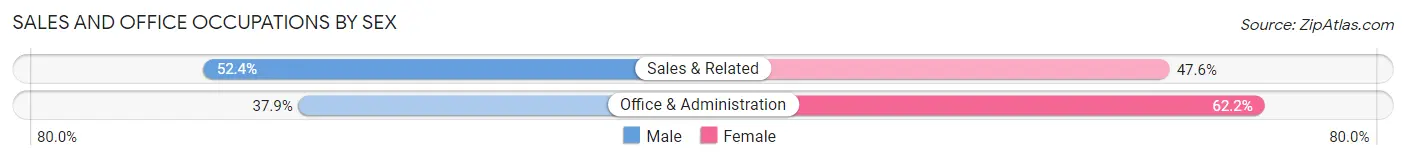
Sales and Office Occupations by Sex
| Occupation | Male | Female |
| Sales & Related | 140 (52.4%) | 127 (47.6%) |
| Office & Administration | 81 (37.9%) | 133 (62.2%) |
| Total (Category) | 221 (46.0%) | 260 (54.0%) |
| Total (Overall) | 1,487 (56.1%) | 1,162 (43.9%) |
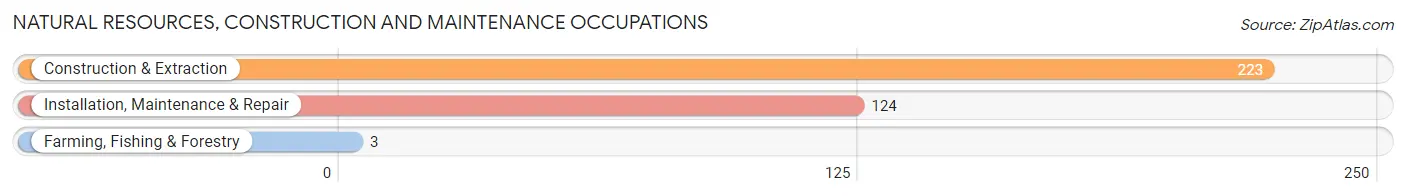
Natural Resources, Construction and Maintenance Occupations
The most common Natural Resources, Construction and Maintenance occupations in Lindstrom are Construction & Extraction (223 | 8.4%), Installation, Maintenance & Repair (124 | 4.7%), and Farming, Fishing & Forestry (3 | 0.1%).
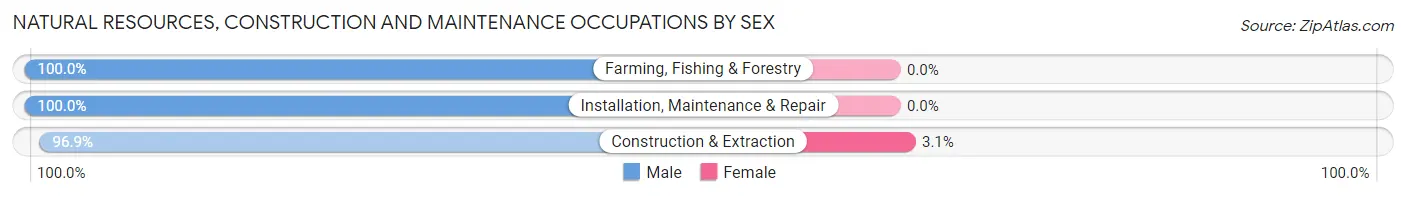
Natural Resources, Construction and Maintenance Occupations by Sex
| Occupation | Male | Female |
| Farming, Fishing & Forestry | 3 (100.0%) | 0 (0.0%) |
| Construction & Extraction | 216 (96.9%) | 7 (3.1%) |
| Installation, Maintenance & Repair | 124 (100.0%) | 0 (0.0%) |
| Total (Category) | 343 (98.0%) | 7 (2.0%) |
| Total (Overall) | 1,487 (56.1%) | 1,162 (43.9%) |
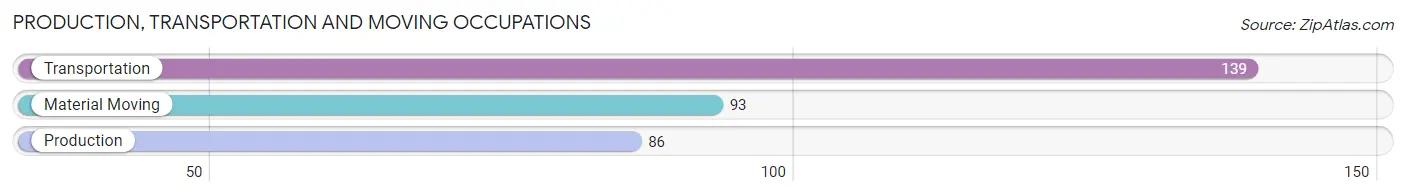
Production, Transportation and Moving Occupations
The most common Production, Transportation and Moving occupations in Lindstrom are Transportation (139 | 5.2%), Material Moving (93 | 3.5%), and Production (86 | 3.3%).
Production, Transportation and Moving Occupations by Sex
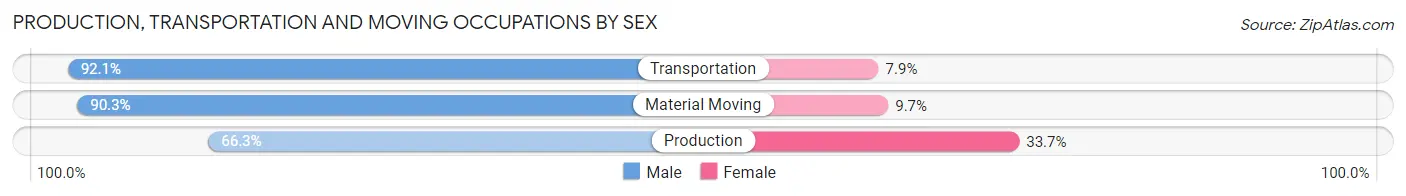
| Occupation | Male | Female |
| Production | 57 (66.3%) | 29 (33.7%) |
| Transportation | 128 (92.1%) | 11 (7.9%) |
| Material Moving | 84 (90.3%) | 9 (9.7%) |
| Total (Category) | 269 (84.6%) | 49 (15.4%) |
| Total (Overall) | 1,487 (56.1%) | 1,162 (43.9%) |
Employment Industries by Sex in Lindstrom
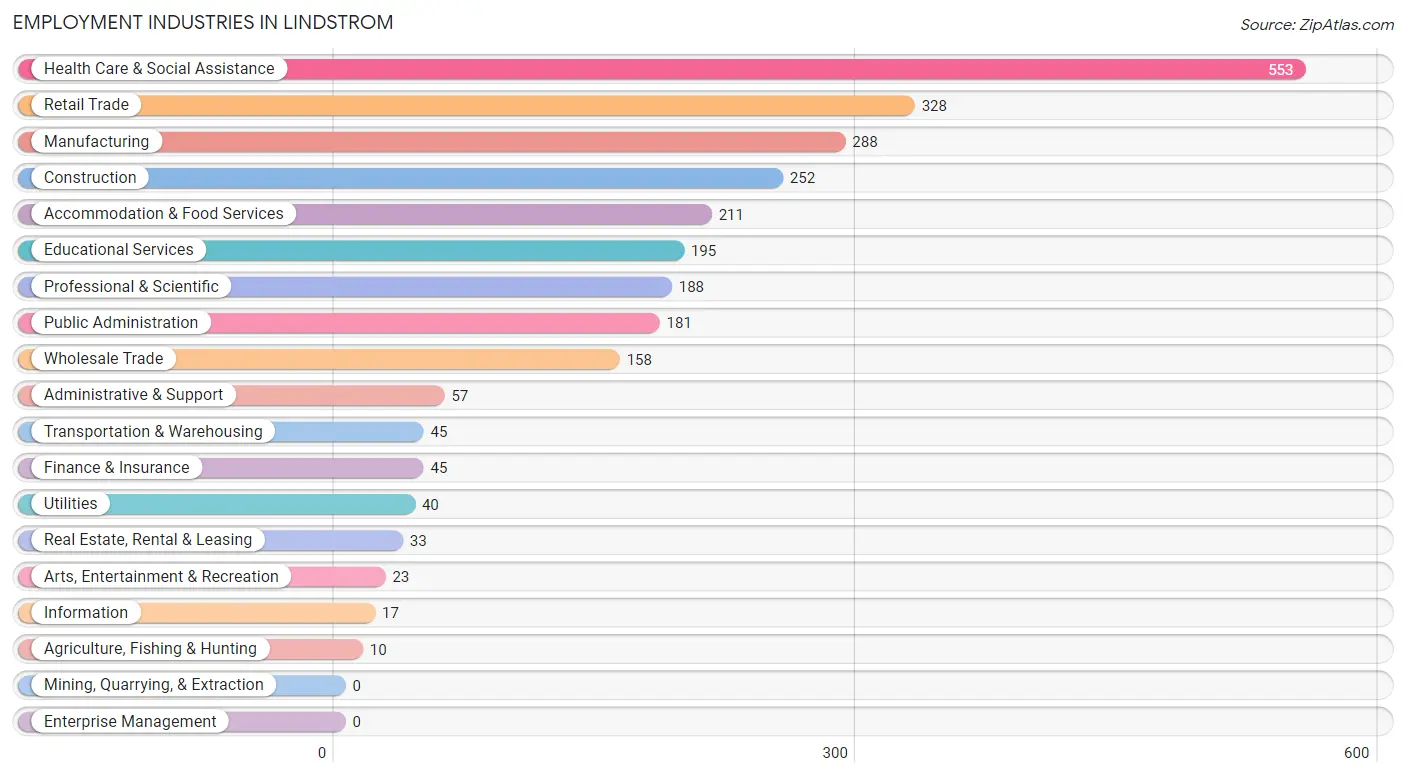
Employment Industries in Lindstrom
The major employment industries in Lindstrom include Health Care & Social Assistance (553 | 20.9%), Retail Trade (328 | 12.4%), Manufacturing (288 | 10.9%), Construction (252 | 9.5%), and Accommodation & Food Services (211 | 8.0%).
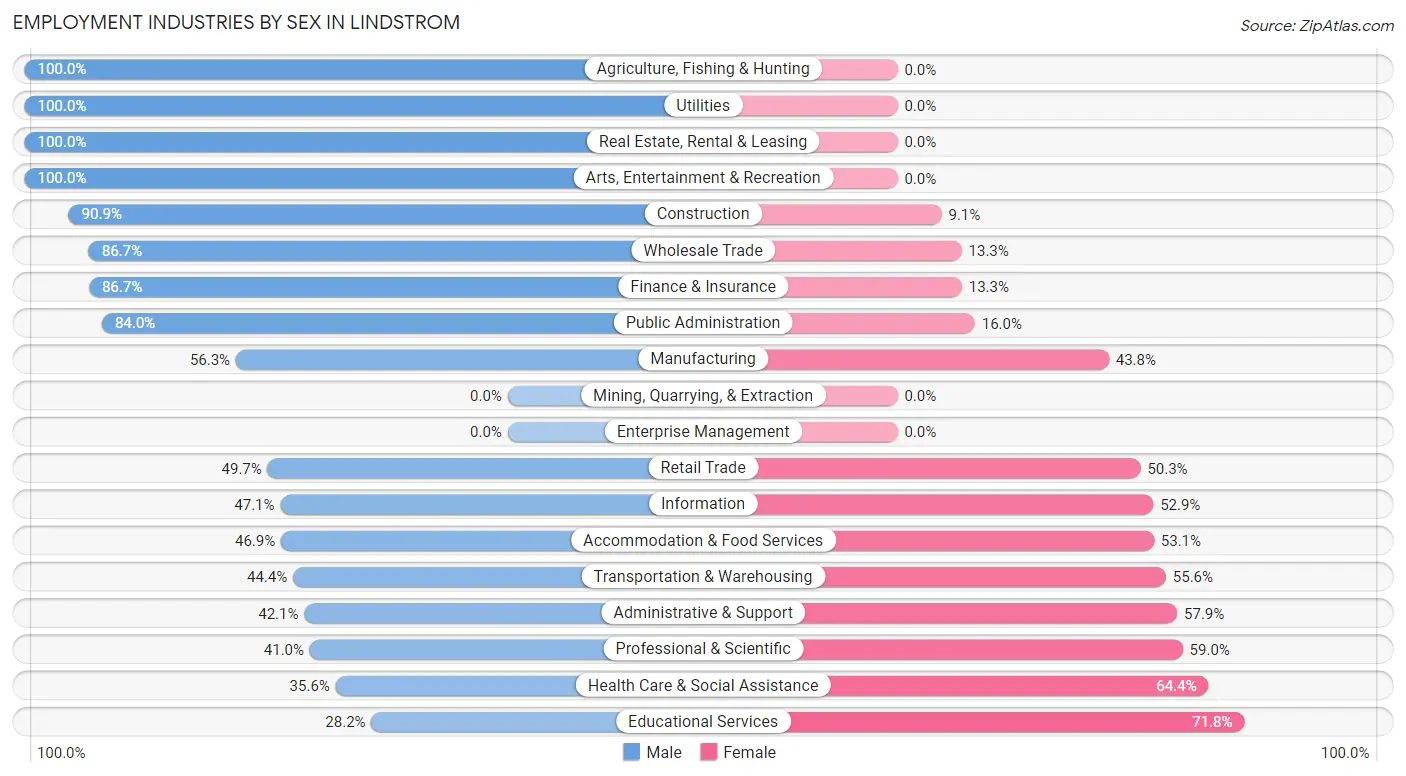
Employment Industries by Sex in Lindstrom
The Lindstrom industries that see more men than women are Agriculture, Fishing & Hunting (100.0%), Utilities (100.0%), and Real Estate, Rental & Leasing (100.0%), whereas the industries that tend to have a higher number of women are Educational Services (71.8%), Health Care & Social Assistance (64.4%), and Professional & Scientific (59.0%).
| Industry | Male | Female |
| Agriculture, Fishing & Hunting | 10 (100.0%) | 0 (0.0%) |
| Mining, Quarrying, & Extraction | 0 (0.0%) | 0 (0.0%) |
| Construction | 229 (90.9%) | 23 (9.1%) |
| Manufacturing | 162 (56.2%) | 126 (43.8%) |
| Wholesale Trade | 137 (86.7%) | 21 (13.3%) |
| Retail Trade | 163 (49.7%) | 165 (50.3%) |
| Transportation & Warehousing | 20 (44.4%) | 25 (55.6%) |
| Utilities | 40 (100.0%) | 0 (0.0%) |
| Information | 8 (47.1%) | 9 (52.9%) |
| Finance & Insurance | 39 (86.7%) | 6 (13.3%) |
| Real Estate, Rental & Leasing | 33 (100.0%) | 0 (0.0%) |
| Professional & Scientific | 77 (41.0%) | 111 (59.0%) |
| Enterprise Management | 0 (0.0%) | 0 (0.0%) |
| Administrative & Support | 24 (42.1%) | 33 (57.9%) |
| Educational Services | 55 (28.2%) | 140 (71.8%) |
| Health Care & Social Assistance | 197 (35.6%) | 356 (64.4%) |
| Arts, Entertainment & Recreation | 23 (100.0%) | 0 (0.0%) |
| Accommodation & Food Services | 99 (46.9%) | 112 (53.1%) |
| Public Administration | 152 (84.0%) | 29 (16.0%) |
| Total | 1,487 (56.1%) | 1,162 (43.9%) |
Education in Lindstrom
School Enrollment in Lindstrom
The most common levels of schooling among the 1,435 students in Lindstrom are middle school (418 | 29.1%), high school (394 | 27.5%), and college / undergraduate (263 | 18.3%).
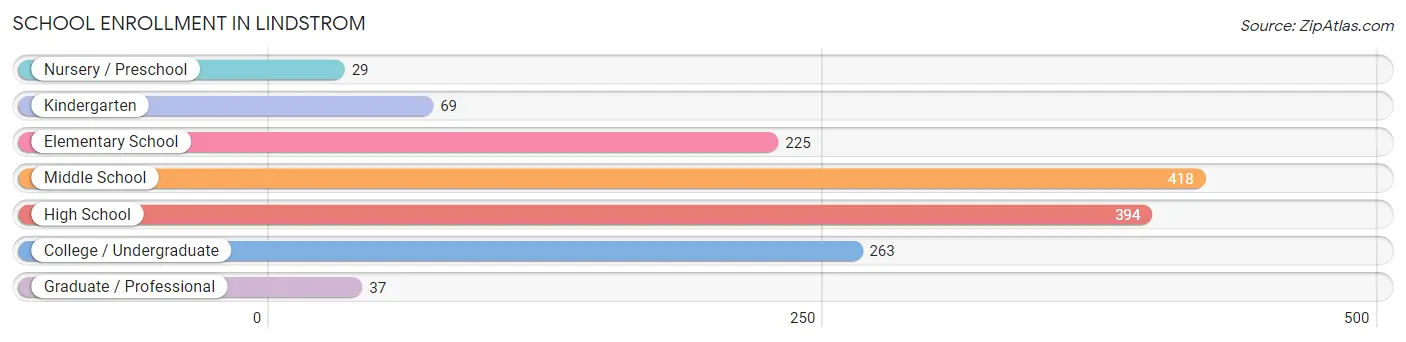
| School Level | # Students | % Students |
| Nursery / Preschool | 29 | 2.0% |
| Kindergarten | 69 | 4.8% |
| Elementary School | 225 | 15.7% |
| Middle School | 418 | 29.1% |
| High School | 394 | 27.5% |
| College / Undergraduate | 263 | 18.3% |
| Graduate / Professional | 37 | 2.6% |
| Total | 1,435 | 100.0% |
School Enrollment by Age by Funding Source in Lindstrom
Out of a total of 1,435 students who are enrolled in schools in Lindstrom, 119 (8.3%) attend a private institution, while the remaining 1,316 (91.7%) are enrolled in public schools. The age group of 20 to 24 year olds has the highest likelihood of being enrolled in private schools, with 49 (44.6% in the age bracket) enrolled. Conversely, the age group of 3 to 4 year olds has the lowest likelihood of being enrolled in a private school, with 29 (100.0% in the age bracket) attending a public institution.
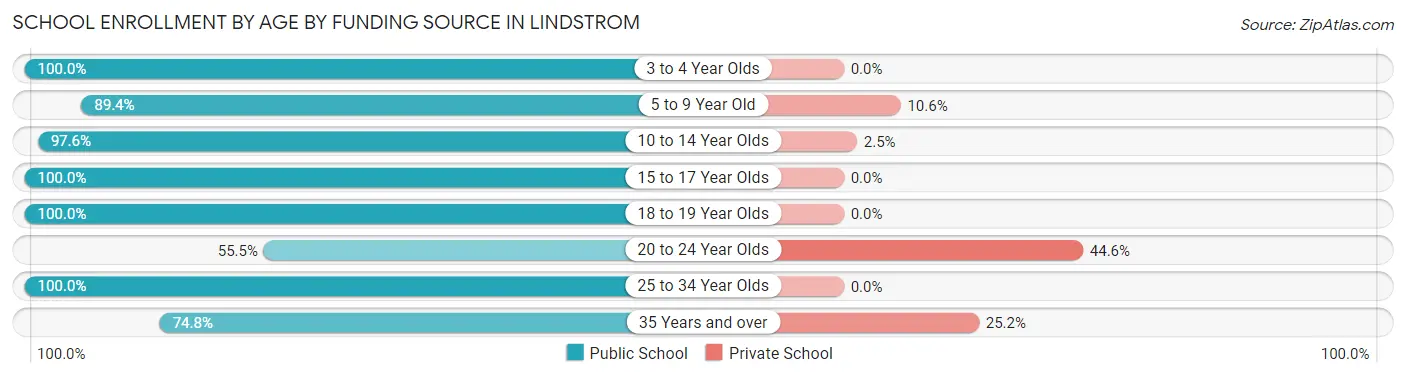
| Age Bracket | Public School | Private School |
| 3 to 4 Year Olds | 29 (100.0%) | 0 (0.0%) |
| 5 to 9 Year Old | 169 (89.4%) | 20 (10.6%) |
| 10 to 14 Year Olds | 518 (97.6%) | 13 (2.5%) |
| 15 to 17 Year Olds | 328 (100.0%) | 0 (0.0%) |
| 18 to 19 Year Olds | 51 (100.0%) | 0 (0.0%) |
| 20 to 24 Year Olds | 61 (55.4%) | 49 (44.6%) |
| 25 to 34 Year Olds | 50 (100.0%) | 0 (0.0%) |
| 35 Years and over | 110 (74.8%) | 37 (25.2%) |
| Total | 1,316 (91.7%) | 119 (8.3%) |
Educational Attainment by Field of Study in Lindstrom
Business (256 | 25.7%), education (157 | 15.8%), arts & humanities (134 | 13.5%), science & technology (117 | 11.7%), and bio, nature & agricultural (101 | 10.1%) are the most common fields of study among 996 individuals in Lindstrom who have obtained a bachelor's degree or higher.
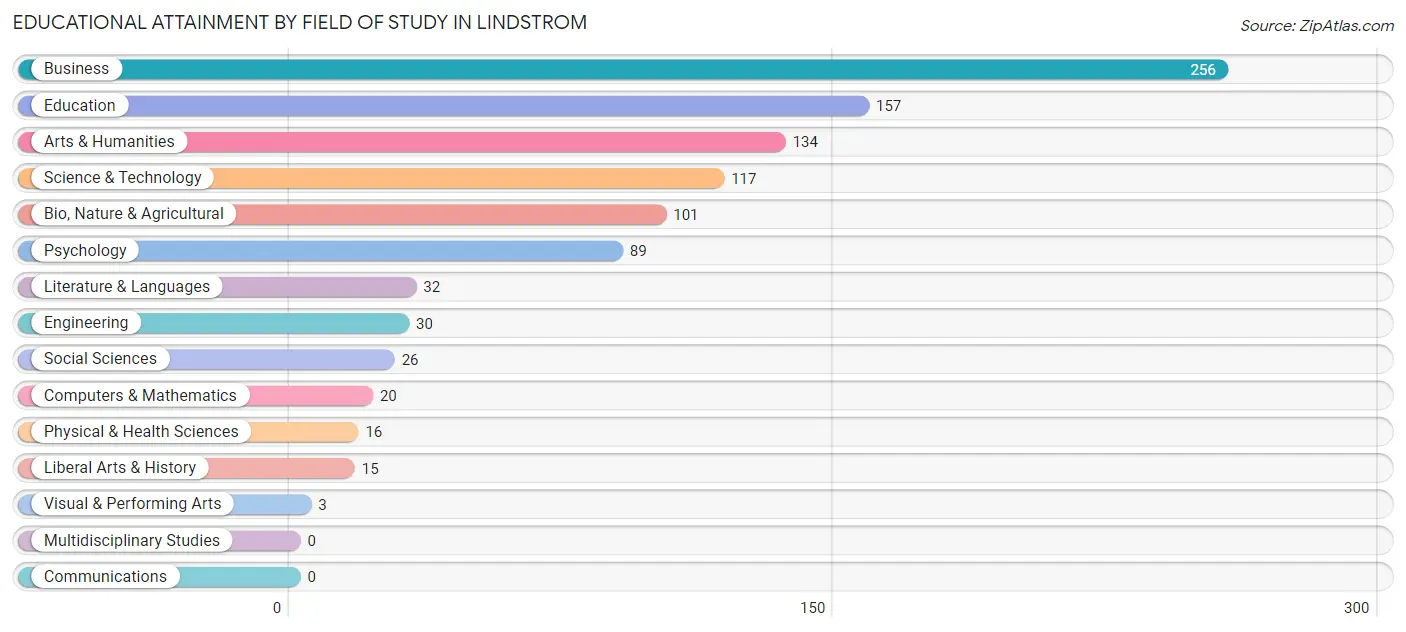
| Field of Study | # Graduates | % Graduates |
| Computers & Mathematics | 20 | 2.0% |
| Bio, Nature & Agricultural | 101 | 10.1% |
| Physical & Health Sciences | 16 | 1.6% |
| Psychology | 89 | 8.9% |
| Social Sciences | 26 | 2.6% |
| Engineering | 30 | 3.0% |
| Multidisciplinary Studies | 0 | 0.0% |
| Science & Technology | 117 | 11.7% |
| Business | 256 | 25.7% |
| Education | 157 | 15.8% |
| Literature & Languages | 32 | 3.2% |
| Liberal Arts & History | 15 | 1.5% |
| Visual & Performing Arts | 3 | 0.3% |
| Communications | 0 | 0.0% |
| Arts & Humanities | 134 | 13.5% |
| Total | 996 | 100.0% |
Transportation & Commute in Lindstrom
Vehicle Availability by Sex in Lindstrom
The most prevalent vehicle ownership categories in Lindstrom are males with 3 vehicles (540, accounting for 37.4%) and females with 3 vehicles (395, making up 48.3%).
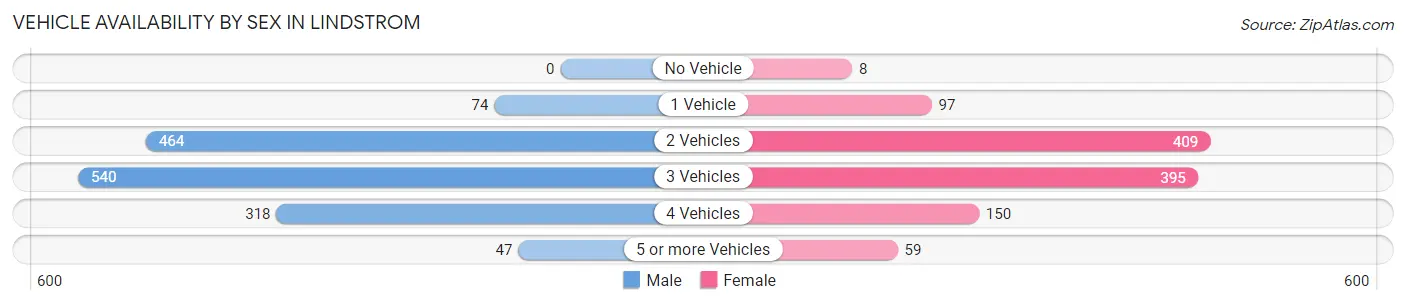
| Vehicles Available | Male | Female |
| No Vehicle | 0 (0.0%) | 8 (0.7%) |
| 1 Vehicle | 74 (5.1%) | 97 (8.7%) |
| 2 Vehicles | 464 (32.2%) | 409 (36.6%) |
| 3 Vehicles | 540 (37.4%) | 395 (35.3%) |
| 4 Vehicles | 318 (22.0%) | 150 (13.4%) |
| 5 or more Vehicles | 47 (3.3%) | 59 (5.3%) |
| Total | 1,443 (100.0%) | 1,118 (100.0%) |
Commute Time in Lindstrom
The most frequently occuring commute durations in Lindstrom are 45 to 59 minutes (386 commuters, 16.7%), 40 to 44 minutes (285 commuters, 12.3%), and 60 to 89 minutes (276 commuters, 11.9%).
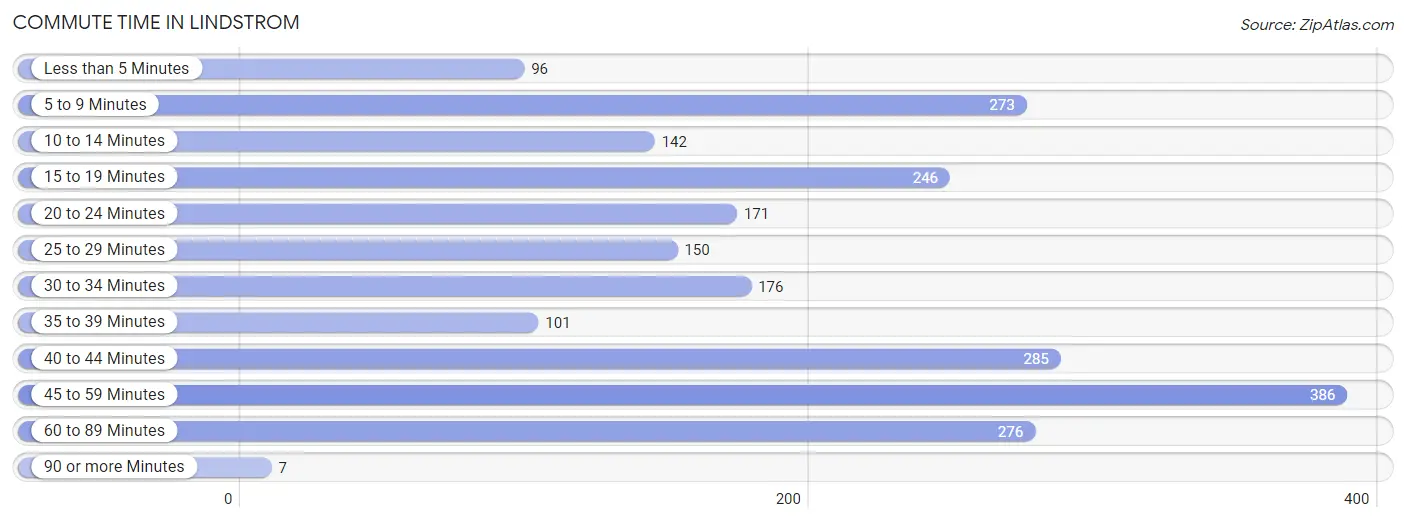
| Commute Time | # Commuters | % Commuters |
| Less than 5 Minutes | 96 | 4.2% |
| 5 to 9 Minutes | 273 | 11.8% |
| 10 to 14 Minutes | 142 | 6.1% |
| 15 to 19 Minutes | 246 | 10.6% |
| 20 to 24 Minutes | 171 | 7.4% |
| 25 to 29 Minutes | 150 | 6.5% |
| 30 to 34 Minutes | 176 | 7.6% |
| 35 to 39 Minutes | 101 | 4.4% |
| 40 to 44 Minutes | 285 | 12.3% |
| 45 to 59 Minutes | 386 | 16.7% |
| 60 to 89 Minutes | 276 | 11.9% |
| 90 or more Minutes | 7 | 0.3% |
Commute Time by Sex in Lindstrom
The most common commute times in Lindstrom are 45 to 59 minutes (286 commuters, 20.6%) for males and 5 to 9 minutes (204 commuters, 22.2%) for females.
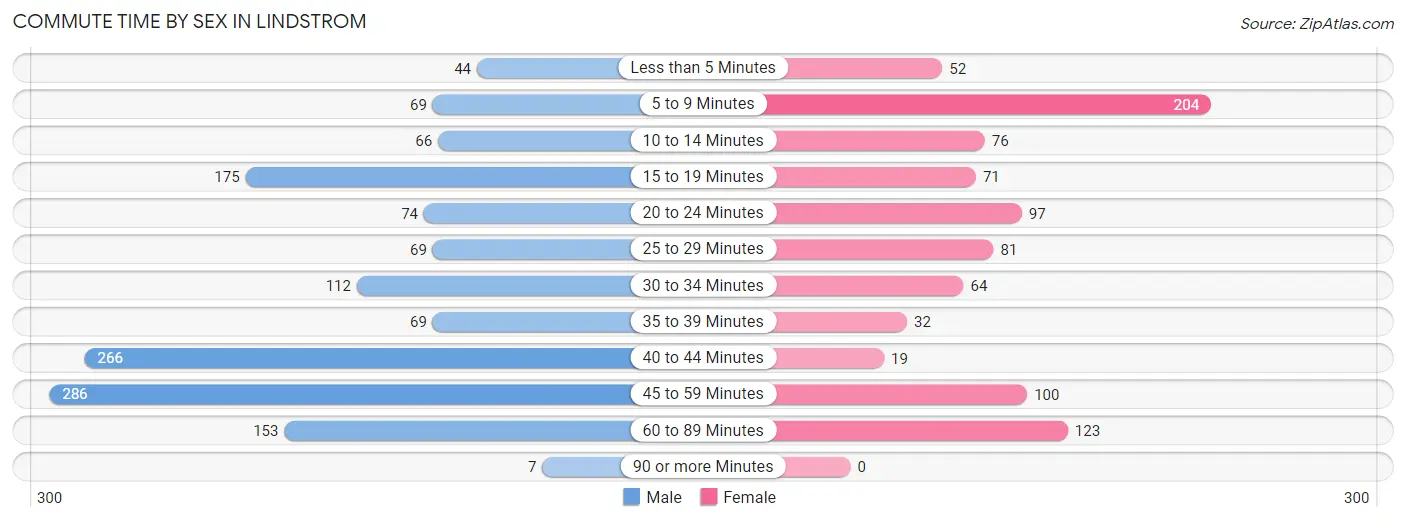
| Commute Time | Male | Female |
| Less than 5 Minutes | 44 (3.2%) | 52 (5.7%) |
| 5 to 9 Minutes | 69 (5.0%) | 204 (22.2%) |
| 10 to 14 Minutes | 66 (4.8%) | 76 (8.3%) |
| 15 to 19 Minutes | 175 (12.6%) | 71 (7.7%) |
| 20 to 24 Minutes | 74 (5.3%) | 97 (10.5%) |
| 25 to 29 Minutes | 69 (5.0%) | 81 (8.8%) |
| 30 to 34 Minutes | 112 (8.1%) | 64 (7.0%) |
| 35 to 39 Minutes | 69 (5.0%) | 32 (3.5%) |
| 40 to 44 Minutes | 266 (19.1%) | 19 (2.1%) |
| 45 to 59 Minutes | 286 (20.6%) | 100 (10.9%) |
| 60 to 89 Minutes | 153 (11.0%) | 123 (13.4%) |
| 90 or more Minutes | 7 (0.5%) | 0 (0.0%) |
Time of Departure to Work by Sex in Lindstrom
The most frequent times of departure to work in Lindstrom are 12:00 AM to 4:59 AM (229, 16.5%) for males and 7:00 AM to 7:29 AM (171, 18.6%) for females.
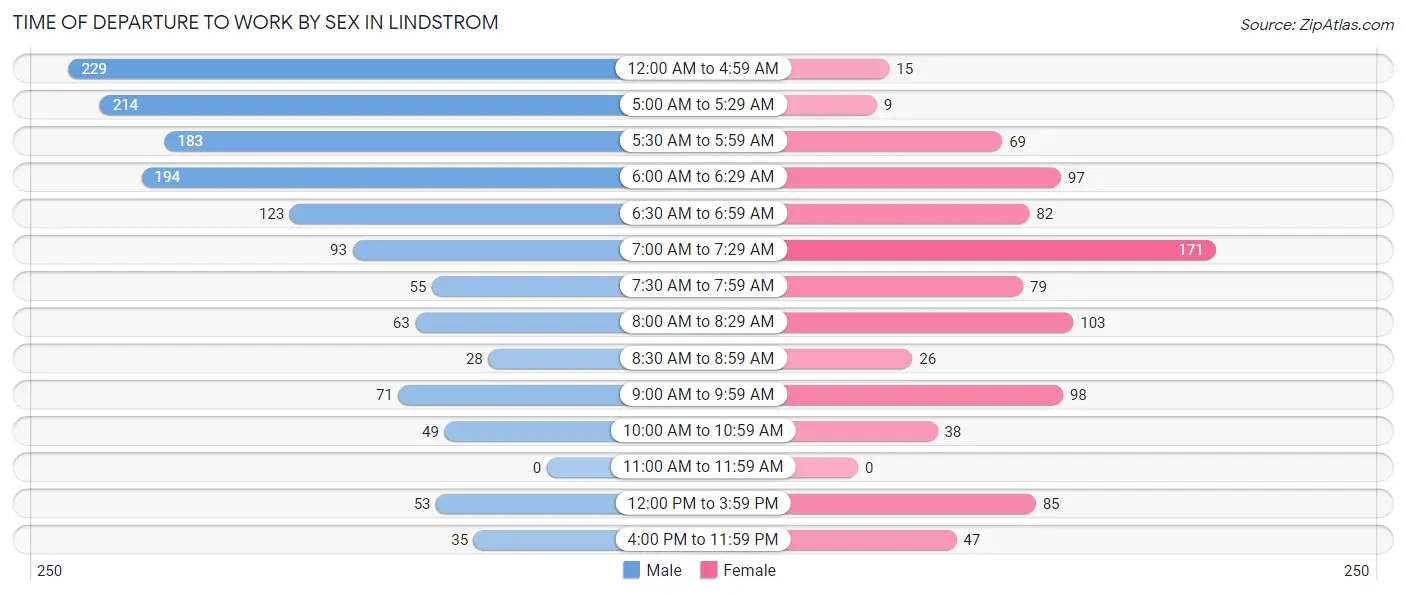
| Time of Departure | Male | Female |
| 12:00 AM to 4:59 AM | 229 (16.5%) | 15 (1.6%) |
| 5:00 AM to 5:29 AM | 214 (15.4%) | 9 (1.0%) |
| 5:30 AM to 5:59 AM | 183 (13.2%) | 69 (7.5%) |
| 6:00 AM to 6:29 AM | 194 (14.0%) | 97 (10.5%) |
| 6:30 AM to 6:59 AM | 123 (8.8%) | 82 (8.9%) |
| 7:00 AM to 7:29 AM | 93 (6.7%) | 171 (18.6%) |
| 7:30 AM to 7:59 AM | 55 (4.0%) | 79 (8.6%) |
| 8:00 AM to 8:29 AM | 63 (4.5%) | 103 (11.2%) |
| 8:30 AM to 8:59 AM | 28 (2.0%) | 26 (2.8%) |
| 9:00 AM to 9:59 AM | 71 (5.1%) | 98 (10.7%) |
| 10:00 AM to 10:59 AM | 49 (3.5%) | 38 (4.1%) |
| 11:00 AM to 11:59 AM | 0 (0.0%) | 0 (0.0%) |
| 12:00 PM to 3:59 PM | 53 (3.8%) | 85 (9.2%) |
| 4:00 PM to 11:59 PM | 35 (2.5%) | 47 (5.1%) |
| Total | 1,390 (100.0%) | 919 (100.0%) |
Housing Occupancy in Lindstrom
Occupancy by Ownership in Lindstrom
Of the total 1,809 dwellings in Lindstrom, owner-occupied units account for 1,577 (87.2%), while renter-occupied units make up 232 (12.8%).
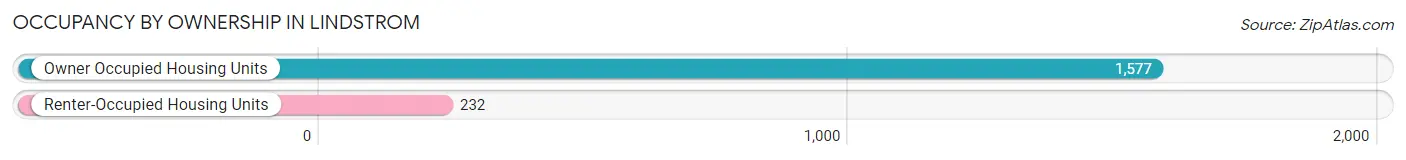
| Occupancy | # Housing Units | % Housing Units |
| Owner Occupied Housing Units | 1,577 | 87.2% |
| Renter-Occupied Housing Units | 232 | 12.8% |
| Total Occupied Housing Units | 1,809 | 100.0% |
Occupancy by Household Size in Lindstrom
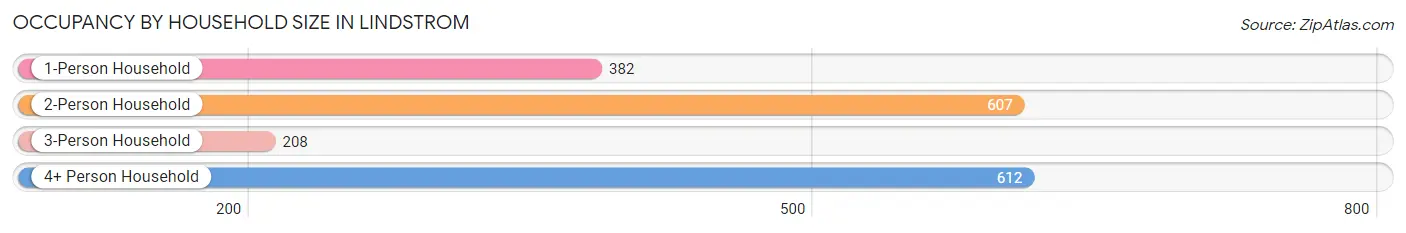
| Household Size | # Housing Units | % Housing Units |
| 1-Person Household | 382 | 21.1% |
| 2-Person Household | 607 | 33.6% |
| 3-Person Household | 208 | 11.5% |
| 4+ Person Household | 612 | 33.8% |
| Total Housing Units | 1,809 | 100.0% |
Occupancy by Ownership by Household Size in Lindstrom
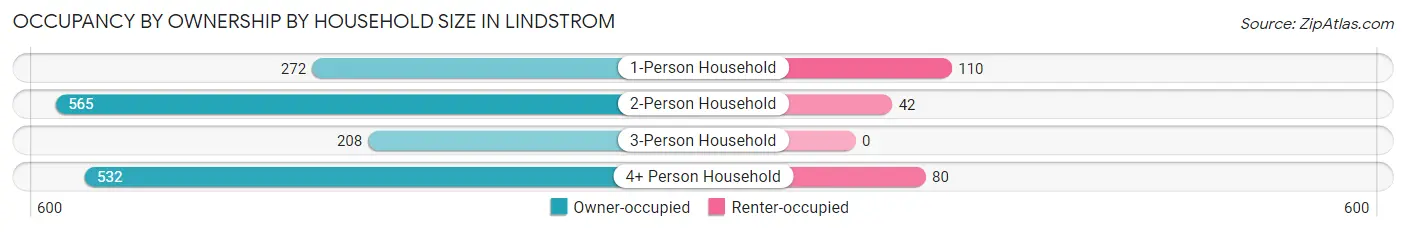
| Household Size | Owner-occupied | Renter-occupied |
| 1-Person Household | 272 (71.2%) | 110 (28.8%) |
| 2-Person Household | 565 (93.1%) | 42 (6.9%) |
| 3-Person Household | 208 (100.0%) | 0 (0.0%) |
| 4+ Person Household | 532 (86.9%) | 80 (13.1%) |
| Total Housing Units | 1,577 (87.2%) | 232 (12.8%) |
Occupancy by Educational Attainment in Lindstrom
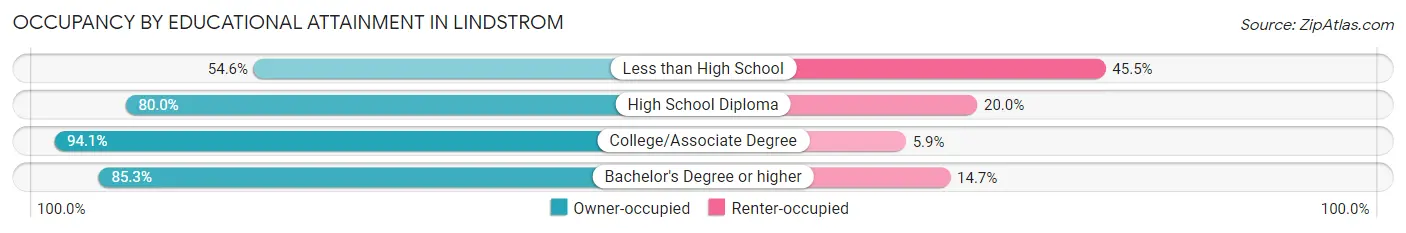
| Household Size | Owner-occupied | Renter-occupied |
| Less than High School | 42 (54.5%) | 35 (45.5%) |
| High School Diploma | 272 (80.0%) | 68 (20.0%) |
| College/Associate Degree | 803 (94.1%) | 50 (5.9%) |
| Bachelor's Degree or higher | 460 (85.3%) | 79 (14.7%) |
Occupancy by Age of Householder in Lindstrom
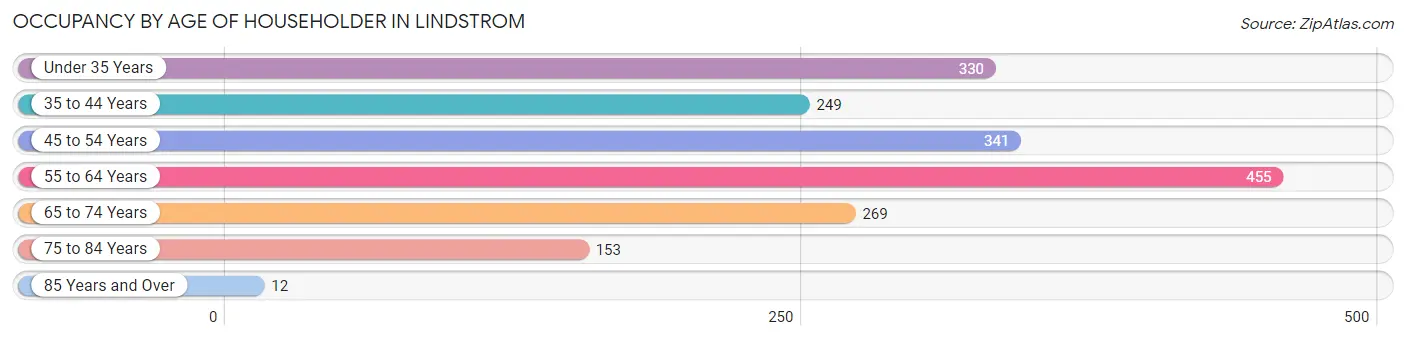
| Age Bracket | # Households | % Households |
| Under 35 Years | 330 | 18.2% |
| 35 to 44 Years | 249 | 13.8% |
| 45 to 54 Years | 341 | 18.9% |
| 55 to 64 Years | 455 | 25.2% |
| 65 to 74 Years | 269 | 14.9% |
| 75 to 84 Years | 153 | 8.5% |
| 85 Years and Over | 12 | 0.7% |
| Total | 1,809 | 100.0% |
Housing Finances in Lindstrom
Median Income by Occupancy in Lindstrom
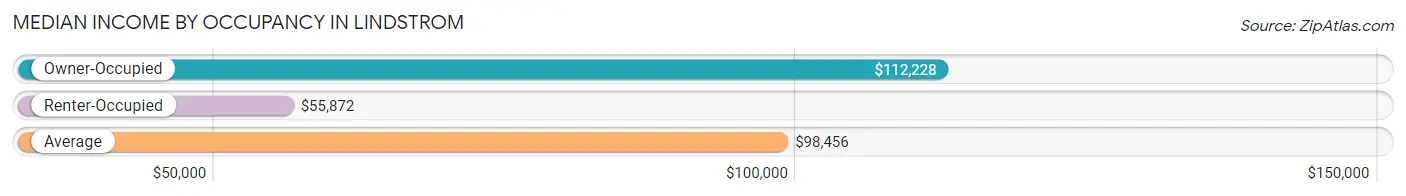
| Occupancy Type | # Households | Median Income |
| Owner-Occupied | 1,577 (87.2%) | $112,228 |
| Renter-Occupied | 232 (12.8%) | $55,872 |
| Average | 1,809 (100.0%) | $98,456 |
Occupancy by Householder Income Bracket in Lindstrom
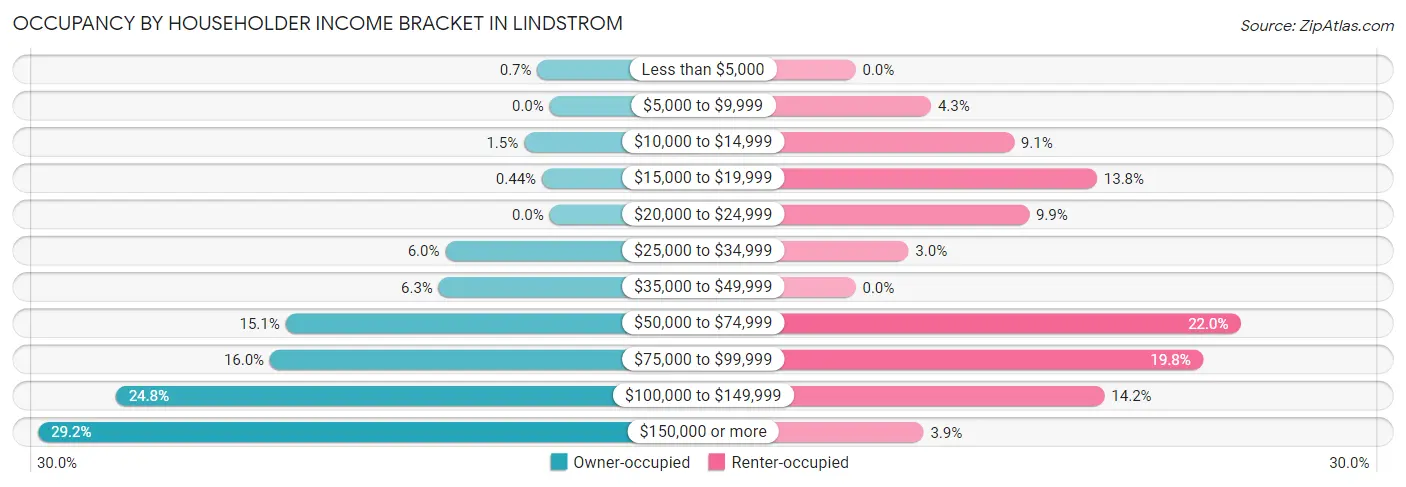
| Income Bracket | Owner-occupied | Renter-occupied |
| Less than $5,000 | 11 (0.7%) | 0 (0.0%) |
| $5,000 to $9,999 | 0 (0.0%) | 10 (4.3%) |
| $10,000 to $14,999 | 23 (1.5%) | 21 (9.0%) |
| $15,000 to $19,999 | 7 (0.4%) | 32 (13.8%) |
| $20,000 to $24,999 | 0 (0.0%) | 23 (9.9%) |
| $25,000 to $34,999 | 94 (6.0%) | 7 (3.0%) |
| $35,000 to $49,999 | 100 (6.3%) | 0 (0.0%) |
| $50,000 to $74,999 | 238 (15.1%) | 51 (22.0%) |
| $75,000 to $99,999 | 252 (16.0%) | 46 (19.8%) |
| $100,000 to $149,999 | 391 (24.8%) | 33 (14.2%) |
| $150,000 or more | 461 (29.2%) | 9 (3.9%) |
| Total | 1,577 (100.0%) | 232 (100.0%) |
Monthly Housing Cost Tiers in Lindstrom
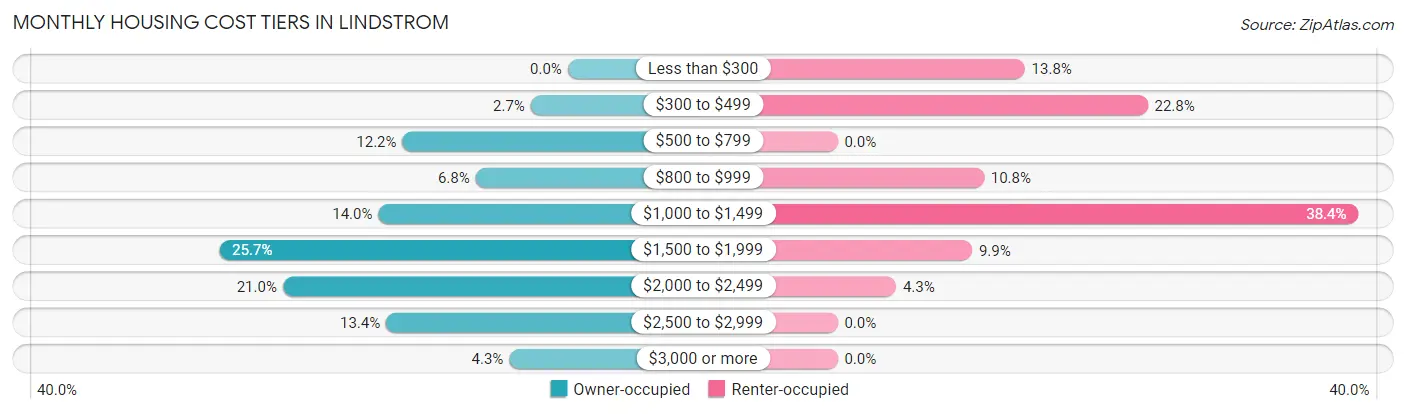
| Monthly Cost | Owner-occupied | Renter-occupied |
| Less than $300 | 0 (0.0%) | 32 (13.8%) |
| $300 to $499 | 43 (2.7%) | 53 (22.8%) |
| $500 to $799 | 192 (12.2%) | 0 (0.0%) |
| $800 to $999 | 107 (6.8%) | 25 (10.8%) |
| $1,000 to $1,499 | 220 (14.0%) | 89 (38.4%) |
| $1,500 to $1,999 | 405 (25.7%) | 23 (9.9%) |
| $2,000 to $2,499 | 331 (21.0%) | 10 (4.3%) |
| $2,500 to $2,999 | 211 (13.4%) | 0 (0.0%) |
| $3,000 or more | 68 (4.3%) | 0 (0.0%) |
| Total | 1,577 (100.0%) | 232 (100.0%) |
Physical Housing Characteristics in Lindstrom
Housing Structures in Lindstrom
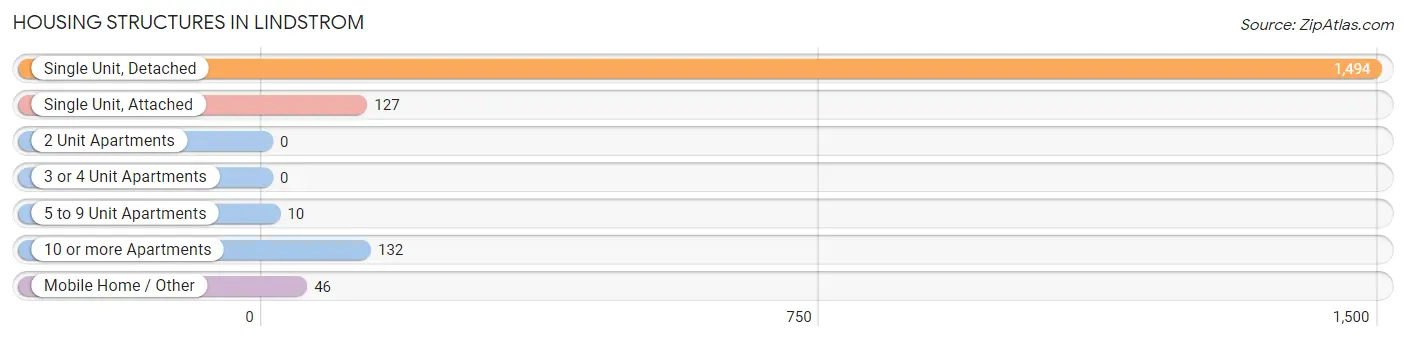
| Structure Type | # Housing Units | % Housing Units |
| Single Unit, Detached | 1,494 | 82.6% |
| Single Unit, Attached | 127 | 7.0% |
| 2 Unit Apartments | 0 | 0.0% |
| 3 or 4 Unit Apartments | 0 | 0.0% |
| 5 to 9 Unit Apartments | 10 | 0.5% |
| 10 or more Apartments | 132 | 7.3% |
| Mobile Home / Other | 46 | 2.5% |
| Total | 1,809 | 100.0% |
Housing Structures by Occupancy in Lindstrom
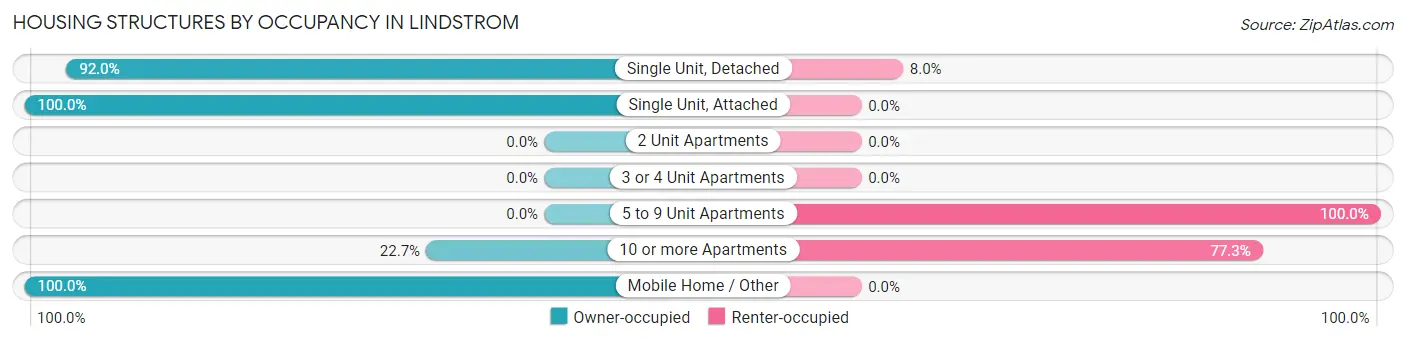
| Structure Type | Owner-occupied | Renter-occupied |
| Single Unit, Detached | 1,374 (92.0%) | 120 (8.0%) |
| Single Unit, Attached | 127 (100.0%) | 0 (0.0%) |
| 2 Unit Apartments | 0 (0.0%) | 0 (0.0%) |
| 3 or 4 Unit Apartments | 0 (0.0%) | 0 (0.0%) |
| 5 to 9 Unit Apartments | 0 (0.0%) | 10 (100.0%) |
| 10 or more Apartments | 30 (22.7%) | 102 (77.3%) |
| Mobile Home / Other | 46 (100.0%) | 0 (0.0%) |
| Total | 1,577 (87.2%) | 232 (12.8%) |
Housing Structures by Number of Rooms in Lindstrom
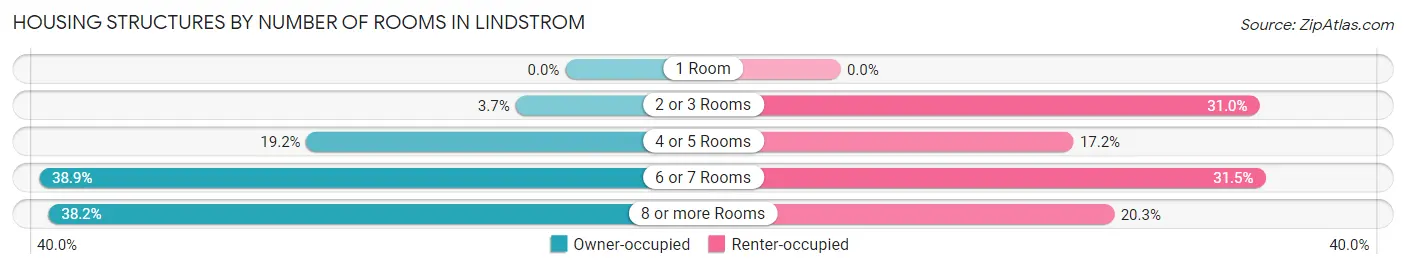
| Number of Rooms | Owner-occupied | Renter-occupied |
| 1 Room | 0 (0.0%) | 0 (0.0%) |
| 2 or 3 Rooms | 58 (3.7%) | 72 (31.0%) |
| 4 or 5 Rooms | 302 (19.2%) | 40 (17.2%) |
| 6 or 7 Rooms | 614 (38.9%) | 73 (31.5%) |
| 8 or more Rooms | 603 (38.2%) | 47 (20.3%) |
| Total | 1,577 (100.0%) | 232 (100.0%) |
Housing Structure by Heating Type in Lindstrom
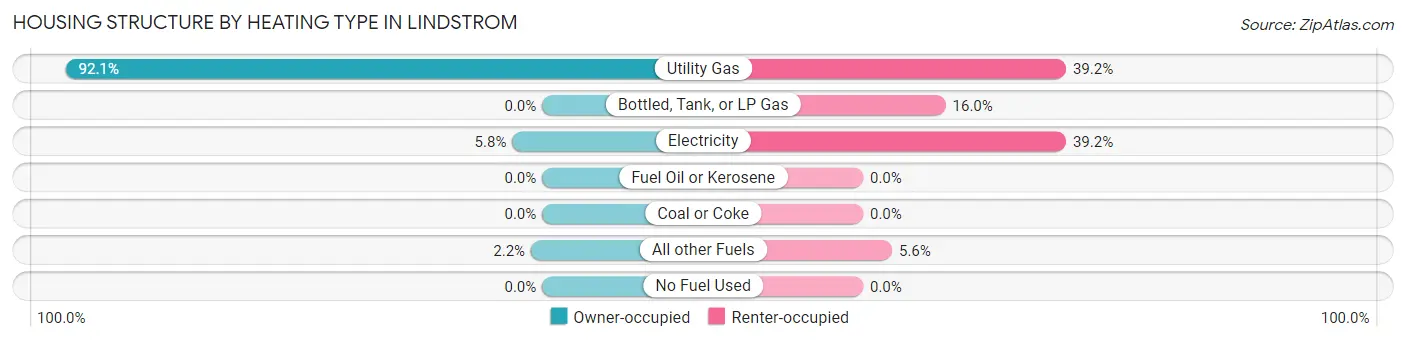
| Heating Type | Owner-occupied | Renter-occupied |
| Utility Gas | 1,452 (92.1%) | 91 (39.2%) |
| Bottled, Tank, or LP Gas | 0 (0.0%) | 37 (16.0%) |
| Electricity | 91 (5.8%) | 91 (39.2%) |
| Fuel Oil or Kerosene | 0 (0.0%) | 0 (0.0%) |
| Coal or Coke | 0 (0.0%) | 0 (0.0%) |
| All other Fuels | 34 (2.2%) | 13 (5.6%) |
| No Fuel Used | 0 (0.0%) | 0 (0.0%) |
| Total | 1,577 (100.0%) | 232 (100.0%) |
Household Vehicle Usage in Lindstrom
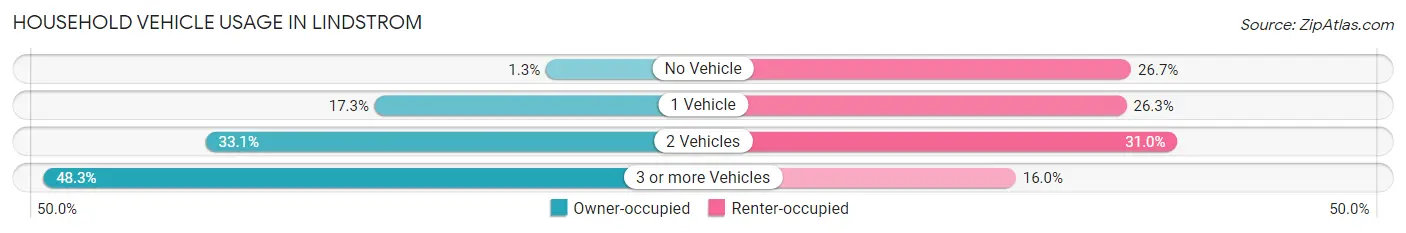
| Vehicles per Household | Owner-occupied | Renter-occupied |
| No Vehicle | 21 (1.3%) | 62 (26.7%) |
| 1 Vehicle | 273 (17.3%) | 61 (26.3%) |
| 2 Vehicles | 522 (33.1%) | 72 (31.0%) |
| 3 or more Vehicles | 761 (48.3%) | 37 (16.0%) |
| Total | 1,577 (100.0%) | 232 (100.0%) |
Real Estate & Mortgages in Lindstrom
Real Estate and Mortgage Overview in Lindstrom
| Characteristic | Without Mortgage | With Mortgage |
| Housing Units | 381 | 1,196 |
| Median Property Value | $241,800 | $317,100 |
| Median Household Income | $65,265 | $448 |
| Monthly Housing Costs | $742 | $58 |
| Real Estate Taxes | $3,240 | $15 |
Property Value by Mortgage Status in Lindstrom
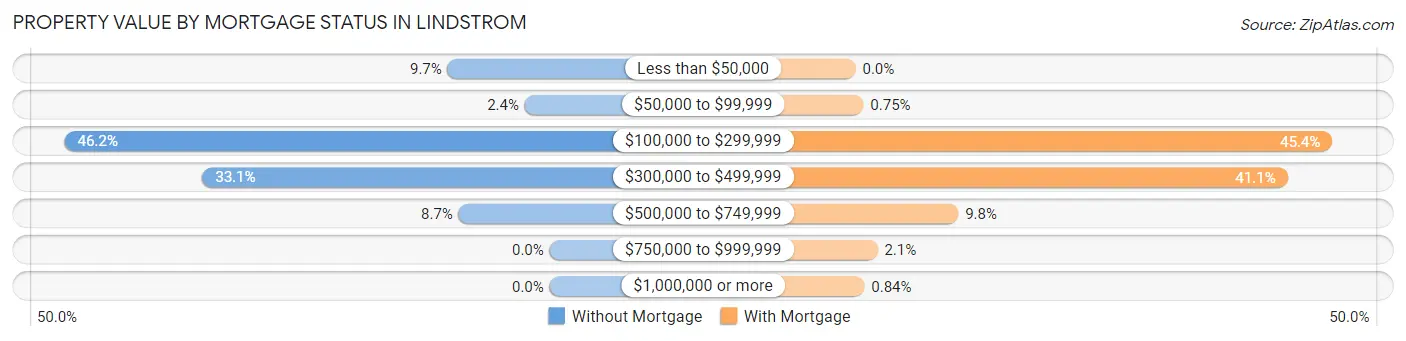
| Property Value | Without Mortgage | With Mortgage |
| Less than $50,000 | 37 (9.7%) | 0 (0.0%) |
| $50,000 to $99,999 | 9 (2.4%) | 9 (0.7%) |
| $100,000 to $299,999 | 176 (46.2%) | 543 (45.4%) |
| $300,000 to $499,999 | 126 (33.1%) | 492 (41.1%) |
| $500,000 to $749,999 | 33 (8.7%) | 117 (9.8%) |
| $750,000 to $999,999 | 0 (0.0%) | 25 (2.1%) |
| $1,000,000 or more | 0 (0.0%) | 10 (0.8%) |
| Total | 381 (100.0%) | 1,196 (100.0%) |
Household Income by Mortgage Status in Lindstrom
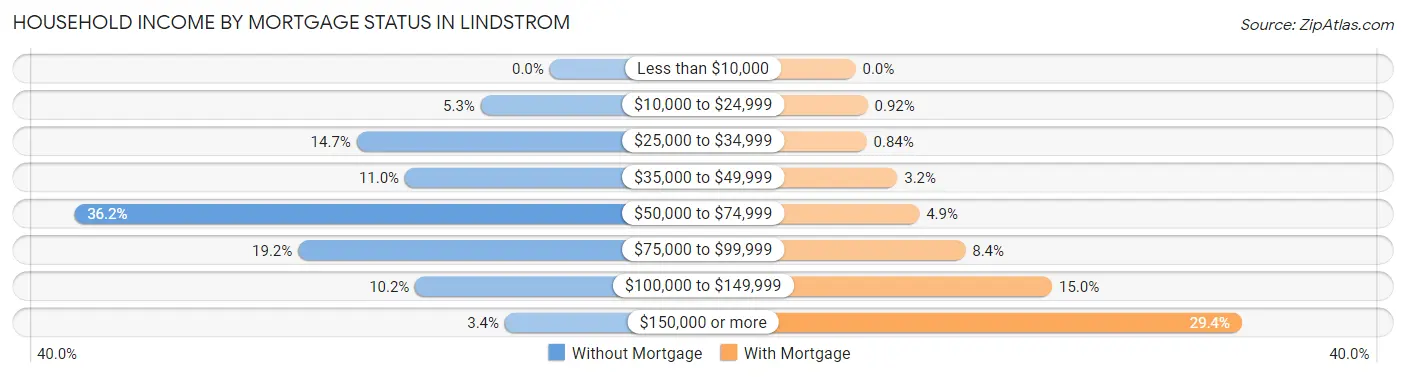
| Household Income | Without Mortgage | With Mortgage |
| Less than $10,000 | 0 (0.0%) | 0 (0.0%) |
| $10,000 to $24,999 | 20 (5.2%) | 11 (0.9%) |
| $25,000 to $34,999 | 56 (14.7%) | 10 (0.8%) |
| $35,000 to $49,999 | 42 (11.0%) | 38 (3.2%) |
| $50,000 to $74,999 | 138 (36.2%) | 58 (4.9%) |
| $75,000 to $99,999 | 73 (19.2%) | 100 (8.4%) |
| $100,000 to $149,999 | 39 (10.2%) | 179 (15.0%) |
| $150,000 or more | 13 (3.4%) | 352 (29.4%) |
| Total | 381 (100.0%) | 1,196 (100.0%) |
Property Value to Household Income Ratio in Lindstrom
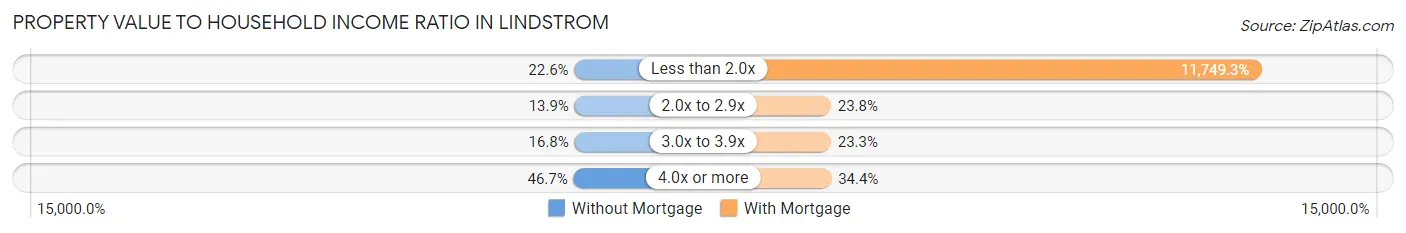
| Value-to-Income Ratio | Without Mortgage | With Mortgage |
| Less than 2.0x | 86 (22.6%) | 140,522 (11,749.3%) |
| 2.0x to 2.9x | 53 (13.9%) | 284 (23.7%) |
| 3.0x to 3.9x | 64 (16.8%) | 279 (23.3%) |
| 4.0x or more | 178 (46.7%) | 411 (34.4%) |
| Total | 381 (100.0%) | 1,196 (100.0%) |
Real Estate Taxes by Mortgage Status in Lindstrom
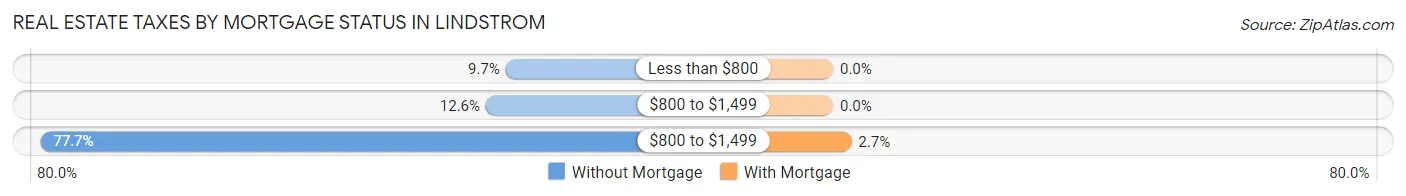
| Property Taxes | Without Mortgage | With Mortgage |
| Less than $800 | 37 (9.7%) | 0 (0.0%) |
| $800 to $1,499 | 48 (12.6%) | 0 (0.0%) |
| $800 to $1,499 | 296 (77.7%) | 32 (2.7%) |
| Total | 381 (100.0%) | 1,196 (100.0%) |
Health & Disability in Lindstrom
Health Insurance Coverage by Age in Lindstrom
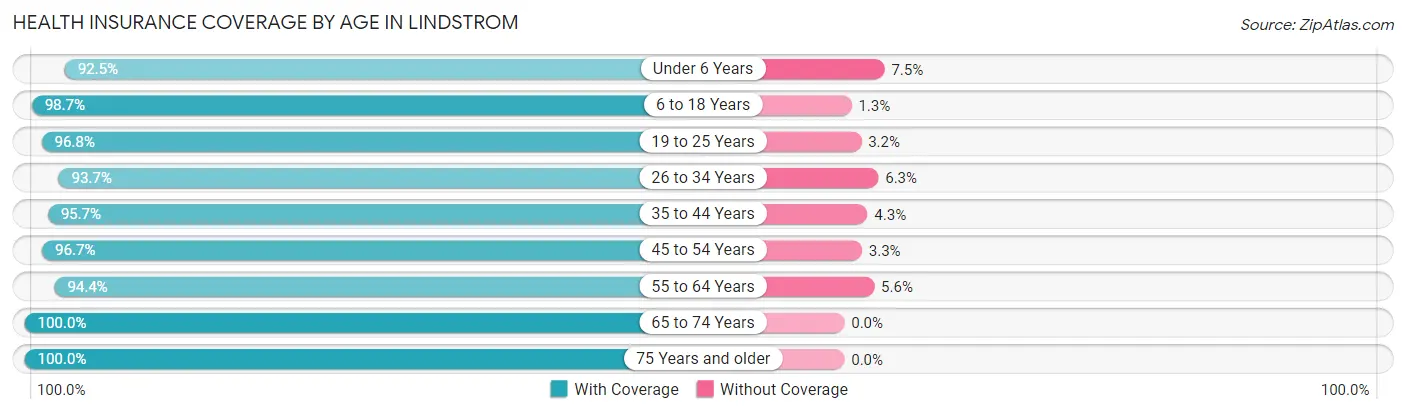
| Age Bracket | With Coverage | Without Coverage |
| Under 6 Years | 358 (92.5%) | 29 (7.5%) |
| 6 to 18 Years | 1,031 (98.7%) | 14 (1.3%) |
| 19 to 25 Years | 276 (96.8%) | 9 (3.2%) |
| 26 to 34 Years | 561 (93.7%) | 38 (6.3%) |
| 35 to 44 Years | 599 (95.7%) | 27 (4.3%) |
| 45 to 54 Years | 560 (96.7%) | 19 (3.3%) |
| 55 to 64 Years | 661 (94.4%) | 39 (5.6%) |
| 65 to 74 Years | 461 (100.0%) | 0 (0.0%) |
| 75 Years and older | 209 (100.0%) | 0 (0.0%) |
| Total | 4,716 (96.4%) | 175 (3.6%) |
Health Insurance Coverage by Citizenship Status in Lindstrom
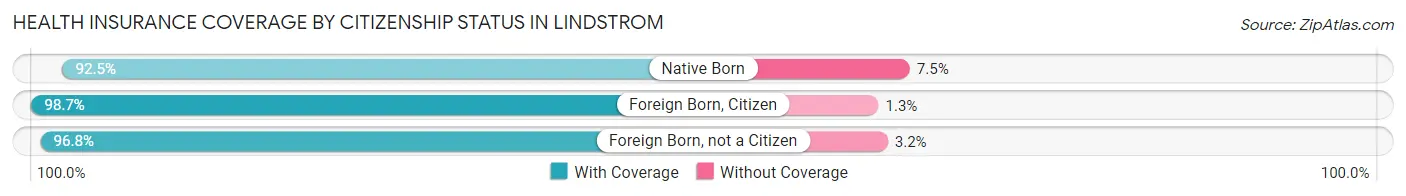
| Citizenship Status | With Coverage | Without Coverage |
| Native Born | 358 (92.5%) | 29 (7.5%) |
| Foreign Born, Citizen | 1,031 (98.7%) | 14 (1.3%) |
| Foreign Born, not a Citizen | 276 (96.8%) | 9 (3.2%) |
Health Insurance Coverage by Household Income in Lindstrom
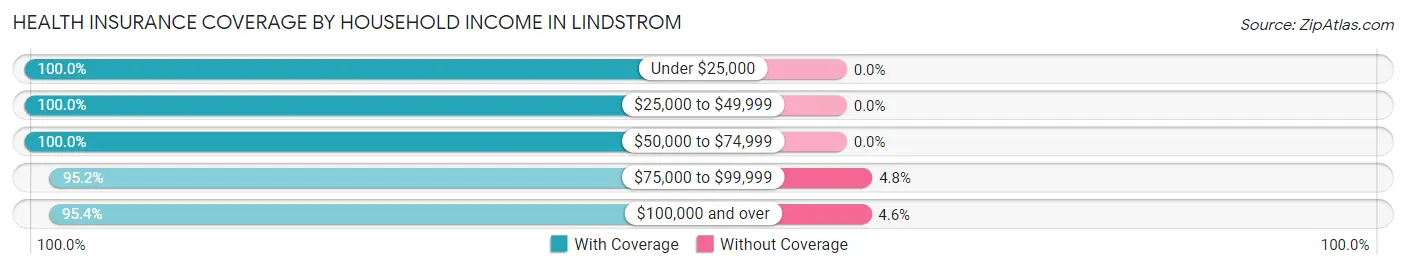
| Household Income | With Coverage | Without Coverage |
| Under $25,000 | 154 (100.0%) | 0 (0.0%) |
| $25,000 to $49,999 | 286 (100.0%) | 0 (0.0%) |
| $50,000 to $74,999 | 675 (100.0%) | 0 (0.0%) |
| $75,000 to $99,999 | 838 (95.2%) | 42 (4.8%) |
| $100,000 and over | 2,757 (95.4%) | 133 (4.6%) |
Public vs Private Health Insurance Coverage by Age in Lindstrom
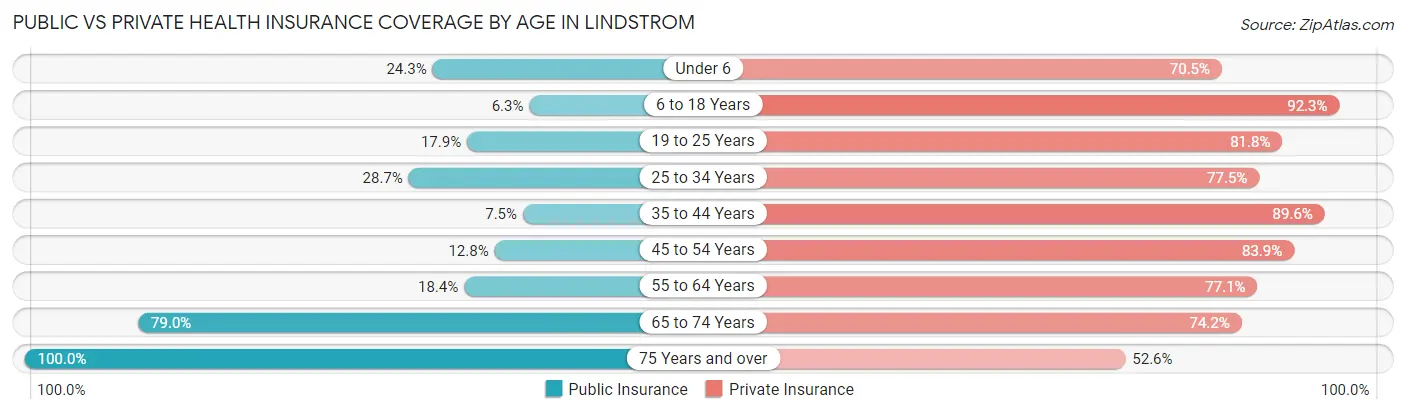
| Age Bracket | Public Insurance | Private Insurance |
| Under 6 | 94 (24.3%) | 273 (70.5%) |
| 6 to 18 Years | 66 (6.3%) | 965 (92.3%) |
| 19 to 25 Years | 51 (17.9%) | 233 (81.8%) |
| 25 to 34 Years | 172 (28.7%) | 464 (77.5%) |
| 35 to 44 Years | 47 (7.5%) | 561 (89.6%) |
| 45 to 54 Years | 74 (12.8%) | 486 (83.9%) |
| 55 to 64 Years | 129 (18.4%) | 540 (77.1%) |
| 65 to 74 Years | 364 (79.0%) | 342 (74.2%) |
| 75 Years and over | 209 (100.0%) | 110 (52.6%) |
| Total | 1,206 (24.7%) | 3,974 (81.2%) |
Disability Status by Sex by Age in Lindstrom
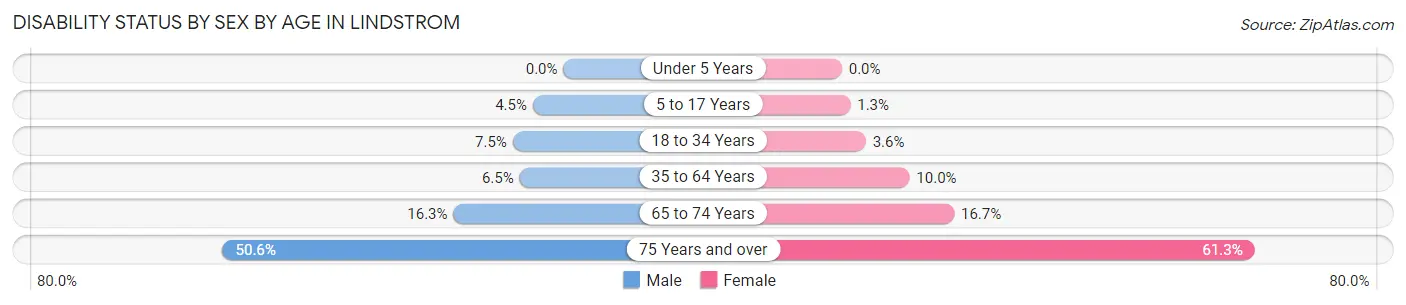
| Age Bracket | Male | Female |
| Under 5 Years | 0 (0.0%) | 0 (0.0%) |
| 5 to 17 Years | 26 (4.5%) | 6 (1.3%) |
| 18 to 34 Years | 37 (7.5%) | 15 (3.5%) |
| 35 to 64 Years | 63 (6.5%) | 94 (10.0%) |
| 65 to 74 Years | 41 (16.3%) | 35 (16.7%) |
| 75 Years and over | 43 (50.6%) | 76 (61.3%) |
Disability Class by Sex by Age in Lindstrom
Disability Class: Hearing Difficulty
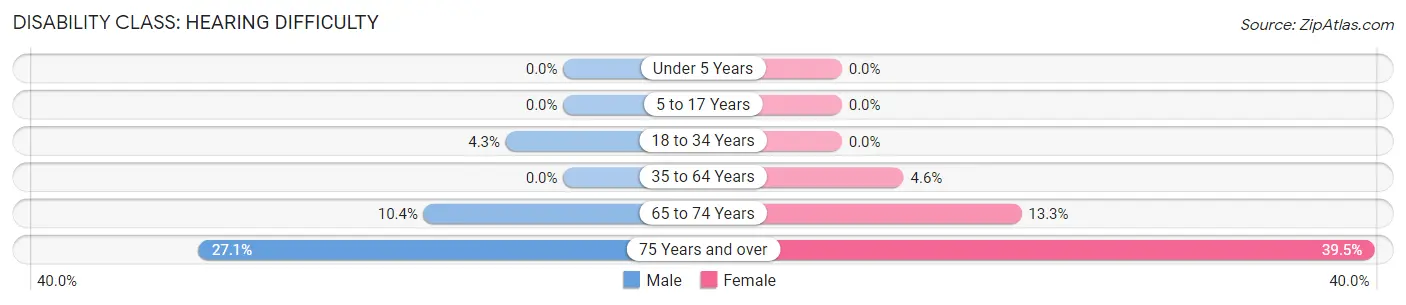
| Age Bracket | Male | Female |
| Under 5 Years | 0 (0.0%) | 0 (0.0%) |
| 5 to 17 Years | 0 (0.0%) | 0 (0.0%) |
| 18 to 34 Years | 21 (4.3%) | 0 (0.0%) |
| 35 to 64 Years | 0 (0.0%) | 43 (4.6%) |
| 65 to 74 Years | 26 (10.4%) | 28 (13.3%) |
| 75 Years and over | 23 (27.1%) | 49 (39.5%) |
Disability Class: Vision Difficulty
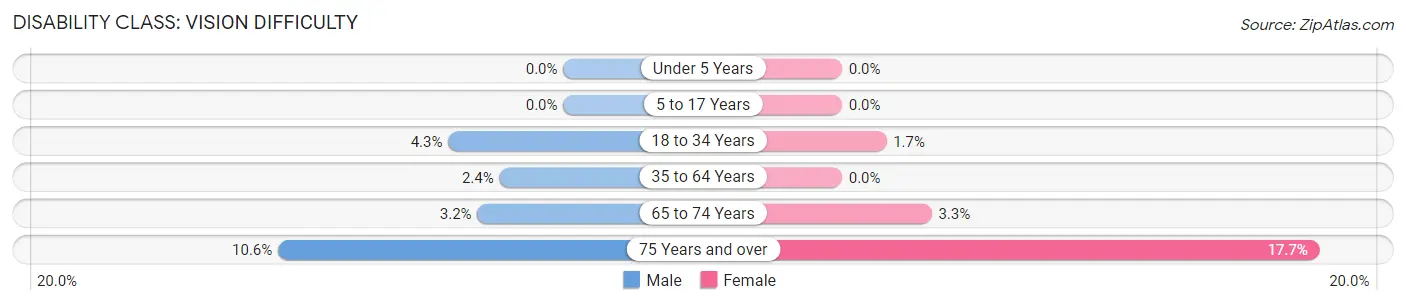
| Age Bracket | Male | Female |
| Under 5 Years | 0 (0.0%) | 0 (0.0%) |
| 5 to 17 Years | 0 (0.0%) | 0 (0.0%) |
| 18 to 34 Years | 21 (4.3%) | 7 (1.7%) |
| 35 to 64 Years | 23 (2.4%) | 0 (0.0%) |
| 65 to 74 Years | 8 (3.2%) | 7 (3.3%) |
| 75 Years and over | 9 (10.6%) | 22 (17.7%) |
Disability Class: Cognitive Difficulty
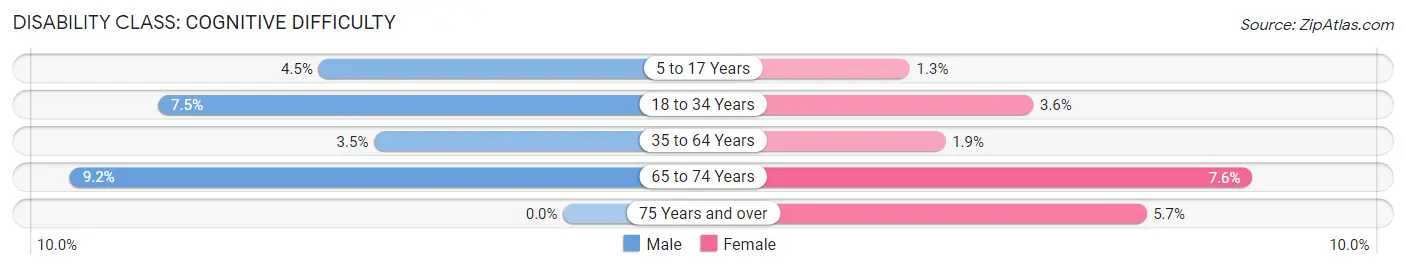
| Age Bracket | Male | Female |
| 5 to 17 Years | 26 (4.5%) | 6 (1.3%) |
| 18 to 34 Years | 37 (7.5%) | 15 (3.5%) |
| 35 to 64 Years | 34 (3.5%) | 18 (1.9%) |
| 65 to 74 Years | 23 (9.2%) | 16 (7.6%) |
| 75 Years and over | 0 (0.0%) | 7 (5.7%) |
Disability Class: Ambulatory Difficulty
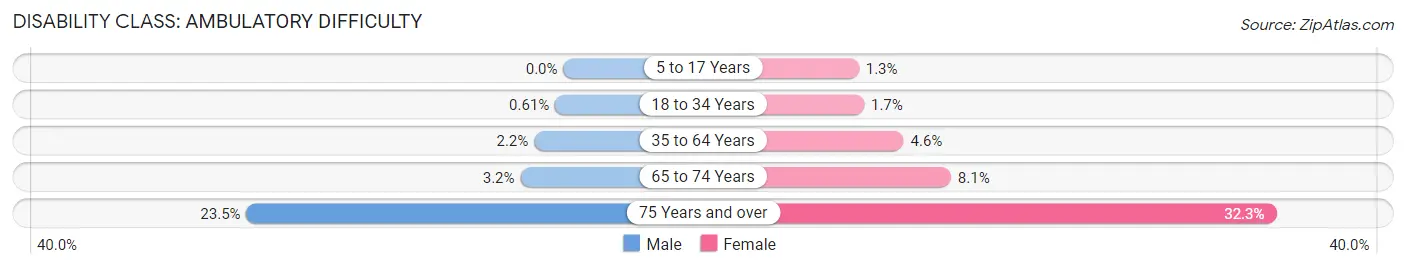
| Age Bracket | Male | Female |
| 5 to 17 Years | 0 (0.0%) | 6 (1.3%) |
| 18 to 34 Years | 3 (0.6%) | 7 (1.7%) |
| 35 to 64 Years | 21 (2.2%) | 43 (4.6%) |
| 65 to 74 Years | 8 (3.2%) | 17 (8.1%) |
| 75 Years and over | 20 (23.5%) | 40 (32.3%) |
Disability Class: Self-Care Difficulty
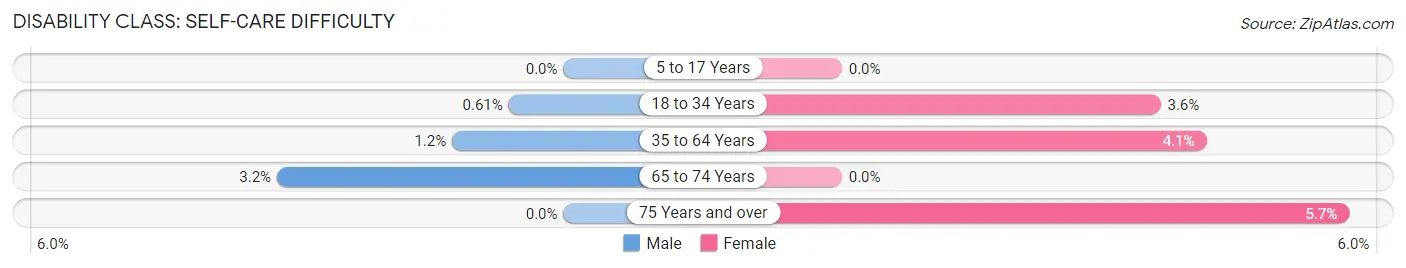
| Age Bracket | Male | Female |
| 5 to 17 Years | 0 (0.0%) | 0 (0.0%) |
| 18 to 34 Years | 3 (0.6%) | 15 (3.5%) |
| 35 to 64 Years | 12 (1.2%) | 38 (4.1%) |
| 65 to 74 Years | 8 (3.2%) | 0 (0.0%) |
| 75 Years and over | 0 (0.0%) | 7 (5.7%) |
Technology Access in Lindstrom
Computing Device Access in Lindstrom
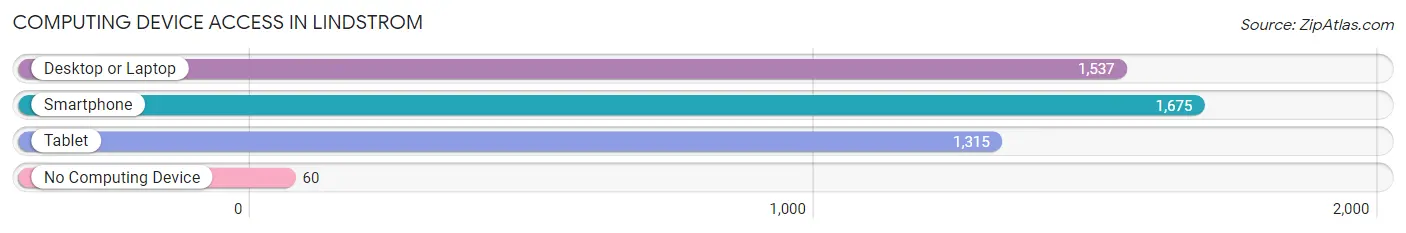
| Device Type | # Households | % Households |
| Desktop or Laptop | 1,537 | 85.0% |
| Smartphone | 1,675 | 92.6% |
| Tablet | 1,315 | 72.7% |
| No Computing Device | 60 | 3.3% |
| Total | 1,809 | 100.0% |
Internet Access in Lindstrom
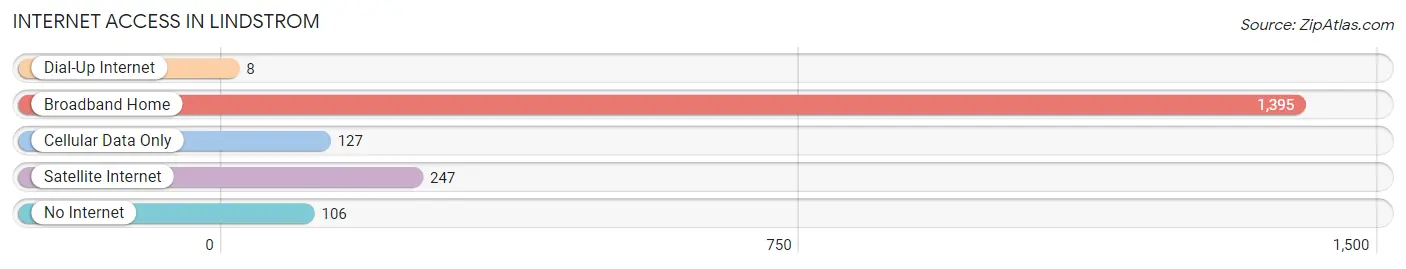
| Internet Type | # Households | % Households |
| Dial-Up Internet | 8 | 0.4% |
| Broadband Home | 1,395 | 77.1% |
| Cellular Data Only | 127 | 7.0% |
| Satellite Internet | 247 | 13.7% |
| No Internet | 106 | 5.9% |
| Total | 1,809 | 100.0% |
Lindstrom Summary
Lindstrom, Minnesota is a small city located in Chisago County, Minnesota. It is situated on the western edge of the Twin Cities metropolitan area, about 40 miles northeast of Minneapolis. The city has a population of 4,562 as of the 2010 census, making it the largest city in Chisago County.
History
The area that is now Lindstrom was first settled in the mid-1800s by Swedish immigrants. The city was officially incorporated in 1887, and was named after the Swedish immigrant, John Lindstrom, who was the first settler in the area.
The city of Lindstrom was originally a farming community, and the main crops grown were wheat, oats, and potatoes. In the early 1900s, the city began to grow and develop, and by the 1920s, it had become a popular tourist destination. The city was known for its many lakes, which attracted visitors from all over the region.
In the 1950s, the city began to experience a population boom, as many people moved to the area from the Twin Cities. This growth continued into the 1960s and 1970s, and the city's population reached its peak in the 1980s.
Geography
Lindstrom is located in Chisago County, Minnesota, about 40 miles northeast of Minneapolis. The city is situated on the western edge of the Twin Cities metropolitan area. The city is bordered by the cities of Chisago City, Center City, and Shafer.
The city is located on the shores of several lakes, including Chisago Lake, Green Lake, and South Lindstrom Lake. The city is also home to several parks, including the Chisago County Park, which features a beach, picnic areas, and a playground.
Economy
The economy of Lindstrom is largely based on tourism and retail. The city is home to several small businesses, including restaurants, shops, and other retail establishments. The city is also home to several manufacturing companies, including a paper mill and a plastics factory.
The city is also home to several large employers, including the Chisago County government, the Chisago County Hospital, and the Chisago County Schools. The city is also home to several small businesses, including restaurants, shops, and other retail establishments.
Demographics
As of the 2010 census, the population of Lindstrom was 4,562. The racial makeup of the city was 94.3% White, 0.7% African American, 0.3% Native American, 0.7% Asian, 0.1% Pacific Islander, 2.2% from other races, and 1.9% from two or more races. Hispanic or Latino of any race were 4.2% of the population.
The median household income in Lindstrom was $50,945, and the median family income was $60,917. The per capita income in Lindstrom was $25,945. About 6.3% of families and 8.2% of the population were below the poverty line, including 10.3% of those under age 18 and 6.2% of those age 65 or over.
Conclusion
Lindstrom, Minnesota is a small city located in Chisago County, Minnesota. It is situated on the western edge of the Twin Cities metropolitan area, about 40 miles northeast of Minneapolis. The city has a population of 4,562 as of the 2010 census, making it the largest city in Chisago County. The economy of Lindstrom is largely based on tourism and retail, and the city is home to several large employers, including the Chisago County government, the Chisago County Hospital, and the Chisago County Schools. The racial makeup of the city was 94.3% White, 0.7% African American, 0.3% Native American, 0.7% Asian, 0.1% Pacific Islander, 2.2% from other races, and 1.9% from two or more races. The median household income in Lindstrom was $50,945, and the median family income was $60,917. Lindstrom is a small city with a rich history and a vibrant economy.
Common Questions
What is Per Capita Income in Lindstrom?
Per Capita income in Lindstrom is $41,792.
What is the Median Family Income in Lindstrom?
Median Family Income in Lindstrom is $124,508.
What is the Median Household income in Lindstrom?
Median Household Income in Lindstrom is $98,456.
What is Income or Wage Gap in Lindstrom?
Income or Wage Gap in Lindstrom is 32.3%.
Women in Lindstrom earn 67.7 cents for every dollar earned by a man.
What is Inequality or Gini Index in Lindstrom?
Inequality or Gini Index in Lindstrom is 0.36.
What is the Total Population of Lindstrom?
Total Population of Lindstrom is 4,891.
What is the Total Male Population of Lindstrom?
Total Male Population of Lindstrom is 2,520.
What is the Total Female Population of Lindstrom?
Total Female Population of Lindstrom is 2,371.
What is the Ratio of Males per 100 Females in Lindstrom?
There are 106.28 Males per 100 Females in Lindstrom.
What is the Ratio of Females per 100 Males in Lindstrom?
There are 94.09 Females per 100 Males in Lindstrom.
What is the Median Population Age in Lindstrom?
Median Population Age in Lindstrom is 37.4 Years.
What is the Average Family Size in Lindstrom
Average Family Size in Lindstrom is 3.1 People.
What is the Average Household Size in Lindstrom
Average Household Size in Lindstrom is 2.7 People.
How Large is the Labor Force in Lindstrom?
There are 2,726 People in the Labor Forcein in Lindstrom.
What is the Percentage of People in the Labor Force in Lindstrom?
71.9% of People are in the Labor Force in Lindstrom.
What is the Unemployment Rate in Lindstrom?
Unemployment Rate in Lindstrom is 2.8%.