Little Falls, MN Map & Demographics
Little Falls Map
Little Falls Overview
$29,248
PER CAPITA INCOME
$62,045
AVG FAMILY INCOME
$44,455
AVG HOUSEHOLD INCOME
37.7%
WAGE / INCOME GAP [ % ]
62.3¢/ $1
WAGE / INCOME GAP [ $ ]
0.45
INEQUALITY / GINI INDEX
9,084
TOTAL POPULATION
4,138
MALE POPULATION
4,946
FEMALE POPULATION
83.66
MALES / 100 FEMALES
119.53
FEMALES / 100 MALES
40.8
MEDIAN AGE
2.8
AVG FAMILY SIZE
2.2
AVG HOUSEHOLD SIZE
4,045
LABOR FORCE [ PEOPLE ]
55.5%
PERCENT IN LABOR FORCE
6.0%
UNEMPLOYMENT RATE
Little Falls Zip Codes
Little Falls Area Codes
Income in Little Falls
Income Overview in Little Falls
Per Capita Income in Little Falls is $29,248, while median incomes of families and households are $62,045 and $44,455 respectively.
| Characteristic | Number | Measure |
| Per Capita Income | 9,084 | $29,248 |
| Median Family Income | 2,224 | $62,045 |
| Mean Family Income | 2,224 | $77,992 |
| Median Household Income | 3,954 | $44,455 |
| Mean Household Income | 3,954 | $62,324 |
| Income Deficit | 2,224 | $0 |
| Wage / Income Gap (%) | 9,084 | 37.72% |
| Wage / Income Gap ($) | 9,084 | 62.28¢ per $1 |
| Gini / Inequality Index | 9,084 | 0.45 |
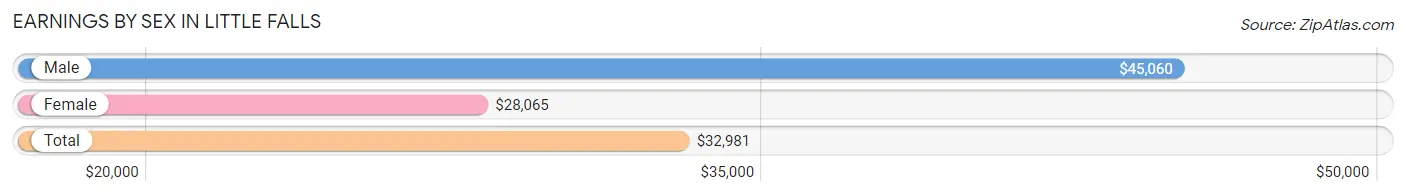
Earnings by Sex in Little Falls
Average Earnings in Little Falls are $32,981, $45,060 for men and $28,065 for women, a difference of 37.7%.
| Sex | Number | Average Earnings |
| Male | 2,076 (48.5%) | $45,060 |
| Female | 2,204 (51.5%) | $28,065 |
| Total | 4,280 (100.0%) | $32,981 |
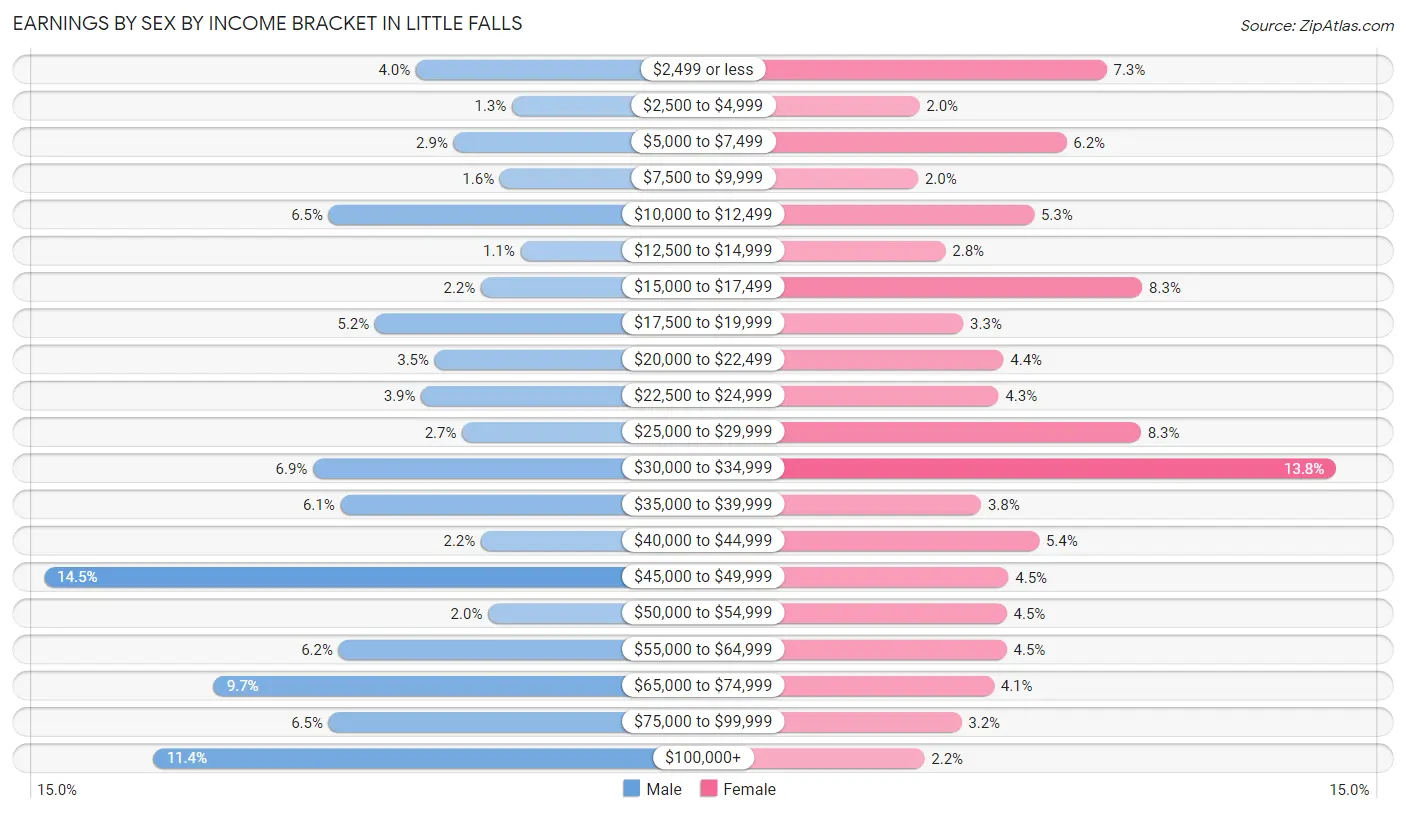
Earnings by Sex by Income Bracket in Little Falls
The most common earnings brackets in Little Falls are $45,000 to $49,999 for men (300 | 14.4%) and $30,000 to $34,999 for women (303 | 13.8%).
| Income | Male | Female |
| $2,499 or less | 83 (4.0%) | 161 (7.3%) |
| $2,500 to $4,999 | 27 (1.3%) | 45 (2.0%) |
| $5,000 to $7,499 | 61 (2.9%) | 136 (6.2%) |
| $7,500 to $9,999 | 34 (1.6%) | 44 (2.0%) |
| $10,000 to $12,499 | 134 (6.5%) | 116 (5.3%) |
| $12,500 to $14,999 | 22 (1.1%) | 61 (2.8%) |
| $15,000 to $17,499 | 45 (2.2%) | 183 (8.3%) |
| $17,500 to $19,999 | 107 (5.1%) | 72 (3.3%) |
| $20,000 to $22,499 | 72 (3.5%) | 97 (4.4%) |
| $22,500 to $24,999 | 80 (3.8%) | 94 (4.3%) |
| $25,000 to $29,999 | 56 (2.7%) | 182 (8.3%) |
| $30,000 to $34,999 | 143 (6.9%) | 303 (13.8%) |
| $35,000 to $39,999 | 127 (6.1%) | 83 (3.8%) |
| $40,000 to $44,999 | 45 (2.2%) | 119 (5.4%) |
| $45,000 to $49,999 | 300 (14.4%) | 100 (4.5%) |
| $50,000 to $54,999 | 41 (2.0%) | 99 (4.5%) |
| $55,000 to $64,999 | 128 (6.2%) | 99 (4.5%) |
| $65,000 to $74,999 | 201 (9.7%) | 91 (4.1%) |
| $75,000 to $99,999 | 134 (6.5%) | 71 (3.2%) |
| $100,000+ | 236 (11.4%) | 48 (2.2%) |
| Total | 2,076 (100.0%) | 2,204 (100.0%) |
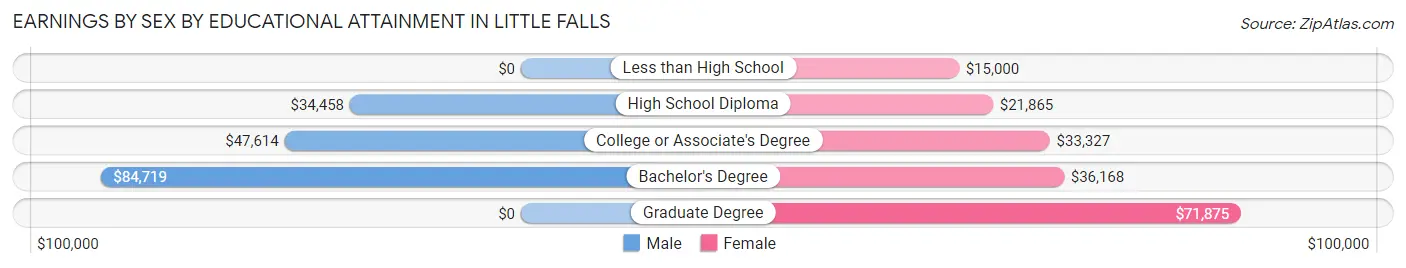
Earnings by Sex by Educational Attainment in Little Falls
Average earnings in Little Falls are $45,818 for men and $30,582 for women, a difference of 33.3%. Men with an educational attainment of bachelor's degree enjoy the highest average annual earnings of $84,719, while those with high school diploma education earn the least with $34,458. Women with an educational attainment of graduate degree earn the most with the average annual earnings of $71,875, while those with less than high school education have the smallest earnings of $15,000.
| Educational Attainment | Male Income | Female Income |
| Less than High School | - | - |
| High School Diploma | $34,458 | $21,865 |
| College or Associate's Degree | $47,614 | $33,327 |
| Bachelor's Degree | $84,719 | $36,168 |
| Graduate Degree | - | - |
| Total | $45,818 | $30,582 |
Family Income in Little Falls
Family Income Brackets in Little Falls
According to the Little Falls family income data, there are 465 families falling into the $50,000 to $74,999 income range, which is the most common income bracket and makes up 20.9% of all families. Conversely, the $10,000 to $14,999 income bracket is the least frequent group with only 47 families (2.1%) belonging to this category.
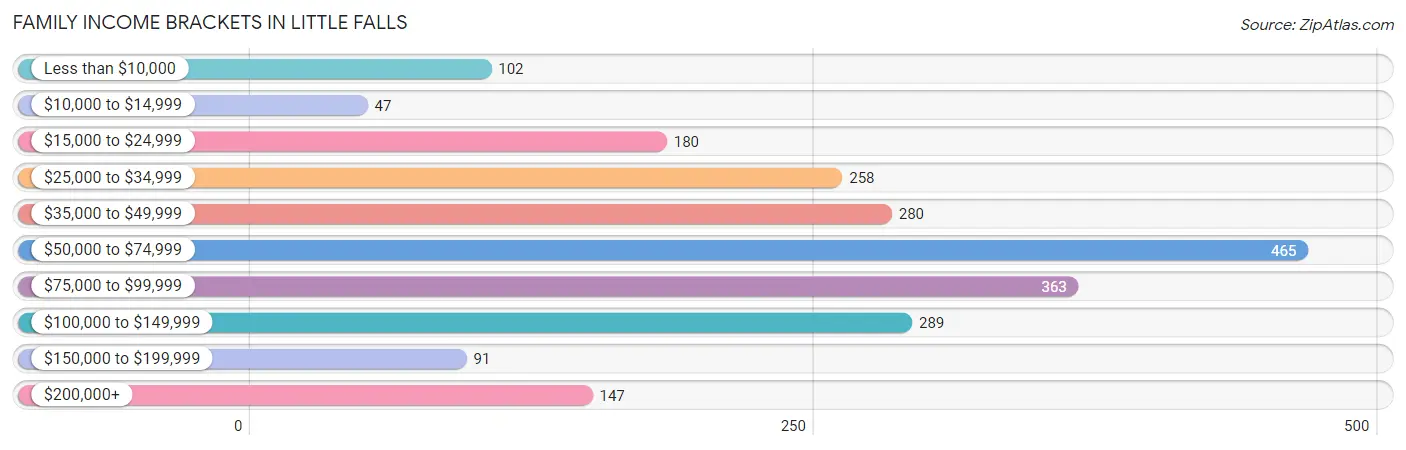
| Income Bracket | # Families | % Families |
| Less than $10,000 | 102 | 4.6% |
| $10,000 to $14,999 | 47 | 2.1% |
| $15,000 to $24,999 | 180 | 8.1% |
| $25,000 to $34,999 | 258 | 11.6% |
| $35,000 to $49,999 | 280 | 12.6% |
| $50,000 to $74,999 | 465 | 20.9% |
| $75,000 to $99,999 | 363 | 16.3% |
| $100,000 to $149,999 | 289 | 13.0% |
| $150,000 to $199,999 | 91 | 4.1% |
| $200,000+ | 147 | 6.6% |
Family Income by Famaliy Size in Little Falls
6-person families (43 | 1.9%) account for the highest median family income in Little Falls with $99,375 per family, while 3-person families (462 | 20.8%) have the highest median income of $22,602 per family member.
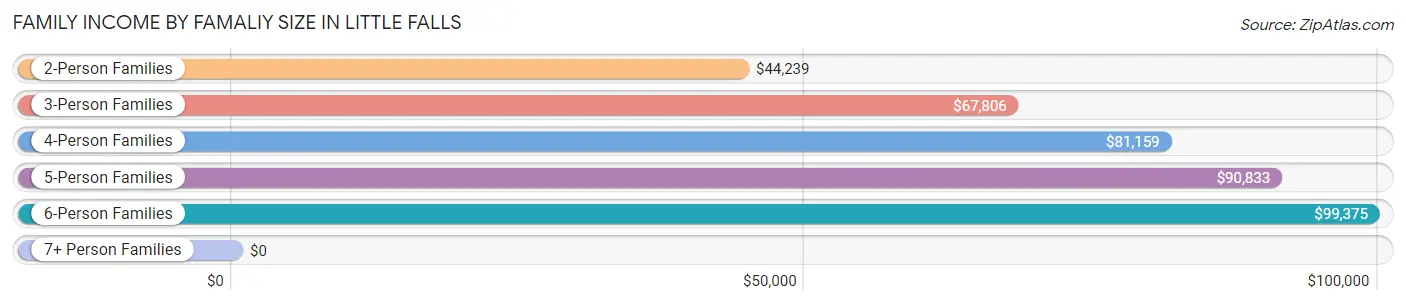
| Income Bracket | # Families | Median Income |
| 2-Person Families | 1,312 (59.0%) | $44,239 |
| 3-Person Families | 462 (20.8%) | $67,806 |
| 4-Person Families | 278 (12.5%) | $81,159 |
| 5-Person Families | 118 (5.3%) | $90,833 |
| 6-Person Families | 43 (1.9%) | $99,375 |
| 7+ Person Families | 11 (0.5%) | $0 |
| Total | 2,224 (100.0%) | $62,045 |
Family Income by Number of Earners in Little Falls
The median family income in Little Falls is $62,045, with families comprising 3+ earners (121) having the highest median family income of $116,875, while families with no earners (521) have the lowest median family income of $36,797, accounting for 5.4% and 23.4% of families, respectively.
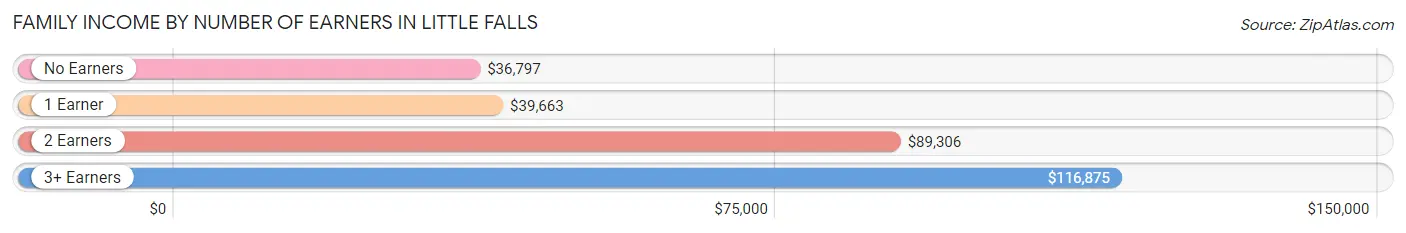
| Number of Earners | # Families | Median Income |
| No Earners | 521 (23.4%) | $36,797 |
| 1 Earner | 856 (38.5%) | $39,663 |
| 2 Earners | 726 (32.6%) | $89,306 |
| 3+ Earners | 121 (5.4%) | $116,875 |
| Total | 2,224 (100.0%) | $62,045 |
Household Income in Little Falls
Household Income Brackets in Little Falls
With 720 households falling in the category, the $50,000 to $74,999 income range is the most frequent in Little Falls, accounting for 18.2% of all households. In contrast, only 142 households (3.6%) fall into the $150,000 to $199,999 income bracket, making it the least populous group.
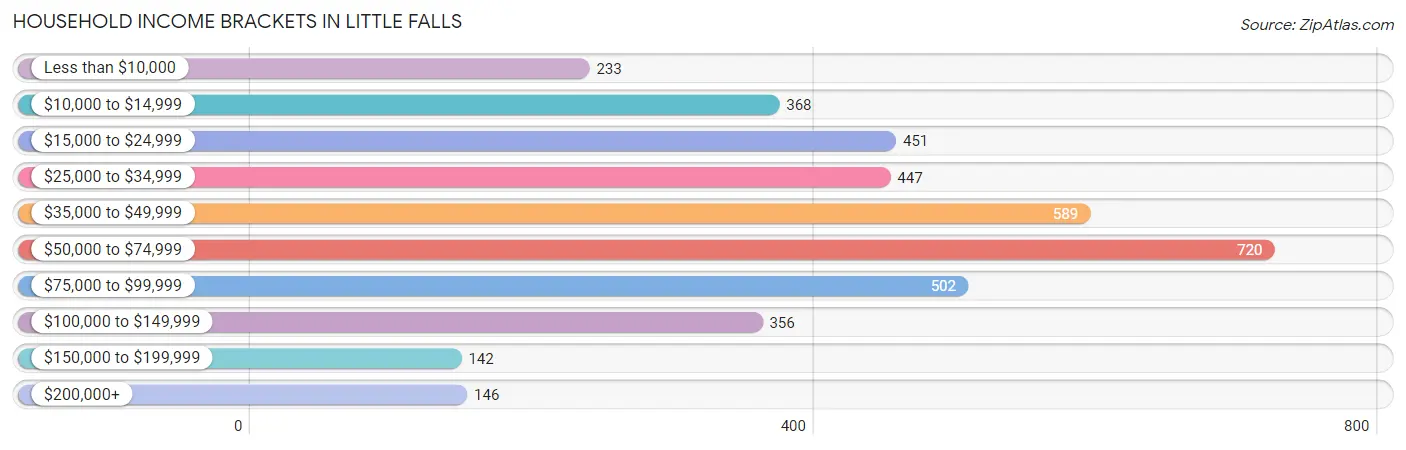
| Income Bracket | # Households | % Households |
| Less than $10,000 | 233 | 5.9% |
| $10,000 to $14,999 | 368 | 9.3% |
| $15,000 to $24,999 | 451 | 11.4% |
| $25,000 to $34,999 | 447 | 11.3% |
| $35,000 to $49,999 | 589 | 14.9% |
| $50,000 to $74,999 | 720 | 18.2% |
| $75,000 to $99,999 | 502 | 12.7% |
| $100,000 to $149,999 | 356 | 9.0% |
| $150,000 to $199,999 | 142 | 3.6% |
| $200,000+ | 146 | 3.7% |
Household Income by Householder Age in Little Falls
The median household income in Little Falls is $44,455, with the highest median household income of $73,767 found in the 15 to 24 years age bracket for the primary householder. A total of 116 households (2.9%) fall into this category. Meanwhile, the 65+ years age bracket for the primary householder has the lowest median household income of $30,960, with 1,418 households (35.9%) in this group.
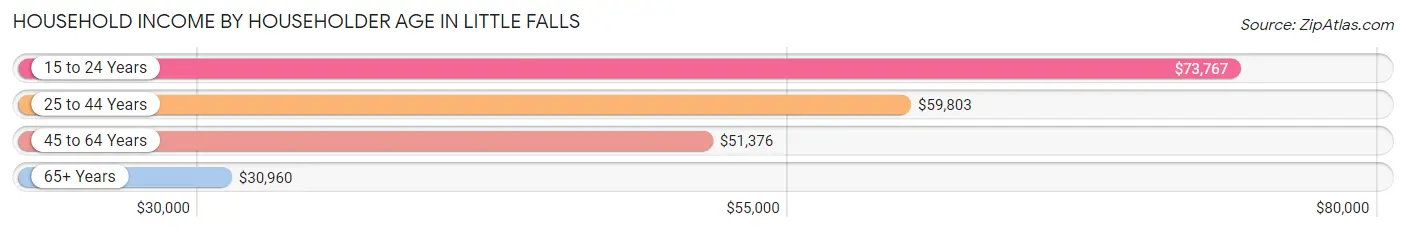
| Income Bracket | # Households | Median Income |
| 15 to 24 Years | 116 (2.9%) | $73,767 |
| 25 to 44 Years | 1,233 (31.2%) | $59,803 |
| 45 to 64 Years | 1,187 (30.0%) | $51,376 |
| 65+ Years | 1,418 (35.9%) | $30,960 |
| Total | 3,954 (100.0%) | $44,455 |
Poverty in Little Falls
Income Below Poverty by Sex and Age in Little Falls
With 13.7% poverty level for males and 21.0% for females among the residents of Little Falls, under 5 year old males and 16 and 17 year old females are the most vulnerable to poverty, with 107 males (37.9%) and 46 females (47.4%) in their respective age groups living below the poverty level.
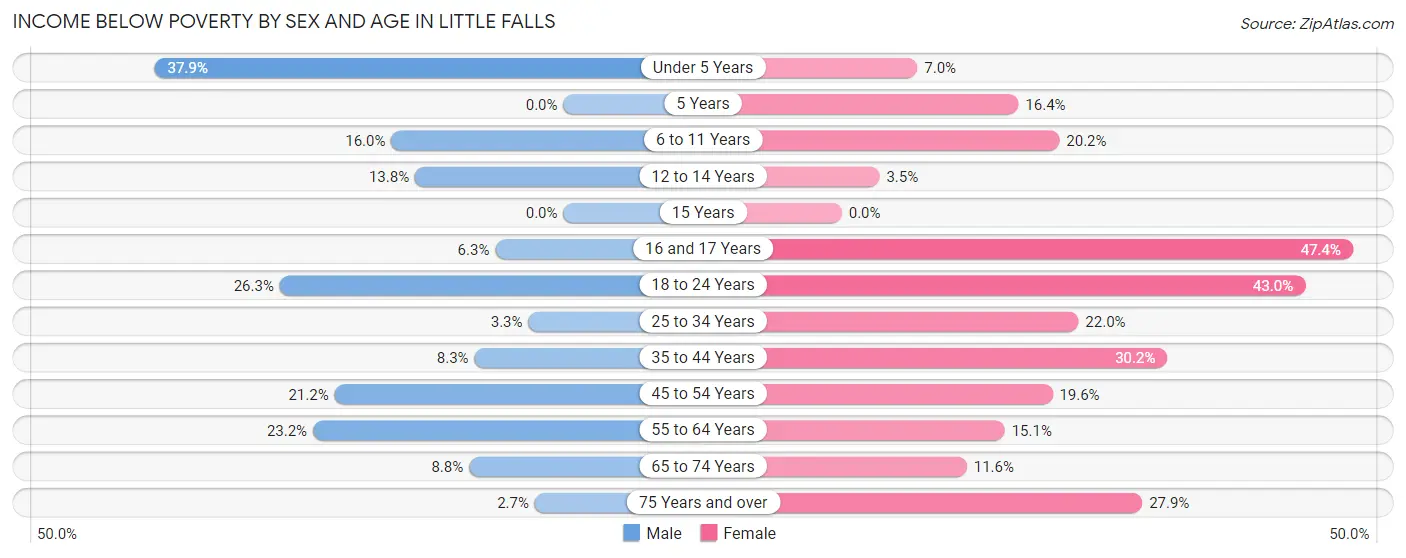
| Age Bracket | Male | Female |
| Under 5 Years | 107 (37.9%) | 19 (7.0%) |
| 5 Years | 0 (0.0%) | 10 (16.4%) |
| 6 to 11 Years | 50 (16.0%) | 63 (20.2%) |
| 12 to 14 Years | 19 (13.8%) | 5 (3.5%) |
| 15 Years | 0 (0.0%) | 0 (0.0%) |
| 16 and 17 Years | 6 (6.3%) | 46 (47.4%) |
| 18 to 24 Years | 70 (26.3%) | 141 (43.0%) |
| 25 to 34 Years | 21 (3.3%) | 137 (22.0%) |
| 35 to 44 Years | 48 (8.3%) | 148 (30.2%) |
| 45 to 54 Years | 65 (21.2%) | 69 (19.6%) |
| 55 to 64 Years | 119 (23.2%) | 96 (15.1%) |
| 65 to 74 Years | 35 (8.7%) | 81 (11.6%) |
| 75 Years and over | 9 (2.6%) | 196 (27.9%) |
| Total | 549 (13.7%) | 1,011 (21.0%) |
Income Above Poverty by Sex and Age in Little Falls
According to the poverty statistics in Little Falls, males aged 5 years and females aged 15 years are the age groups that are most secure financially, with 100.0% of males and 100.0% of females in these age groups living above the poverty line.
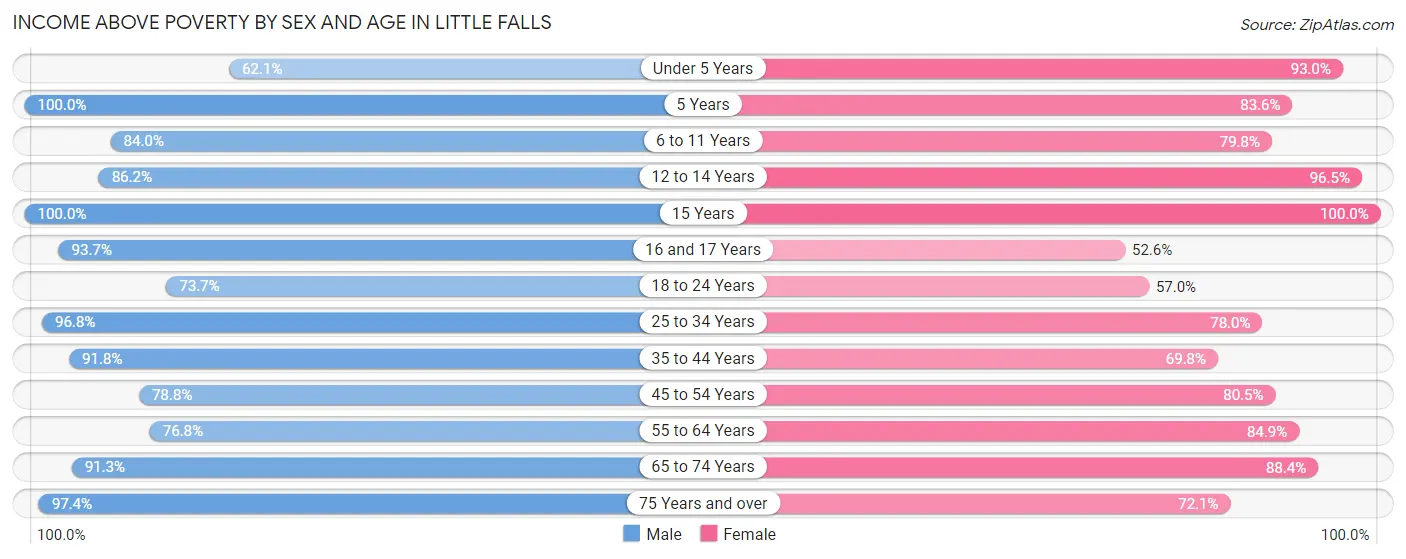
| Age Bracket | Male | Female |
| Under 5 Years | 175 (62.1%) | 252 (93.0%) |
| 5 Years | 104 (100.0%) | 51 (83.6%) |
| 6 to 11 Years | 263 (84.0%) | 249 (79.8%) |
| 12 to 14 Years | 119 (86.2%) | 138 (96.5%) |
| 15 Years | 27 (100.0%) | 90 (100.0%) |
| 16 and 17 Years | 89 (93.7%) | 51 (52.6%) |
| 18 to 24 Years | 196 (73.7%) | 187 (57.0%) |
| 25 to 34 Years | 626 (96.8%) | 487 (78.0%) |
| 35 to 44 Years | 534 (91.7%) | 342 (69.8%) |
| 45 to 54 Years | 241 (78.8%) | 284 (80.4%) |
| 55 to 64 Years | 393 (76.8%) | 539 (84.9%) |
| 65 to 74 Years | 365 (91.2%) | 617 (88.4%) |
| 75 Years and over | 330 (97.4%) | 507 (72.1%) |
| Total | 3,462 (86.3%) | 3,794 (79.0%) |
Income Below Poverty Among Married-Couple Families in Little Falls
The poverty statistics for married-couple families in Little Falls show that 9.5% or 140 of the total 1,467 families live below the poverty line. Families with 1 or 2 children have the highest poverty rate of 16.8%, comprising of 50 families. On the other hand, families with 3 or 4 children have the lowest poverty rate of 0.0%, which includes 0 families.
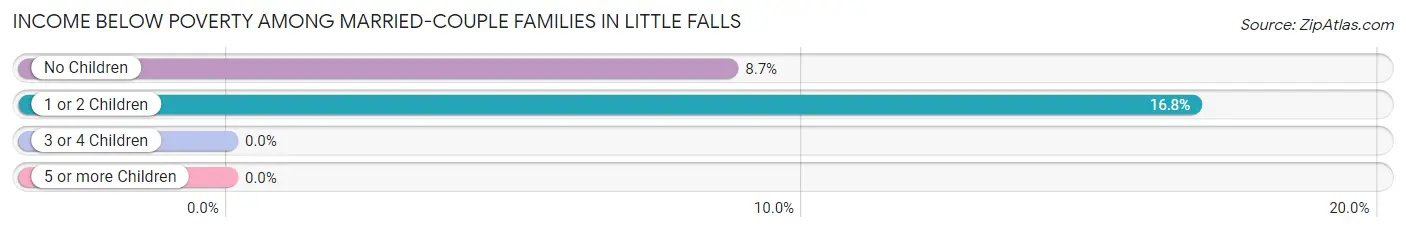
| Children | Above Poverty | Below Poverty |
| No Children | 943 (91.3%) | 90 (8.7%) |
| 1 or 2 Children | 248 (83.2%) | 50 (16.8%) |
| 3 or 4 Children | 125 (100.0%) | 0 (0.0%) |
| 5 or more Children | 11 (100.0%) | 0 (0.0%) |
| Total | 1,327 (90.5%) | 140 (9.5%) |
Income Below Poverty Among Single-Parent Households in Little Falls
According to the poverty data in Little Falls, 2.6% or 5 single-father households and 25.8% or 145 single-mother households are living below the poverty line. Among single-father households, those with 1 or 2 children have the highest poverty rate, with 5 households (3.1%) experiencing poverty. Likewise, among single-mother households, those with 3 or 4 children have the highest poverty rate, with 36 households (100.0%) falling below the poverty line.
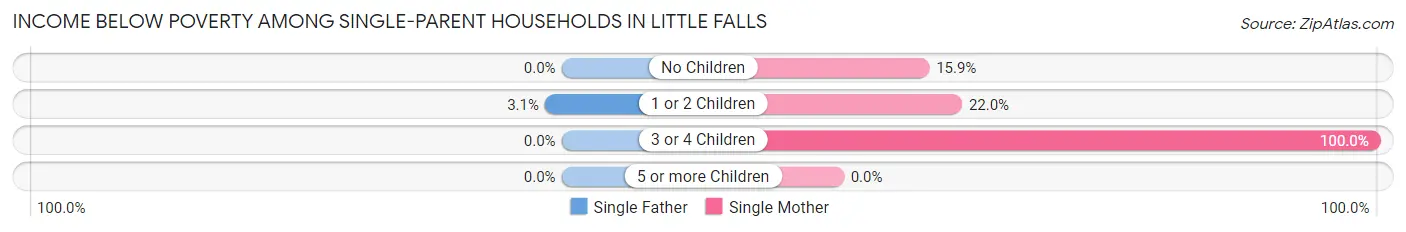
| Children | Single Father | Single Mother |
| No Children | 0 (0.0%) | 18 (15.9%) |
| 1 or 2 Children | 5 (3.1%) | 91 (22.0%) |
| 3 or 4 Children | 0 (0.0%) | 36 (100.0%) |
| 5 or more Children | 0 (0.0%) | 0 (0.0%) |
| Total | 5 (2.6%) | 145 (25.8%) |
Income Below Poverty Among Married-Couple vs Single-Parent Households in Little Falls
The poverty data for Little Falls shows that 140 of the married-couple family households (9.5%) and 150 of the single-parent households (19.8%) are living below the poverty level. Within the married-couple family households, those with 1 or 2 children have the highest poverty rate, with 50 households (16.8%) falling below the poverty line. Among the single-parent households, those with 3 or 4 children have the highest poverty rate, with 36 household (56.2%) living below poverty.
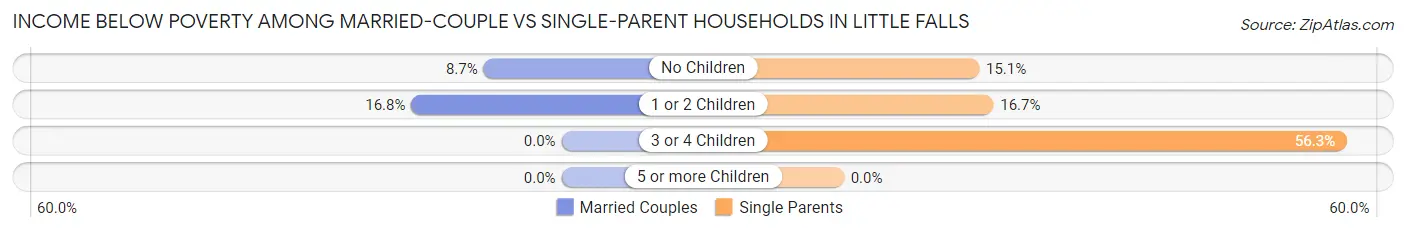
| Children | Married-Couple Families | Single-Parent Households |
| No Children | 90 (8.7%) | 18 (15.1%) |
| 1 or 2 Children | 50 (16.8%) | 96 (16.7%) |
| 3 or 4 Children | 0 (0.0%) | 36 (56.2%) |
| 5 or more Children | 0 (0.0%) | 0 (0.0%) |
| Total | 140 (9.5%) | 150 (19.8%) |
Race in Little Falls
The most populous races in Little Falls are White / Caucasian (8,654 | 95.3%), Two or more Races (286 | 3.2%), and Hispanic or Latino (134 | 1.5%).
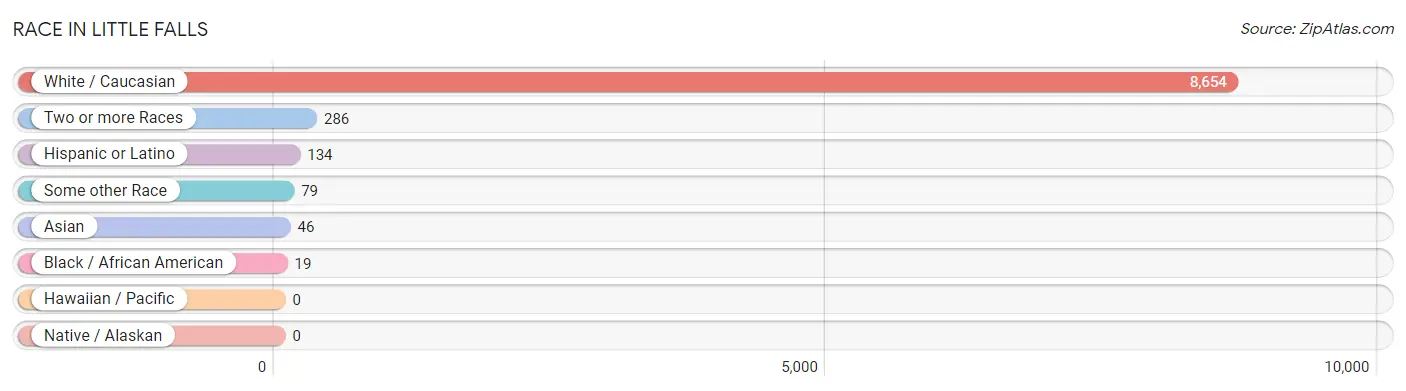
| Race | # Population | % Population |
| Asian | 46 | 0.5% |
| Black / African American | 19 | 0.2% |
| Hawaiian / Pacific | 0 | 0.0% |
| Hispanic or Latino | 134 | 1.5% |
| Native / Alaskan | 0 | 0.0% |
| White / Caucasian | 8,654 | 95.3% |
| Two or more Races | 286 | 3.2% |
| Some other Race | 79 | 0.9% |
| Total | 9,084 | 100.0% |
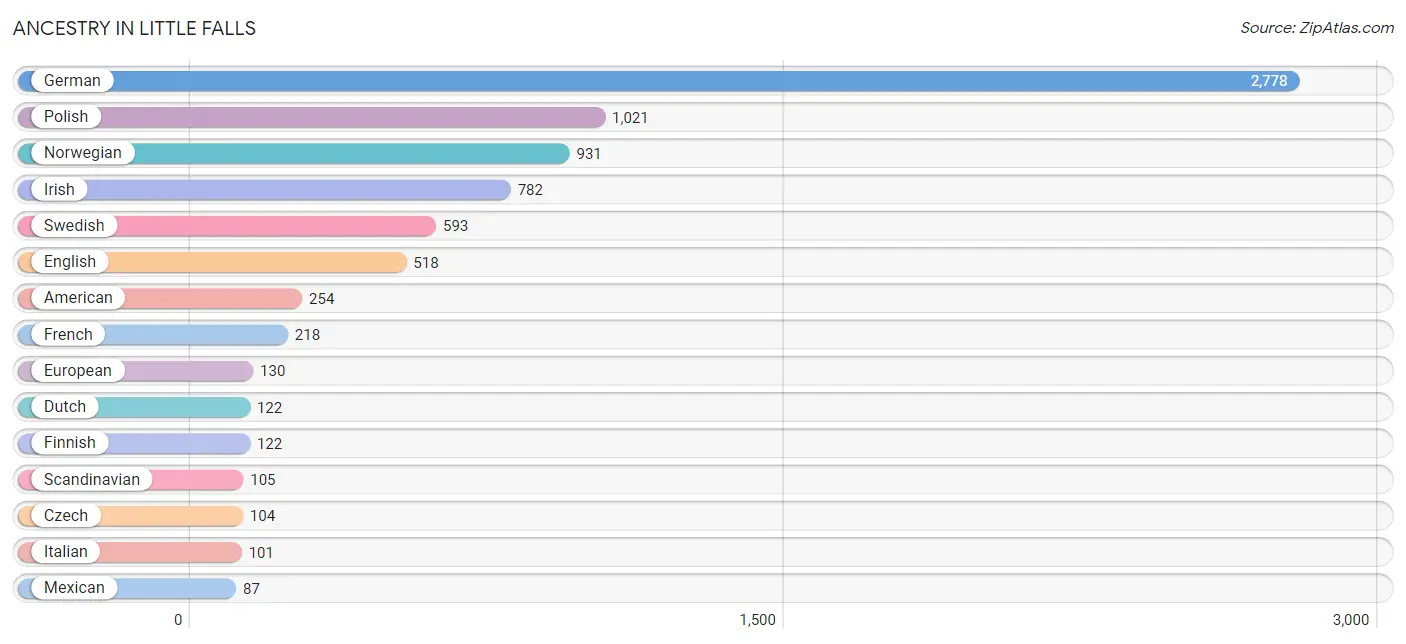
Ancestry in Little Falls
The most populous ancestries reported in Little Falls are German (2,778 | 30.6%), Polish (1,021 | 11.2%), Norwegian (931 | 10.2%), Irish (782 | 8.6%), and Swedish (593 | 6.5%), together accounting for 67.2% of all Little Falls residents.
| Ancestry | # Population | % Population |
| African | 8 | 0.1% |
| American | 254 | 2.8% |
| Austrian | 36 | 0.4% |
| Belizean | 16 | 0.2% |
| Burmese | 49 | 0.5% |
| Canadian | 12 | 0.1% |
| Central American | 1 | 0.0% |
| Cherokee | 10 | 0.1% |
| Croatian | 7 | 0.1% |
| Czech | 104 | 1.1% |
| Czechoslovakian | 19 | 0.2% |
| Danish | 43 | 0.5% |
| Dutch | 122 | 1.3% |
| Eastern European | 6 | 0.1% |
| English | 518 | 5.7% |
| European | 130 | 1.4% |
| Finnish | 122 | 1.3% |
| French | 218 | 2.4% |
| French Canadian | 46 | 0.5% |
| German | 2,778 | 30.6% |
| Ghanaian | 13 | 0.1% |
| Honduran | 1 | 0.0% |
| Hungarian | 24 | 0.3% |
| Icelander | 3 | 0.0% |
| Irish | 782 | 8.6% |
| Italian | 101 | 1.1% |
| Korean | 39 | 0.4% |
| Malaysian | 11 | 0.1% |
| Mexican | 87 | 1.0% |
| Norwegian | 931 | 10.2% |
| Polish | 1,021 | 11.2% |
| Puerto Rican | 46 | 0.5% |
| Russian | 17 | 0.2% |
| Scandinavian | 105 | 1.2% |
| Scotch-Irish | 39 | 0.4% |
| Scottish | 32 | 0.4% |
| Serbian | 10 | 0.1% |
| Sioux | 2 | 0.0% |
| Sri Lankan | 24 | 0.3% |
| Subsaharan African | 21 | 0.2% |
| Swedish | 593 | 6.5% |
| Swiss | 3 | 0.0% |
| Yugoslavian | 7 | 0.1% | View All 43 Rows |
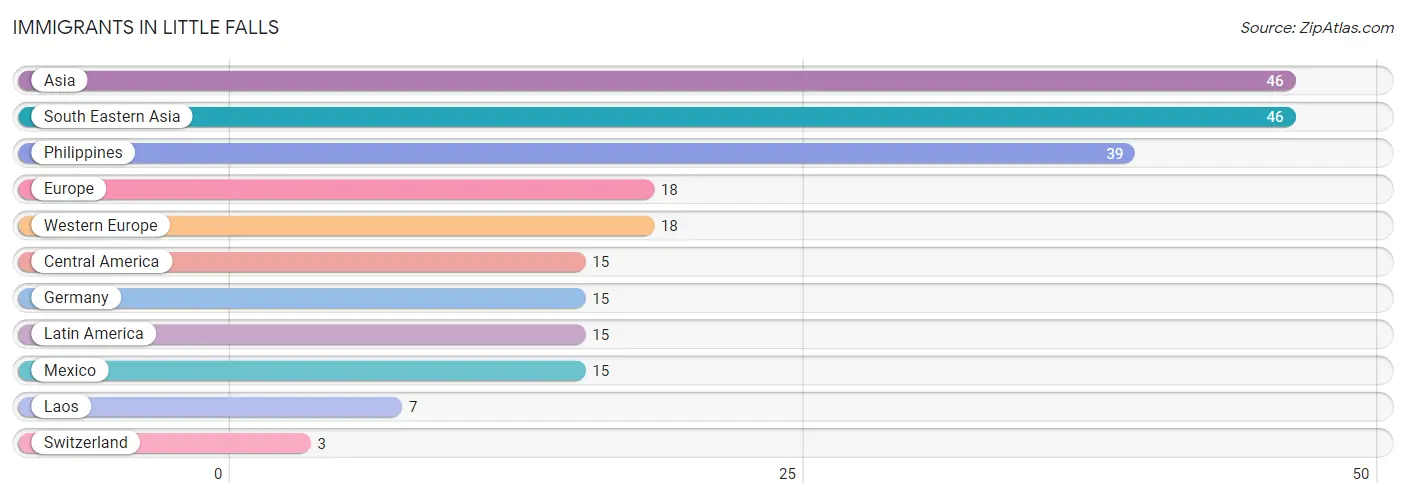
Immigrants in Little Falls
The most numerous immigrant groups reported in Little Falls came from Asia (46 | 0.5%), South Eastern Asia (46 | 0.5%), Philippines (39 | 0.4%), Europe (18 | 0.2%), and Western Europe (18 | 0.2%), together accounting for 1.9% of all Little Falls residents.
| Immigration Origin | # Population | % Population |
| Asia | 46 | 0.5% |
| Central America | 15 | 0.2% |
| Europe | 18 | 0.2% |
| Germany | 15 | 0.2% |
| Laos | 7 | 0.1% |
| Latin America | 15 | 0.2% |
| Mexico | 15 | 0.2% |
| Philippines | 39 | 0.4% |
| South Eastern Asia | 46 | 0.5% |
| Switzerland | 3 | 0.0% |
| Western Europe | 18 | 0.2% | View All 11 Rows |
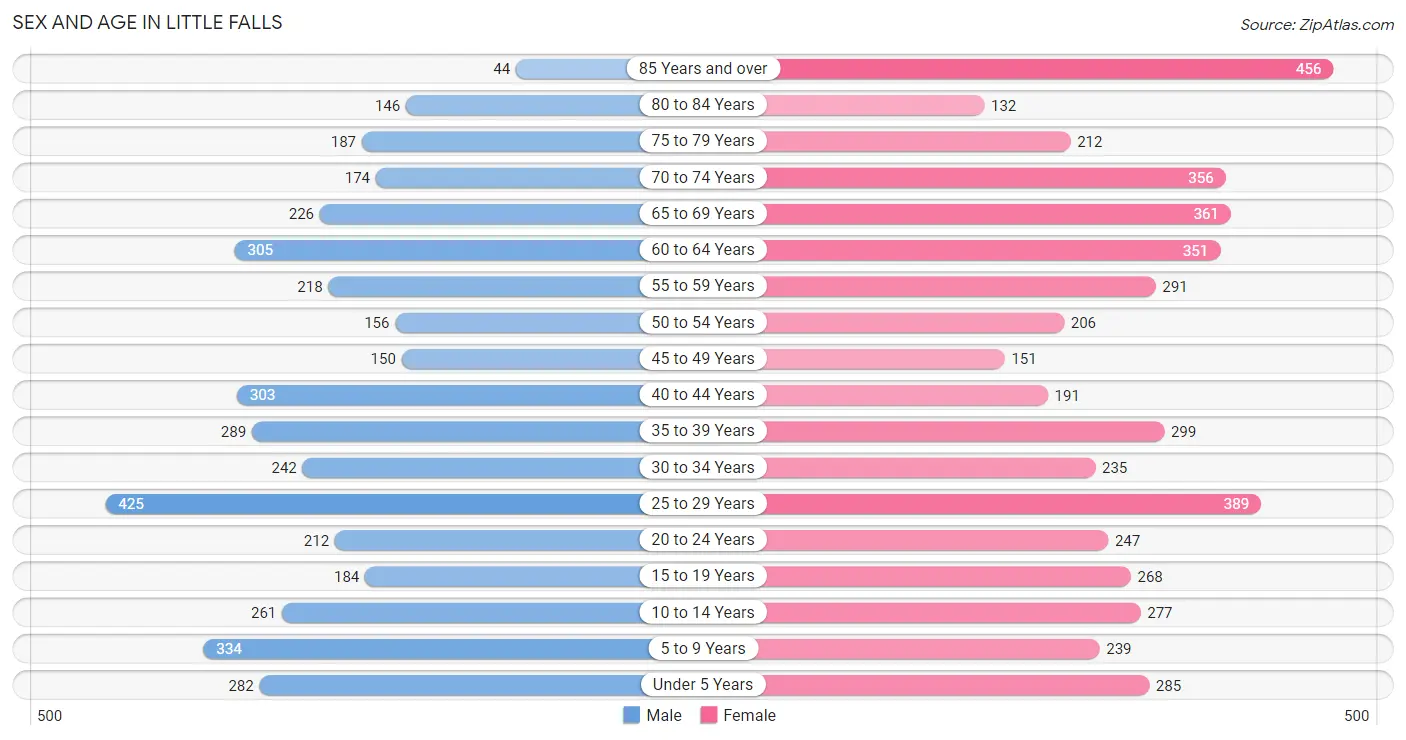
Sex and Age in Little Falls
Sex and Age in Little Falls
The most populous age groups in Little Falls are 25 to 29 Years (425 | 10.3%) for men and 85 Years and over (456 | 9.2%) for women.
| Age Bracket | Male | Female |
| Under 5 Years | 282 (6.8%) | 285 (5.8%) |
| 5 to 9 Years | 334 (8.1%) | 239 (4.8%) |
| 10 to 14 Years | 261 (6.3%) | 277 (5.6%) |
| 15 to 19 Years | 184 (4.4%) | 268 (5.4%) |
| 20 to 24 Years | 212 (5.1%) | 247 (5.0%) |
| 25 to 29 Years | 425 (10.3%) | 389 (7.9%) |
| 30 to 34 Years | 242 (5.9%) | 235 (4.8%) |
| 35 to 39 Years | 289 (7.0%) | 299 (6.0%) |
| 40 to 44 Years | 303 (7.3%) | 191 (3.9%) |
| 45 to 49 Years | 150 (3.6%) | 151 (3.0%) |
| 50 to 54 Years | 156 (3.8%) | 206 (4.2%) |
| 55 to 59 Years | 218 (5.3%) | 291 (5.9%) |
| 60 to 64 Years | 305 (7.4%) | 351 (7.1%) |
| 65 to 69 Years | 226 (5.5%) | 361 (7.3%) |
| 70 to 74 Years | 174 (4.2%) | 356 (7.2%) |
| 75 to 79 Years | 187 (4.5%) | 212 (4.3%) |
| 80 to 84 Years | 146 (3.5%) | 132 (2.7%) |
| 85 Years and over | 44 (1.1%) | 456 (9.2%) |
| Total | 4,138 (100.0%) | 4,946 (100.0%) |
Families and Households in Little Falls
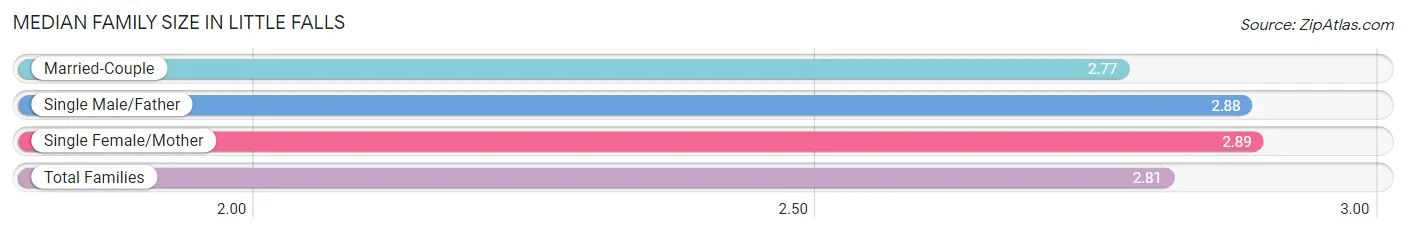
Median Family Size in Little Falls
The median family size in Little Falls is 2.81 persons per family, with single female/mother families (562 | 25.3%) accounting for the largest median family size of 2.89 persons per family. On the other hand, married-couple families (1,467 | 66.0%) represent the smallest median family size with 2.77 persons per family.
| Family Type | # Families | Family Size |
| Married-Couple | 1,467 (66.0%) | 2.77 |
| Single Male/Father | 195 (8.8%) | 2.88 |
| Single Female/Mother | 562 (25.3%) | 2.89 |
| Total Families | 2,224 (100.0%) | 2.81 |
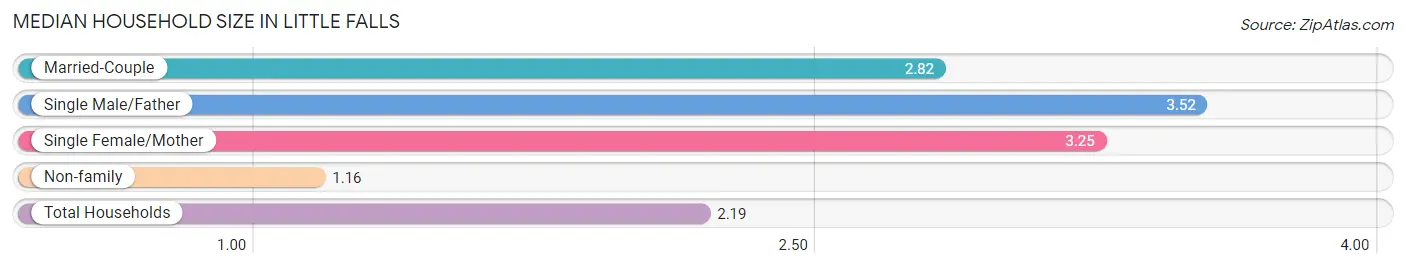
Median Household Size in Little Falls
The median household size in Little Falls is 2.19 persons per household, with single male/father households (195 | 4.9%) accounting for the largest median household size of 3.52 persons per household. non-family households (1,730 | 43.8%) represent the smallest median household size with 1.16 persons per household.
| Household Type | # Households | Household Size |
| Married-Couple | 1,467 (37.1%) | 2.82 |
| Single Male/Father | 195 (4.9%) | 3.52 |
| Single Female/Mother | 562 (14.2%) | 3.25 |
| Non-family | 1,730 (43.8%) | 1.16 |
| Total Households | 3,954 (100.0%) | 2.19 |
Household Size by Marriage Status in Little Falls
Out of a total of 3,954 households in Little Falls, 2,224 (56.2%) are family households, while 1,730 (43.8%) are nonfamily households. The most numerous type of family households are 2-person households, comprising 1,210, and the most common type of nonfamily households are 1-person households, comprising 1,489.
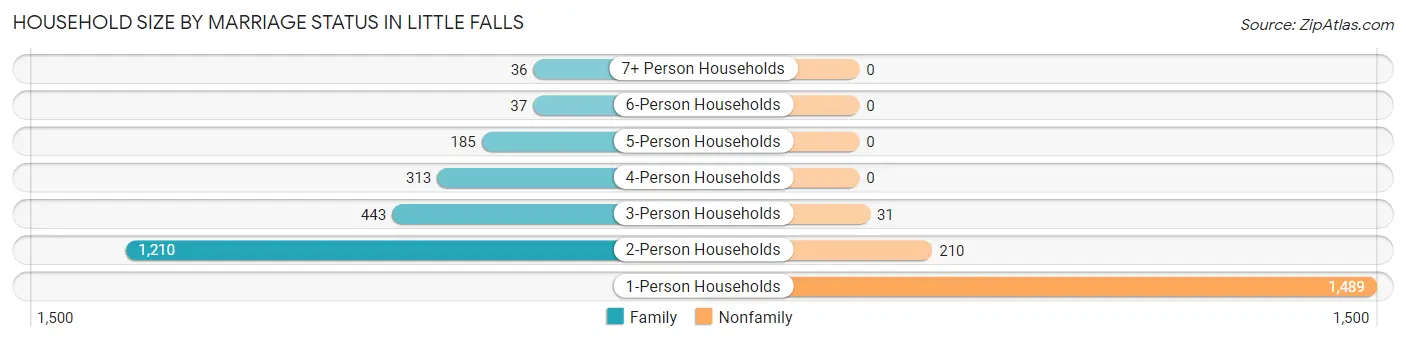
| Household Size | Family Households | Nonfamily Households |
| 1-Person Households | - | 1,489 (37.7%) |
| 2-Person Households | 1,210 (30.6%) | 210 (5.3%) |
| 3-Person Households | 443 (11.2%) | 31 (0.8%) |
| 4-Person Households | 313 (7.9%) | 0 (0.0%) |
| 5-Person Households | 185 (4.7%) | 0 (0.0%) |
| 6-Person Households | 37 (0.9%) | 0 (0.0%) |
| 7+ Person Households | 36 (0.9%) | 0 (0.0%) |
| Total | 2,224 (56.2%) | 1,730 (43.8%) |
Female Fertility in Little Falls
Fertility by Age in Little Falls
Average fertility rate in Little Falls is 51.0 births per 1,000 women. Women in the age bracket of 20 to 34 years have the highest fertility rate with 104.0 births per 1,000 women. Women in the age bracket of 20 to 34 years acount for 100.0% of all women with births.
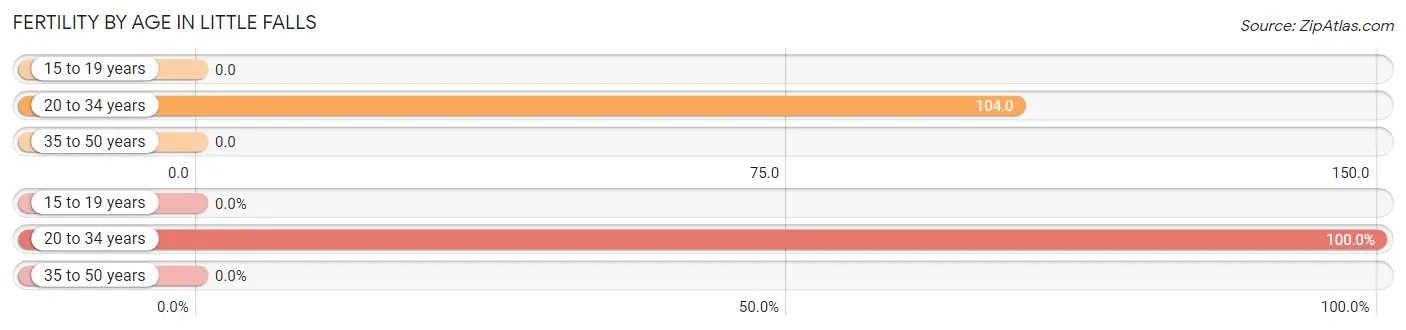
| Age Bracket | Women with Births | Births / 1,000 Women |
| 15 to 19 years | 0 (0.0%) | 0.0 |
| 20 to 34 years | 91 (100.0%) | 104.0 |
| 35 to 50 years | 0 (0.0%) | 0.0 |
| Total | 91 (100.0%) | 51.0 |
Fertility by Age by Marriage Status in Little Falls
19.8% of women with births (91) in Little Falls are married. The highest percentage of unmarried women with births falls into 20 to 34 years age bracket with 80.2% of them unmarried at the time of birth, while the lowest percentage of unmarried women with births belong to 20 to 34 years age bracket with 80.2% of them unmarried.
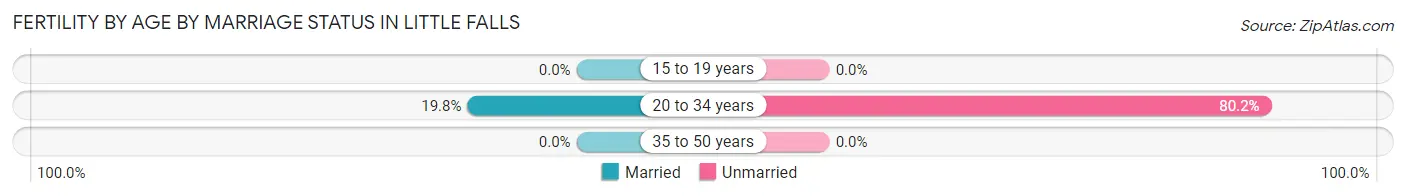
| Age Bracket | Married | Unmarried |
| 15 to 19 years | 0 (0.0%) | 0 (0.0%) |
| 20 to 34 years | 18 (19.8%) | 73 (80.2%) |
| 35 to 50 years | 0 (0.0%) | 0 (0.0%) |
| Total | 18 (19.8%) | 73 (80.2%) |
Fertility by Education in Little Falls
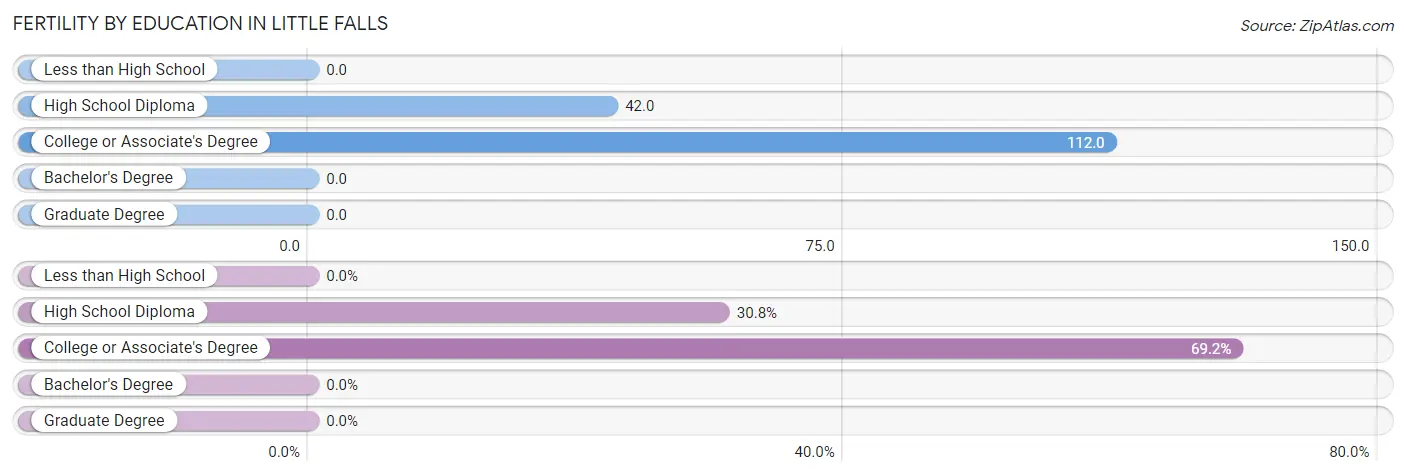
| Educational Attainment | Women with Births | Births / 1,000 Women |
| Less than High School | 0 (0.0%) | 0.0 |
| High School Diploma | 28 (30.8%) | 42.0 |
| College or Associate's Degree | 63 (69.2%) | 112.0 |
| Bachelor's Degree | 0 (0.0%) | 0.0 |
| Graduate Degree | 0 (0.0%) | 0.0 |
| Total | 91 (100.0%) | 51.0 |
Fertility by Education by Marriage Status in Little Falls
80.2% of women with births in Little Falls are unmarried. Women with the educational attainment of college or associate's degree are most likely to be married with 25.4% of them married at childbirth, while women with the educational attainment of high school diploma are least likely to be married with 92.9% of them unmarried at childbirth.
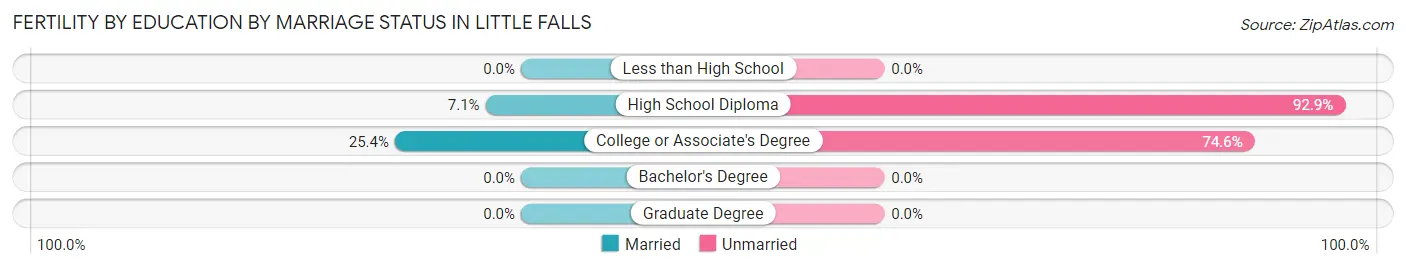
| Educational Attainment | Married | Unmarried |
| Less than High School | 0 (0.0%) | 0 (0.0%) |
| High School Diploma | 2 (7.1%) | 26 (92.9%) |
| College or Associate's Degree | 16 (25.4%) | 47 (74.6%) |
| Bachelor's Degree | 0 (0.0%) | 0 (0.0%) |
| Graduate Degree | 0 (0.0%) | 0 (0.0%) |
| Total | 18 (19.8%) | 73 (80.2%) |
Employment Characteristics in Little Falls
Employment by Class of Employer in Little Falls
Among the 3,714 employed individuals in Little Falls, private company employees (2,520 | 67.8%), not-for-profit organizations (333 | 9.0%), and local government employees (293 | 7.9%) make up the most common classes of employment.
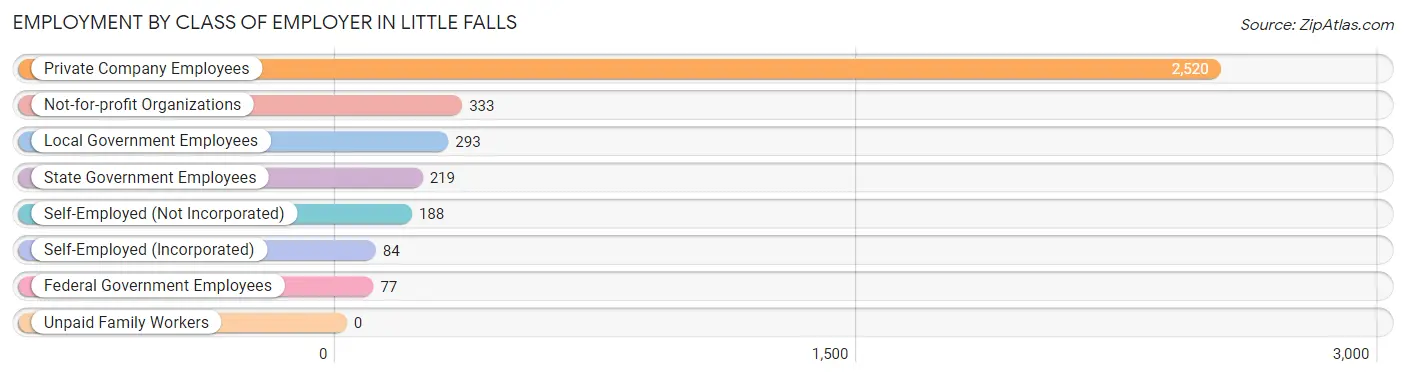
| Employer Class | # Employees | % Employees |
| Private Company Employees | 2,520 | 67.8% |
| Self-Employed (Incorporated) | 84 | 2.3% |
| Self-Employed (Not Incorporated) | 188 | 5.1% |
| Not-for-profit Organizations | 333 | 9.0% |
| Local Government Employees | 293 | 7.9% |
| State Government Employees | 219 | 5.9% |
| Federal Government Employees | 77 | 2.1% |
| Unpaid Family Workers | 0 | 0.0% |
| Total | 3,714 | 100.0% |
Employment Status by Age in Little Falls
According to the labor force statistics for Little Falls, out of the total population over 16 years of age (7,289), 55.5% or 4,045 individuals are in the labor force, with 6.0% or 243 of them unemployed. The age group with the highest labor force participation rate is 30 to 34 years, with 88.3% or 421 individuals in the labor force. Within the labor force, the 30 to 34 years age range has the highest percentage of unemployed individuals, with 18.3% or 77 of them being unemployed.
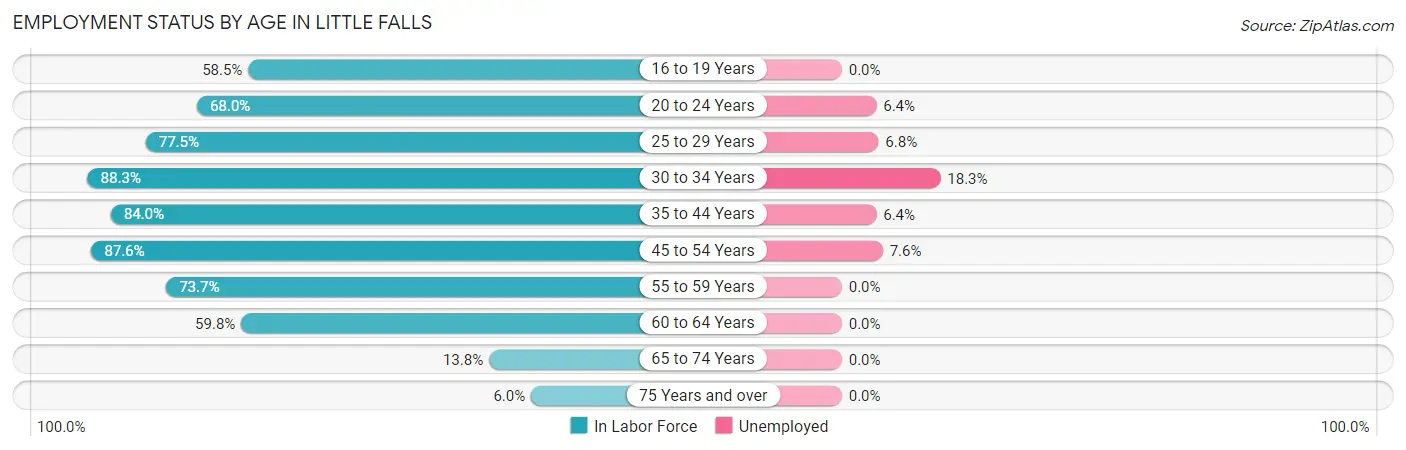
| Age Bracket | In Labor Force | Unemployed |
| 16 to 19 Years | 196 (58.5%) | 0 (0.0%) |
| 20 to 24 Years | 312 (68.0%) | 20 (6.4%) |
| 25 to 29 Years | 631 (77.5%) | 43 (6.8%) |
| 30 to 34 Years | 421 (88.3%) | 77 (18.3%) |
| 35 to 44 Years | 909 (84.0%) | 58 (6.4%) |
| 45 to 54 Years | 581 (87.6%) | 44 (7.6%) |
| 55 to 59 Years | 375 (73.7%) | 0 (0.0%) |
| 60 to 64 Years | 392 (59.8%) | 0 (0.0%) |
| 65 to 74 Years | 154 (13.8%) | 0 (0.0%) |
| 75 Years and over | 71 (6.0%) | 0 (0.0%) |
| Total | 4,045 (55.5%) | 243 (6.0%) |
Employment Status by Educational Attainment in Little Falls
According to labor force statistics for Little Falls, 78.8% of individuals (3,310) out of the total population between 25 and 64 years of age (4,201) are in the labor force, with 6.8% or 225 of them being unemployed. The group with the highest labor force participation rate are those with the educational attainment of college / associate degree, with 86.6% or 1,271 individuals in the labor force. Within the labor force, individuals with less than high school education have the highest percentage of unemployment, with 30.2% or 49 of them being unemployed.
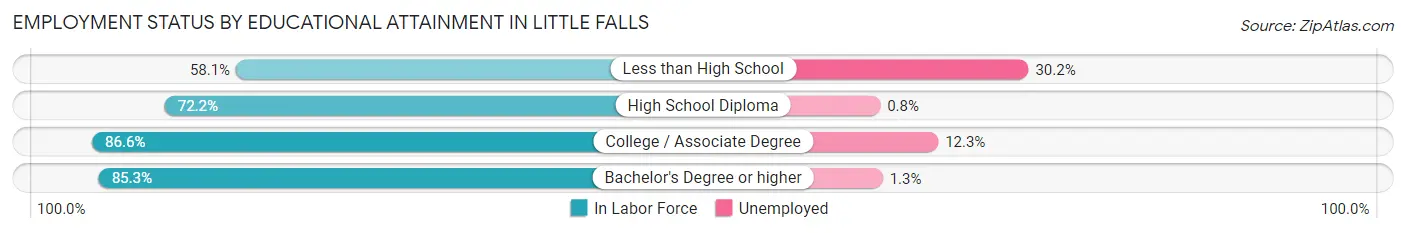
| Educational Attainment | In Labor Force | Unemployed |
| Less than High School | 162 (58.1%) | 84 (30.2%) |
| High School Diploma | 1,193 (72.2%) | 13 (0.8%) |
| College / Associate Degree | 1,271 (86.6%) | 181 (12.3%) |
| Bachelor's Degree or higher | 684 (85.3%) | 10 (1.3%) |
| Total | 3,310 (78.8%) | 286 (6.8%) |
Employment Occupations by Sex in Little Falls
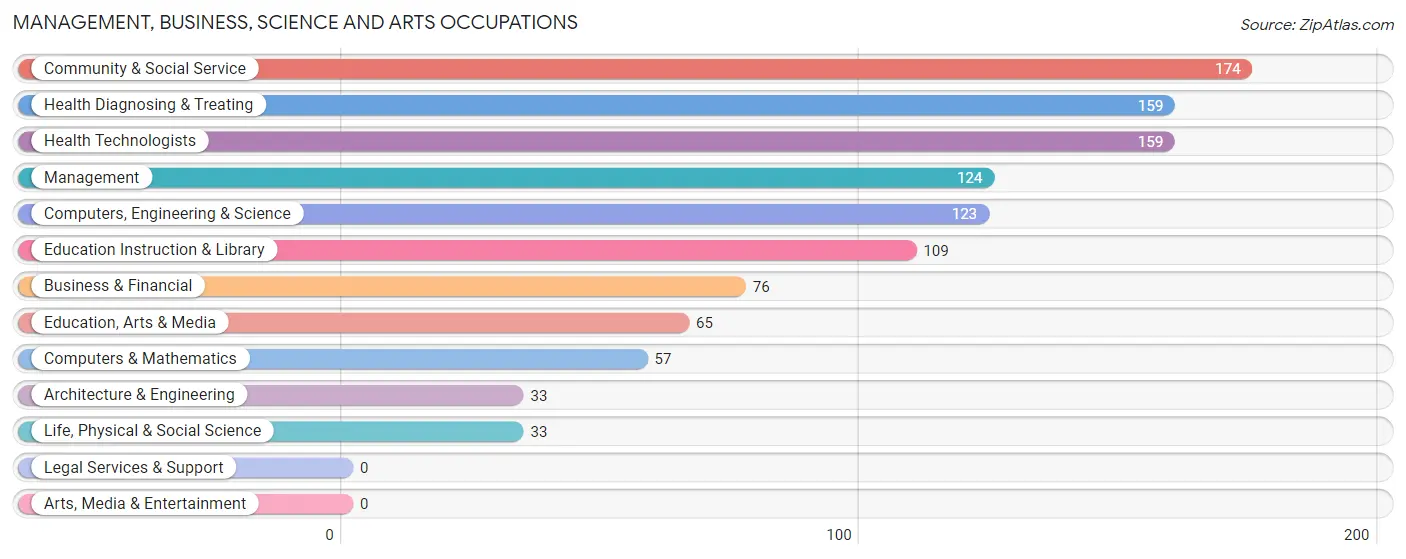
Management, Business, Science and Arts Occupations
The most common Management, Business, Science and Arts occupations in Little Falls are Community & Social Service (174 | 4.6%), Health Diagnosing & Treating (159 | 4.2%), Health Technologists (159 | 4.2%), Management (124 | 3.3%), and Computers, Engineering & Science (123 | 3.3%).
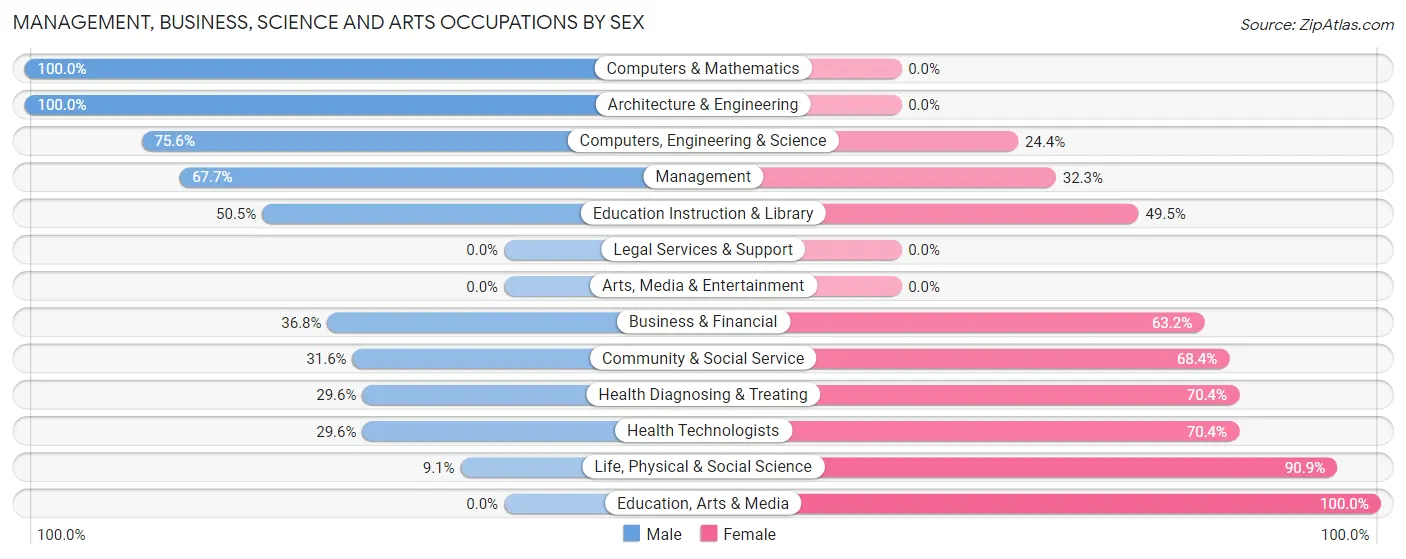
Management, Business, Science and Arts Occupations by Sex
Within the Management, Business, Science and Arts occupations in Little Falls, the most male-oriented occupations are Computers & Mathematics (100.0%), Architecture & Engineering (100.0%), and Computers, Engineering & Science (75.6%), while the most female-oriented occupations are Education, Arts & Media (100.0%), Life, Physical & Social Science (90.9%), and Health Diagnosing & Treating (70.4%).
| Occupation | Male | Female |
| Management | 84 (67.7%) | 40 (32.3%) |
| Business & Financial | 28 (36.8%) | 48 (63.2%) |
| Computers, Engineering & Science | 93 (75.6%) | 30 (24.4%) |
| Computers & Mathematics | 57 (100.0%) | 0 (0.0%) |
| Architecture & Engineering | 33 (100.0%) | 0 (0.0%) |
| Life, Physical & Social Science | 3 (9.1%) | 30 (90.9%) |
| Community & Social Service | 55 (31.6%) | 119 (68.4%) |
| Education, Arts & Media | 0 (0.0%) | 65 (100.0%) |
| Legal Services & Support | 0 (0.0%) | 0 (0.0%) |
| Education Instruction & Library | 55 (50.5%) | 54 (49.5%) |
| Arts, Media & Entertainment | 0 (0.0%) | 0 (0.0%) |
| Health Diagnosing & Treating | 47 (29.6%) | 112 (70.4%) |
| Health Technologists | 47 (29.6%) | 112 (70.4%) |
| Total (Category) | 307 (46.8%) | 349 (53.2%) |
| Total (Overall) | 1,852 (49.3%) | 1,908 (50.7%) |
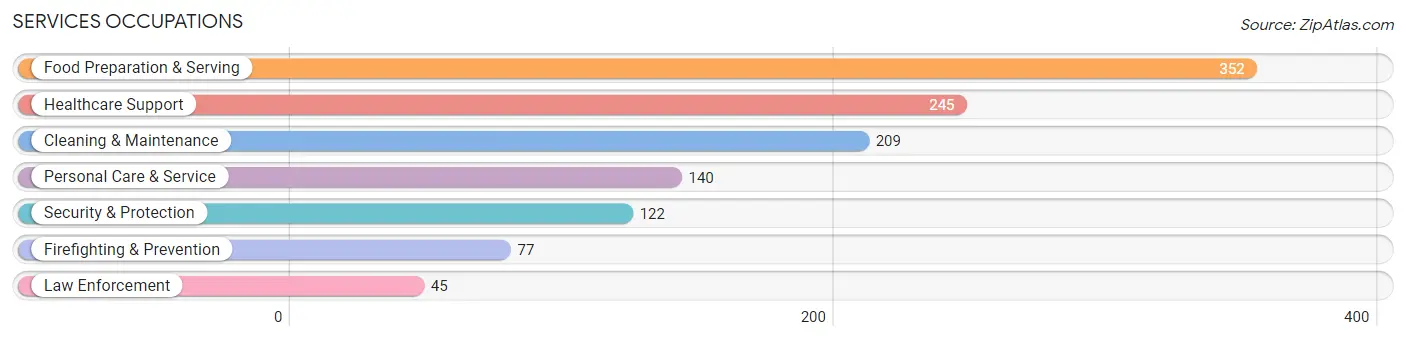
Services Occupations
The most common Services occupations in Little Falls are Food Preparation & Serving (352 | 9.4%), Healthcare Support (245 | 6.5%), Cleaning & Maintenance (209 | 5.6%), Personal Care & Service (140 | 3.7%), and Security & Protection (122 | 3.2%).
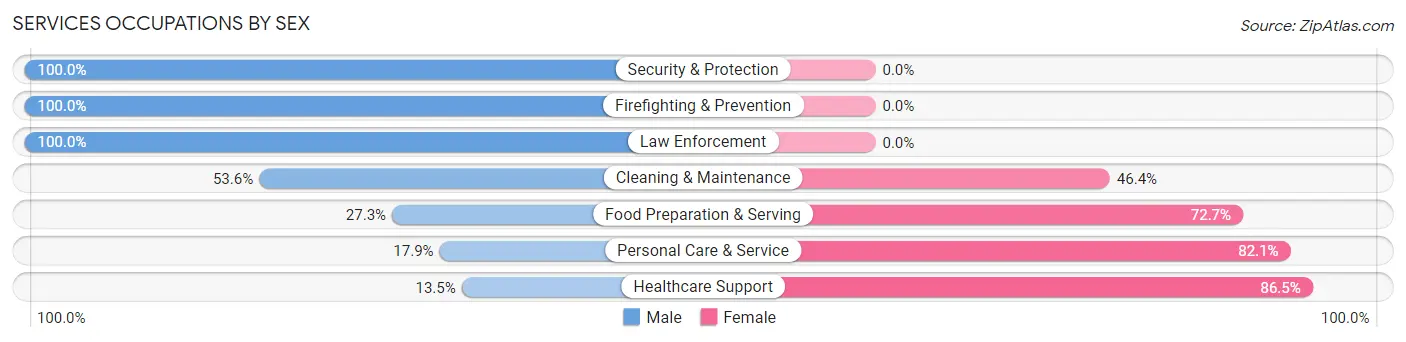
Services Occupations by Sex
Within the Services occupations in Little Falls, the most male-oriented occupations are Security & Protection (100.0%), Firefighting & Prevention (100.0%), and Law Enforcement (100.0%), while the most female-oriented occupations are Healthcare Support (86.5%), Personal Care & Service (82.1%), and Food Preparation & Serving (72.7%).
| Occupation | Male | Female |
| Healthcare Support | 33 (13.5%) | 212 (86.5%) |
| Security & Protection | 122 (100.0%) | 0 (0.0%) |
| Firefighting & Prevention | 77 (100.0%) | 0 (0.0%) |
| Law Enforcement | 45 (100.0%) | 0 (0.0%) |
| Food Preparation & Serving | 96 (27.3%) | 256 (72.7%) |
| Cleaning & Maintenance | 112 (53.6%) | 97 (46.4%) |
| Personal Care & Service | 25 (17.9%) | 115 (82.1%) |
| Total (Category) | 388 (36.3%) | 680 (63.7%) |
| Total (Overall) | 1,852 (49.3%) | 1,908 (50.7%) |
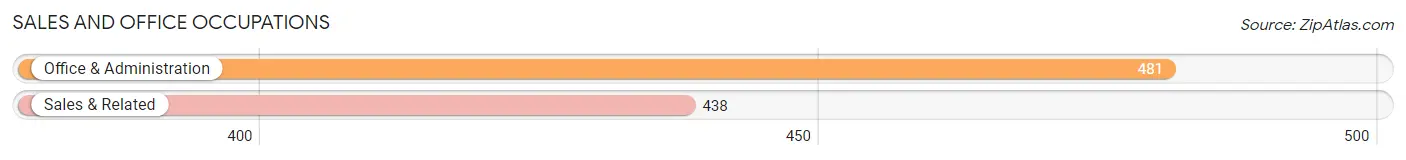
Sales and Office Occupations
The most common Sales and Office occupations in Little Falls are Office & Administration (481 | 12.8%), and Sales & Related (438 | 11.7%).
Sales and Office Occupations by Sex
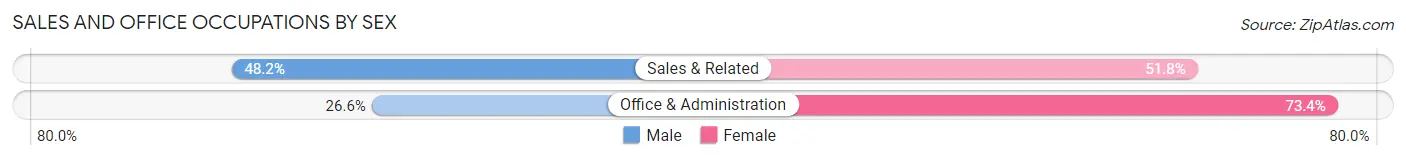
| Occupation | Male | Female |
| Sales & Related | 211 (48.2%) | 227 (51.8%) |
| Office & Administration | 128 (26.6%) | 353 (73.4%) |
| Total (Category) | 339 (36.9%) | 580 (63.1%) |
| Total (Overall) | 1,852 (49.3%) | 1,908 (50.7%) |
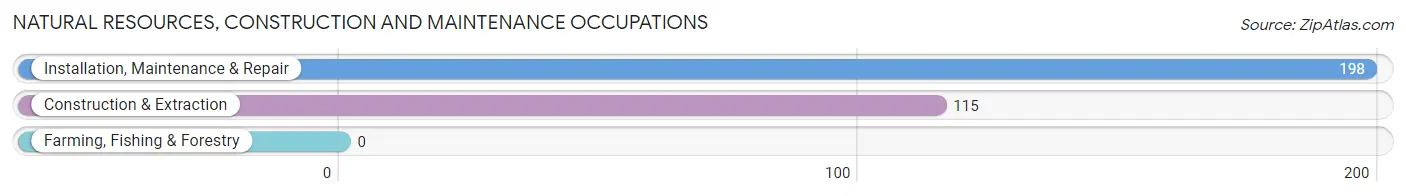
Natural Resources, Construction and Maintenance Occupations
The most common Natural Resources, Construction and Maintenance occupations in Little Falls are Installation, Maintenance & Repair (198 | 5.3%), and Construction & Extraction (115 | 3.1%).
Natural Resources, Construction and Maintenance Occupations by Sex
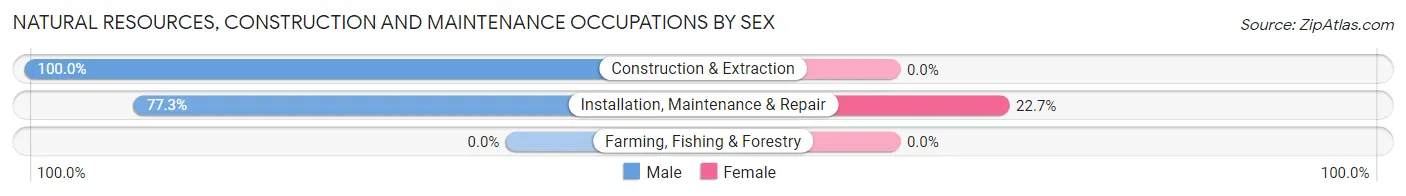
| Occupation | Male | Female |
| Farming, Fishing & Forestry | 0 (0.0%) | 0 (0.0%) |
| Construction & Extraction | 115 (100.0%) | 0 (0.0%) |
| Installation, Maintenance & Repair | 153 (77.3%) | 45 (22.7%) |
| Total (Category) | 268 (85.6%) | 45 (14.4%) |
| Total (Overall) | 1,852 (49.3%) | 1,908 (50.7%) |
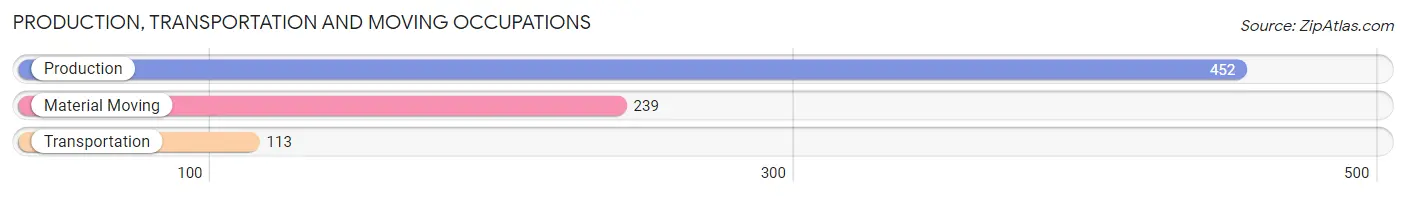
Production, Transportation and Moving Occupations
The most common Production, Transportation and Moving occupations in Little Falls are Production (452 | 12.0%), Material Moving (239 | 6.4%), and Transportation (113 | 3.0%).
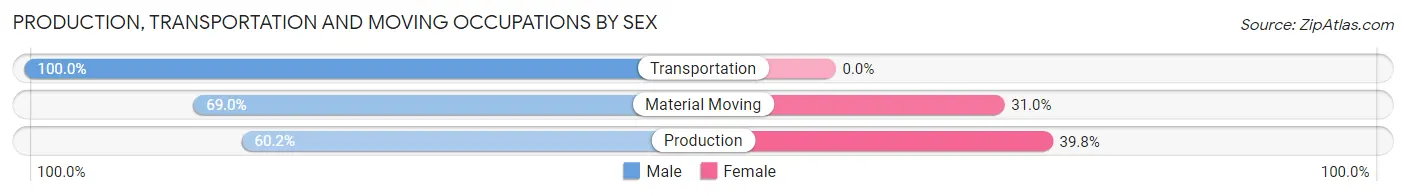
Production, Transportation and Moving Occupations by Sex
| Occupation | Male | Female |
| Production | 272 (60.2%) | 180 (39.8%) |
| Transportation | 113 (100.0%) | 0 (0.0%) |
| Material Moving | 165 (69.0%) | 74 (31.0%) |
| Total (Category) | 550 (68.4%) | 254 (31.6%) |
| Total (Overall) | 1,852 (49.3%) | 1,908 (50.7%) |
Employment Industries by Sex in Little Falls
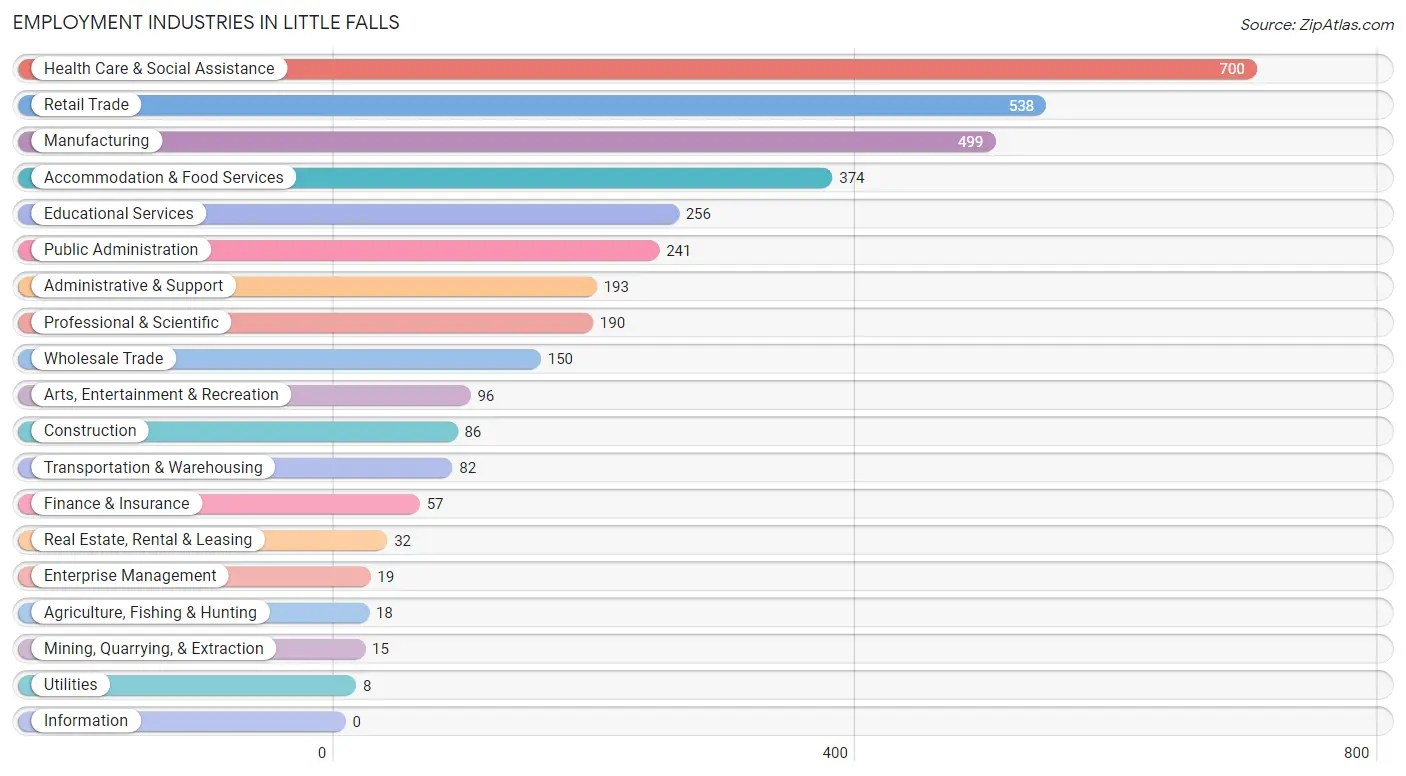
Employment Industries in Little Falls
The major employment industries in Little Falls include Health Care & Social Assistance (700 | 18.6%), Retail Trade (538 | 14.3%), Manufacturing (499 | 13.3%), Accommodation & Food Services (374 | 10.0%), and Educational Services (256 | 6.8%).
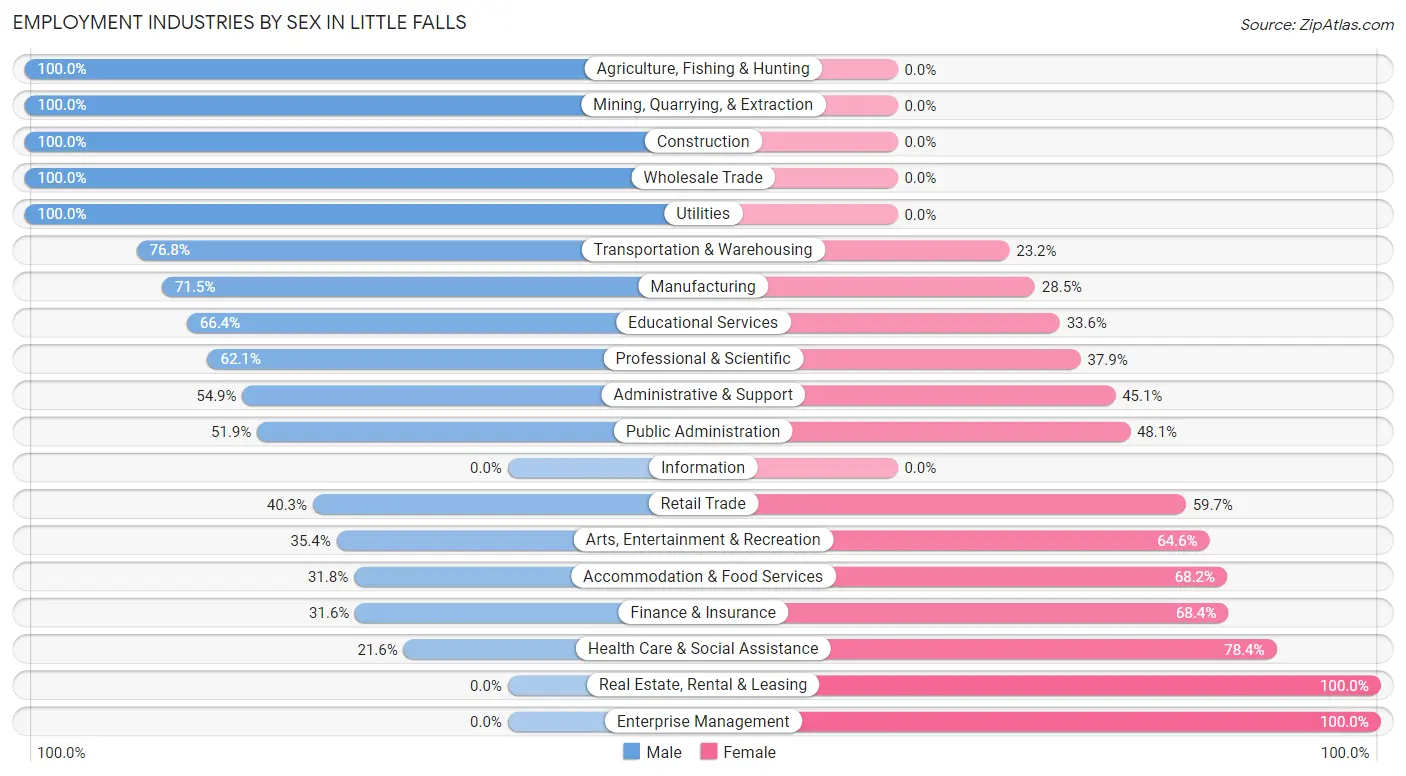
Employment Industries by Sex in Little Falls
The Little Falls industries that see more men than women are Agriculture, Fishing & Hunting (100.0%), Mining, Quarrying, & Extraction (100.0%), and Construction (100.0%), whereas the industries that tend to have a higher number of women are Real Estate, Rental & Leasing (100.0%), Enterprise Management (100.0%), and Health Care & Social Assistance (78.4%).
| Industry | Male | Female |
| Agriculture, Fishing & Hunting | 18 (100.0%) | 0 (0.0%) |
| Mining, Quarrying, & Extraction | 15 (100.0%) | 0 (0.0%) |
| Construction | 86 (100.0%) | 0 (0.0%) |
| Manufacturing | 357 (71.5%) | 142 (28.5%) |
| Wholesale Trade | 150 (100.0%) | 0 (0.0%) |
| Retail Trade | 217 (40.3%) | 321 (59.7%) |
| Transportation & Warehousing | 63 (76.8%) | 19 (23.2%) |
| Utilities | 8 (100.0%) | 0 (0.0%) |
| Information | 0 (0.0%) | 0 (0.0%) |
| Finance & Insurance | 18 (31.6%) | 39 (68.4%) |
| Real Estate, Rental & Leasing | 0 (0.0%) | 32 (100.0%) |
| Professional & Scientific | 118 (62.1%) | 72 (37.9%) |
| Enterprise Management | 0 (0.0%) | 19 (100.0%) |
| Administrative & Support | 106 (54.9%) | 87 (45.1%) |
| Educational Services | 170 (66.4%) | 86 (33.6%) |
| Health Care & Social Assistance | 151 (21.6%) | 549 (78.4%) |
| Arts, Entertainment & Recreation | 34 (35.4%) | 62 (64.6%) |
| Accommodation & Food Services | 119 (31.8%) | 255 (68.2%) |
| Public Administration | 125 (51.9%) | 116 (48.1%) |
| Total | 1,852 (49.3%) | 1,908 (50.7%) |
Education in Little Falls
School Enrollment in Little Falls
The most common levels of schooling among the 1,654 students in Little Falls are middle school (446 | 27.0%), high school (335 | 20.3%), and elementary school (332 | 20.1%).
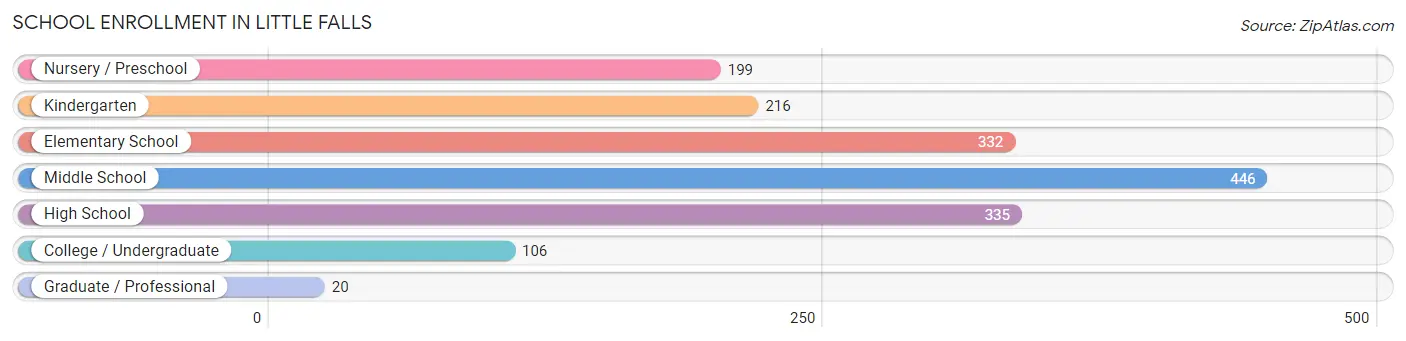
| School Level | # Students | % Students |
| Nursery / Preschool | 199 | 12.0% |
| Kindergarten | 216 | 13.1% |
| Elementary School | 332 | 20.1% |
| Middle School | 446 | 27.0% |
| High School | 335 | 20.3% |
| College / Undergraduate | 106 | 6.4% |
| Graduate / Professional | 20 | 1.2% |
| Total | 1,654 | 100.0% |
School Enrollment by Age by Funding Source in Little Falls
Out of a total of 1,654 students who are enrolled in schools in Little Falls, 203 (12.3%) attend a private institution, while the remaining 1,451 (87.7%) are enrolled in public schools. The age group of 20 to 24 year olds has the highest likelihood of being enrolled in private schools, with 49 (67.1% in the age bracket) enrolled. Conversely, the age group of 18 to 19 year olds has the lowest likelihood of being enrolled in a private school, with 29 (100.0% in the age bracket) attending a public institution.
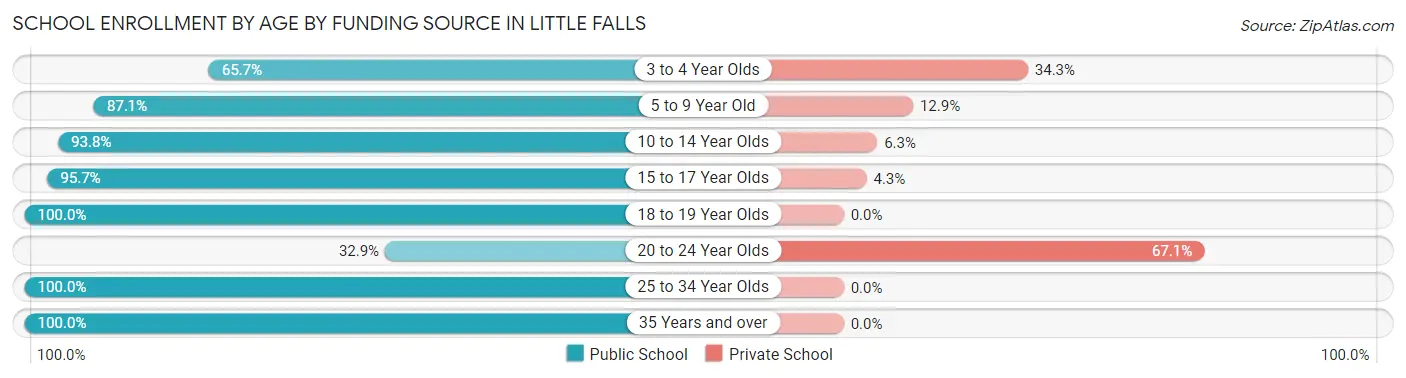
| Age Bracket | Public School | Private School |
| 3 to 4 Year Olds | 67 (65.7%) | 35 (34.3%) |
| 5 to 9 Year Old | 499 (87.1%) | 74 (12.9%) |
| 10 to 14 Year Olds | 480 (93.8%) | 32 (6.2%) |
| 15 to 17 Year Olds | 292 (95.7%) | 13 (4.3%) |
| 18 to 19 Year Olds | 29 (100.0%) | 0 (0.0%) |
| 20 to 24 Year Olds | 24 (32.9%) | 49 (67.1%) |
| 25 to 34 Year Olds | 35 (100.0%) | 0 (0.0%) |
| 35 Years and over | 25 (100.0%) | 0 (0.0%) |
| Total | 1,451 (87.7%) | 203 (12.3%) |
Educational Attainment by Field of Study in Little Falls
Science & technology (359 | 25.8%), education (342 | 24.5%), business (152 | 10.9%), literature & languages (73 | 5.2%), and bio, nature & agricultural (67 | 4.8%) are the most common fields of study among 1,393 individuals in Little Falls who have obtained a bachelor's degree or higher.
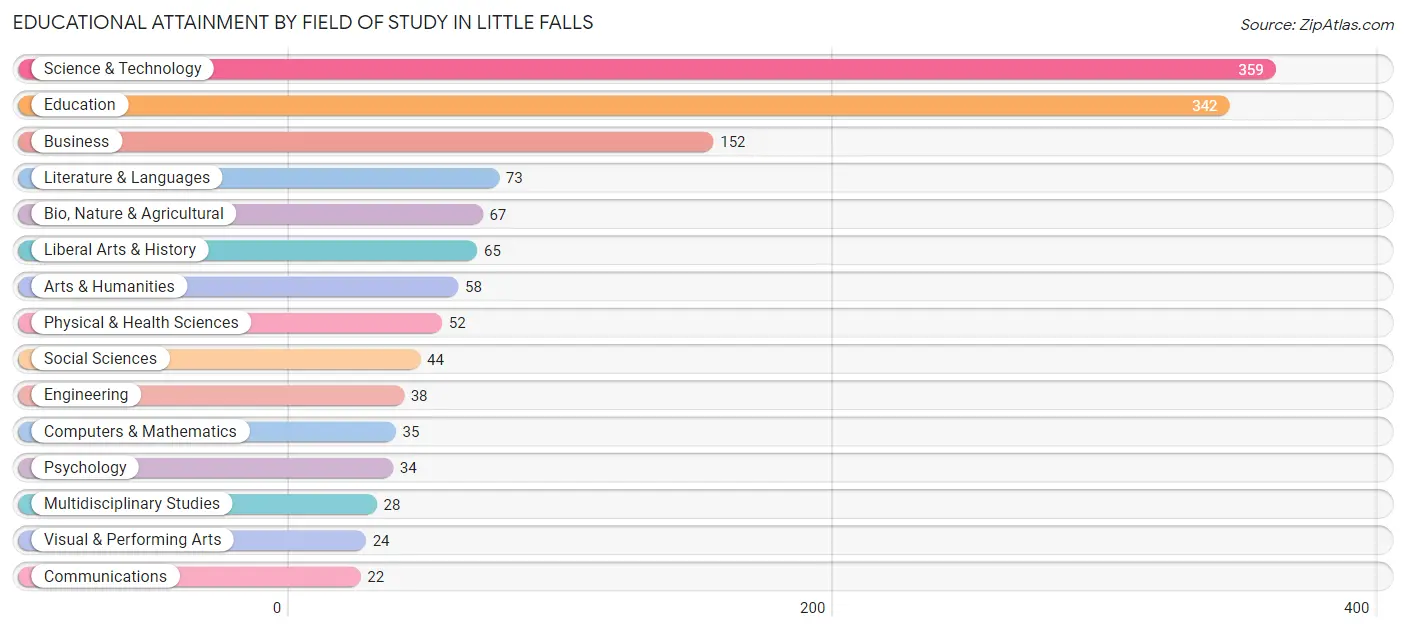
| Field of Study | # Graduates | % Graduates |
| Computers & Mathematics | 35 | 2.5% |
| Bio, Nature & Agricultural | 67 | 4.8% |
| Physical & Health Sciences | 52 | 3.7% |
| Psychology | 34 | 2.4% |
| Social Sciences | 44 | 3.2% |
| Engineering | 38 | 2.7% |
| Multidisciplinary Studies | 28 | 2.0% |
| Science & Technology | 359 | 25.8% |
| Business | 152 | 10.9% |
| Education | 342 | 24.5% |
| Literature & Languages | 73 | 5.2% |
| Liberal Arts & History | 65 | 4.7% |
| Visual & Performing Arts | 24 | 1.7% |
| Communications | 22 | 1.6% |
| Arts & Humanities | 58 | 4.2% |
| Total | 1,393 | 100.0% |
Transportation & Commute in Little Falls
Vehicle Availability by Sex in Little Falls
The most prevalent vehicle ownership categories in Little Falls are males with 2 vehicles (664, accounting for 36.9%) and females with 2 vehicles (677, making up 36.2%).
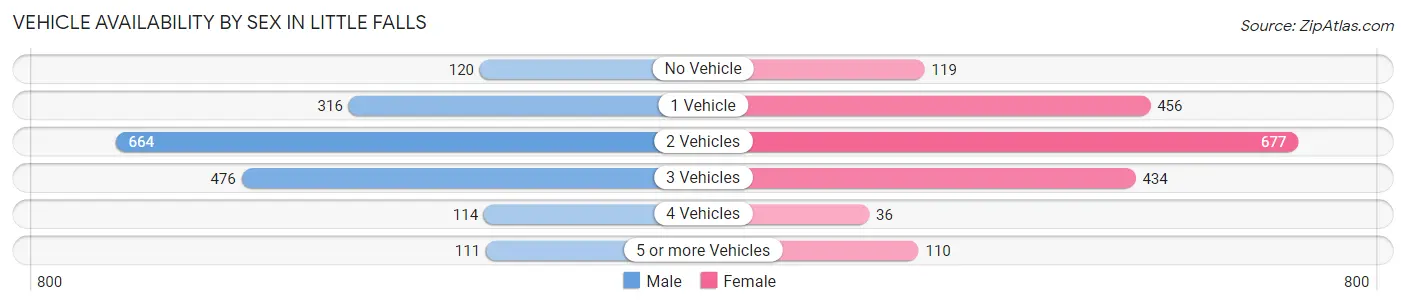
| Vehicles Available | Male | Female |
| No Vehicle | 120 (6.7%) | 119 (6.5%) |
| 1 Vehicle | 316 (17.5%) | 456 (24.9%) |
| 2 Vehicles | 664 (36.9%) | 677 (36.9%) |
| 3 Vehicles | 476 (26.4%) | 434 (23.7%) |
| 4 Vehicles | 114 (6.3%) | 36 (2.0%) |
| 5 or more Vehicles | 111 (6.2%) | 110 (6.0%) |
| Total | 1,801 (100.0%) | 1,832 (100.0%) |
Commute Time in Little Falls
The most frequently occuring commute durations in Little Falls are 5 to 9 minutes (1,216 commuters, 34.2%), 10 to 14 minutes (389 commuters, 10.9%), and 30 to 34 minutes (330 commuters, 9.3%).
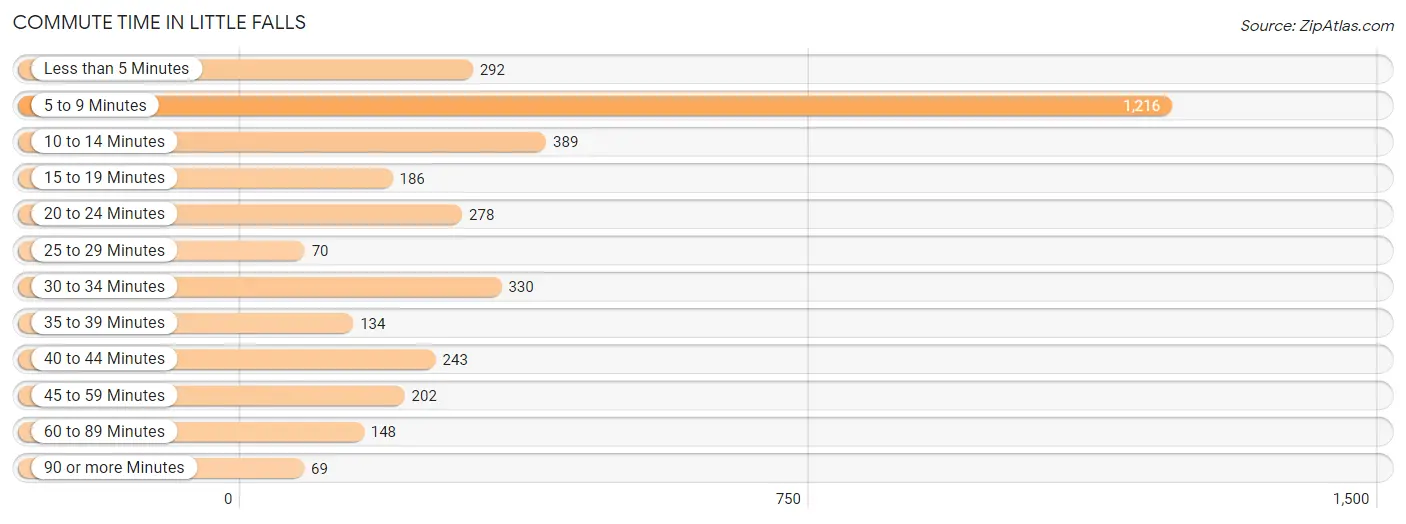
| Commute Time | # Commuters | % Commuters |
| Less than 5 Minutes | 292 | 8.2% |
| 5 to 9 Minutes | 1,216 | 34.2% |
| 10 to 14 Minutes | 389 | 10.9% |
| 15 to 19 Minutes | 186 | 5.2% |
| 20 to 24 Minutes | 278 | 7.8% |
| 25 to 29 Minutes | 70 | 2.0% |
| 30 to 34 Minutes | 330 | 9.3% |
| 35 to 39 Minutes | 134 | 3.8% |
| 40 to 44 Minutes | 243 | 6.8% |
| 45 to 59 Minutes | 202 | 5.7% |
| 60 to 89 Minutes | 148 | 4.2% |
| 90 or more Minutes | 69 | 1.9% |
Commute Time by Sex in Little Falls
The most common commute times in Little Falls are 5 to 9 minutes (425 commuters, 24.4%) for males and 5 to 9 minutes (791 commuters, 43.6%) for females.
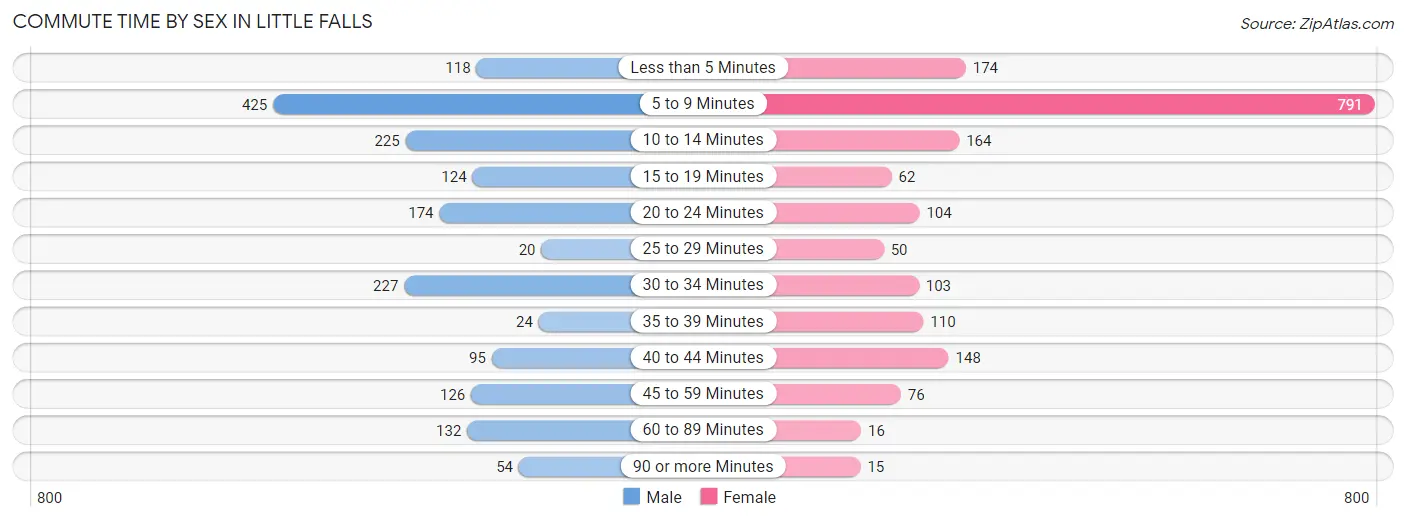
| Commute Time | Male | Female |
| Less than 5 Minutes | 118 (6.8%) | 174 (9.6%) |
| 5 to 9 Minutes | 425 (24.4%) | 791 (43.6%) |
| 10 to 14 Minutes | 225 (12.9%) | 164 (9.0%) |
| 15 to 19 Minutes | 124 (7.1%) | 62 (3.4%) |
| 20 to 24 Minutes | 174 (10.0%) | 104 (5.7%) |
| 25 to 29 Minutes | 20 (1.1%) | 50 (2.8%) |
| 30 to 34 Minutes | 227 (13.0%) | 103 (5.7%) |
| 35 to 39 Minutes | 24 (1.4%) | 110 (6.1%) |
| 40 to 44 Minutes | 95 (5.4%) | 148 (8.2%) |
| 45 to 59 Minutes | 126 (7.2%) | 76 (4.2%) |
| 60 to 89 Minutes | 132 (7.6%) | 16 (0.9%) |
| 90 or more Minutes | 54 (3.1%) | 15 (0.8%) |
Time of Departure to Work by Sex in Little Falls
The most frequent times of departure to work in Little Falls are 6:30 AM to 6:59 AM (249, 14.3%) for males and 7:00 AM to 7:29 AM (295, 16.3%) for females.
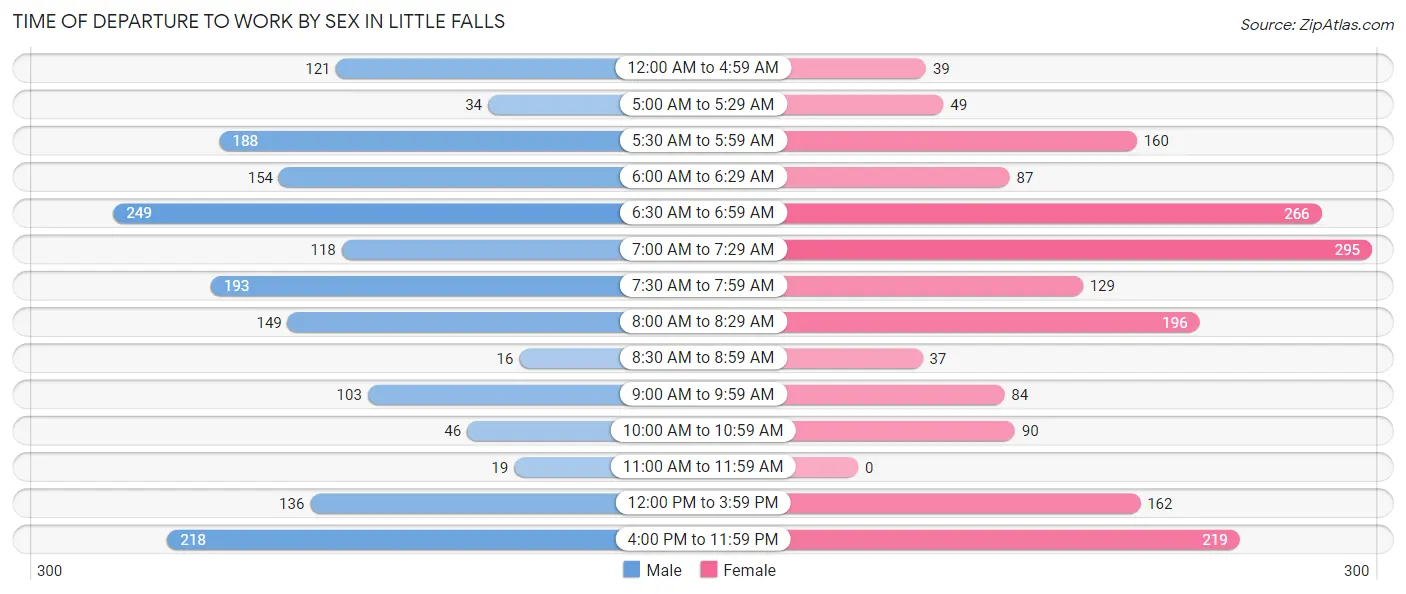
| Time of Departure | Male | Female |
| 12:00 AM to 4:59 AM | 121 (6.9%) | 39 (2.1%) |
| 5:00 AM to 5:29 AM | 34 (1.9%) | 49 (2.7%) |
| 5:30 AM to 5:59 AM | 188 (10.8%) | 160 (8.8%) |
| 6:00 AM to 6:29 AM | 154 (8.8%) | 87 (4.8%) |
| 6:30 AM to 6:59 AM | 249 (14.3%) | 266 (14.7%) |
| 7:00 AM to 7:29 AM | 118 (6.8%) | 295 (16.3%) |
| 7:30 AM to 7:59 AM | 193 (11.1%) | 129 (7.1%) |
| 8:00 AM to 8:29 AM | 149 (8.5%) | 196 (10.8%) |
| 8:30 AM to 8:59 AM | 16 (0.9%) | 37 (2.0%) |
| 9:00 AM to 9:59 AM | 103 (5.9%) | 84 (4.6%) |
| 10:00 AM to 10:59 AM | 46 (2.6%) | 90 (5.0%) |
| 11:00 AM to 11:59 AM | 19 (1.1%) | 0 (0.0%) |
| 12:00 PM to 3:59 PM | 136 (7.8%) | 162 (8.9%) |
| 4:00 PM to 11:59 PM | 218 (12.5%) | 219 (12.1%) |
| Total | 1,744 (100.0%) | 1,813 (100.0%) |
Housing Occupancy in Little Falls
Occupancy by Ownership in Little Falls
Of the total 3,954 dwellings in Little Falls, owner-occupied units account for 2,540 (64.2%), while renter-occupied units make up 1,414 (35.8%).
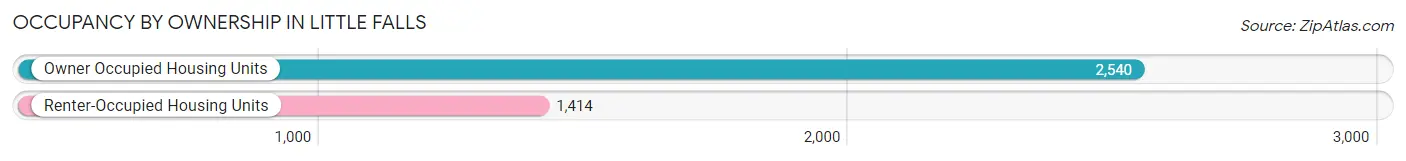
| Occupancy | # Housing Units | % Housing Units |
| Owner Occupied Housing Units | 2,540 | 64.2% |
| Renter-Occupied Housing Units | 1,414 | 35.8% |
| Total Occupied Housing Units | 3,954 | 100.0% |
Occupancy by Household Size in Little Falls
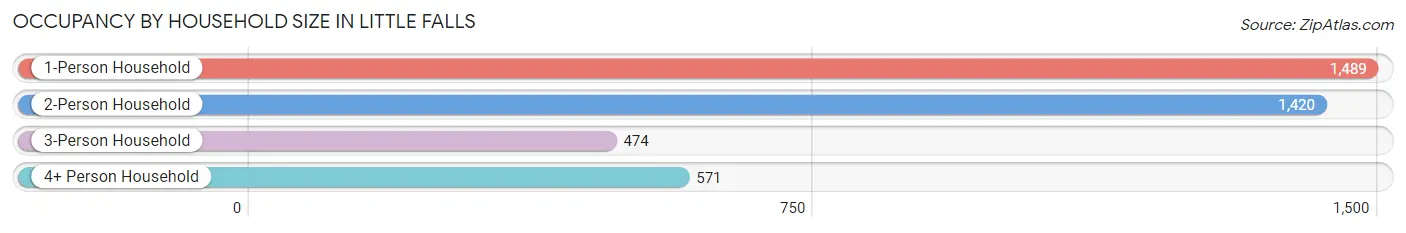
| Household Size | # Housing Units | % Housing Units |
| 1-Person Household | 1,489 | 37.7% |
| 2-Person Household | 1,420 | 35.9% |
| 3-Person Household | 474 | 12.0% |
| 4+ Person Household | 571 | 14.4% |
| Total Housing Units | 3,954 | 100.0% |
Occupancy by Ownership by Household Size in Little Falls
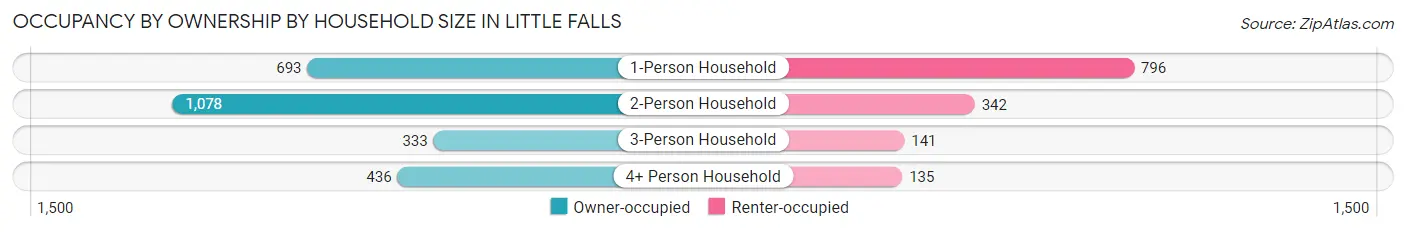
| Household Size | Owner-occupied | Renter-occupied |
| 1-Person Household | 693 (46.5%) | 796 (53.5%) |
| 2-Person Household | 1,078 (75.9%) | 342 (24.1%) |
| 3-Person Household | 333 (70.3%) | 141 (29.7%) |
| 4+ Person Household | 436 (76.4%) | 135 (23.6%) |
| Total Housing Units | 2,540 (64.2%) | 1,414 (35.8%) |
Occupancy by Educational Attainment in Little Falls
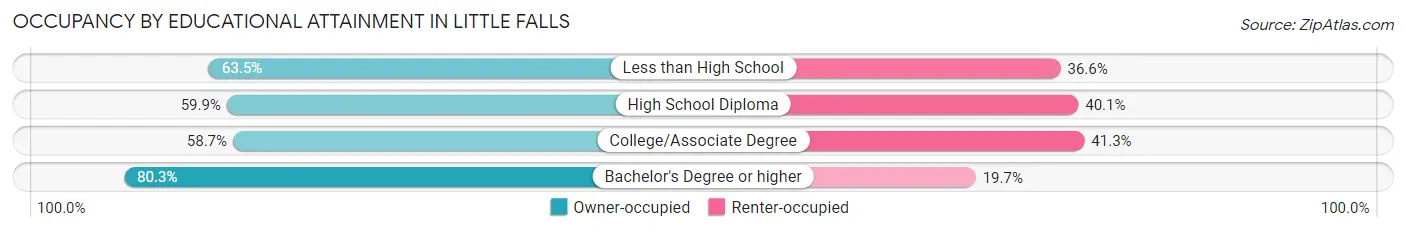
| Household Size | Owner-occupied | Renter-occupied |
| Less than High School | 217 (63.4%) | 125 (36.5%) |
| High School Diploma | 830 (59.9%) | 555 (40.1%) |
| College/Associate Degree | 802 (58.7%) | 564 (41.3%) |
| Bachelor's Degree or higher | 691 (80.3%) | 170 (19.7%) |
Occupancy by Age of Householder in Little Falls
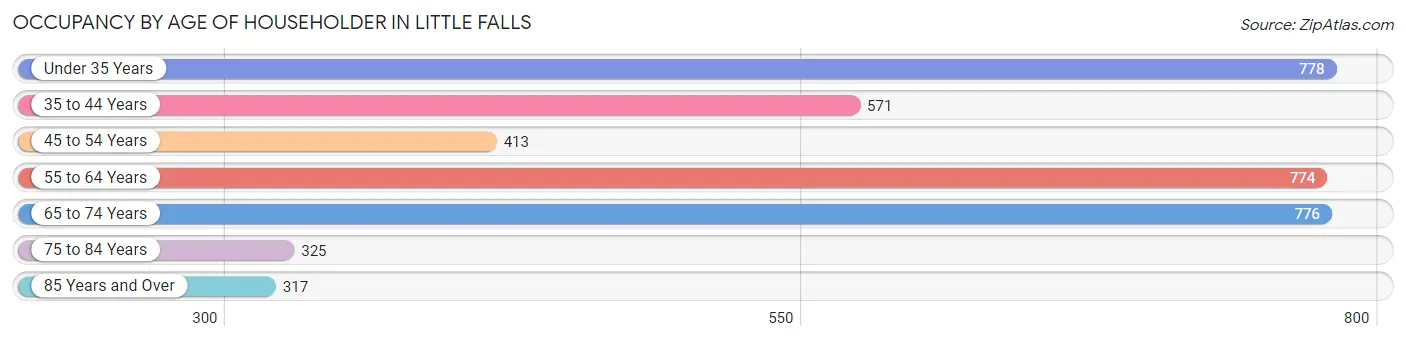
| Age Bracket | # Households | % Households |
| Under 35 Years | 778 | 19.7% |
| 35 to 44 Years | 571 | 14.4% |
| 45 to 54 Years | 413 | 10.4% |
| 55 to 64 Years | 774 | 19.6% |
| 65 to 74 Years | 776 | 19.6% |
| 75 to 84 Years | 325 | 8.2% |
| 85 Years and Over | 317 | 8.0% |
| Total | 3,954 | 100.0% |
Housing Finances in Little Falls
Median Income by Occupancy in Little Falls
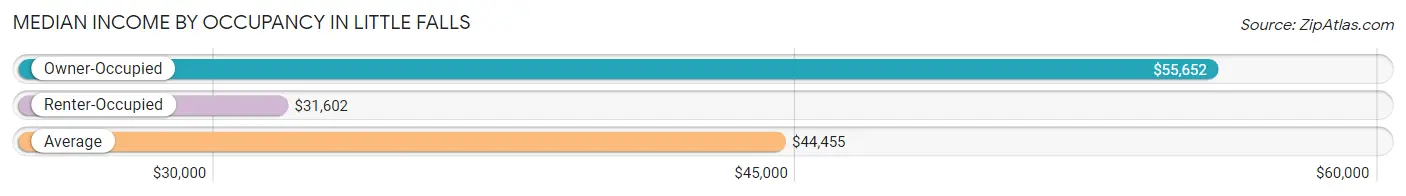
| Occupancy Type | # Households | Median Income |
| Owner-Occupied | 2,540 (64.2%) | $55,652 |
| Renter-Occupied | 1,414 (35.8%) | $31,602 |
| Average | 3,954 (100.0%) | $44,455 |
Occupancy by Householder Income Bracket in Little Falls
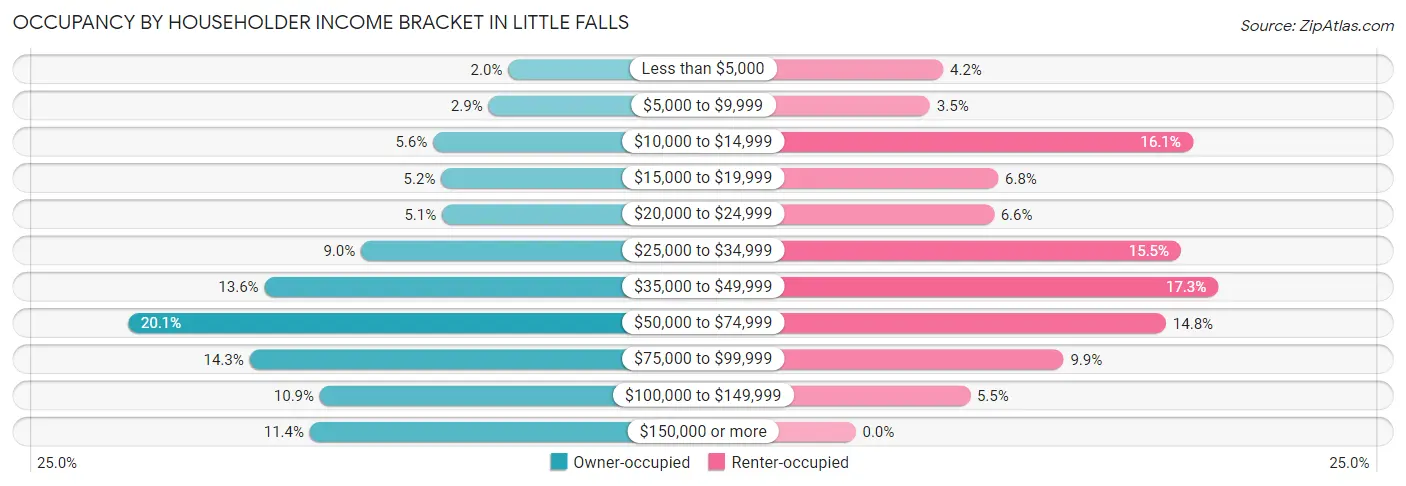
| Income Bracket | Owner-occupied | Renter-occupied |
| Less than $5,000 | 50 (2.0%) | 59 (4.2%) |
| $5,000 to $9,999 | 74 (2.9%) | 50 (3.5%) |
| $10,000 to $14,999 | 141 (5.6%) | 227 (16.1%) |
| $15,000 to $19,999 | 131 (5.2%) | 96 (6.8%) |
| $20,000 to $24,999 | 130 (5.1%) | 93 (6.6%) |
| $25,000 to $34,999 | 228 (9.0%) | 219 (15.5%) |
| $35,000 to $49,999 | 345 (13.6%) | 244 (17.3%) |
| $50,000 to $74,999 | 510 (20.1%) | 209 (14.8%) |
| $75,000 to $99,999 | 363 (14.3%) | 140 (9.9%) |
| $100,000 to $149,999 | 278 (10.9%) | 77 (5.4%) |
| $150,000 or more | 290 (11.4%) | 0 (0.0%) |
| Total | 2,540 (100.0%) | 1,414 (100.0%) |
Monthly Housing Cost Tiers in Little Falls
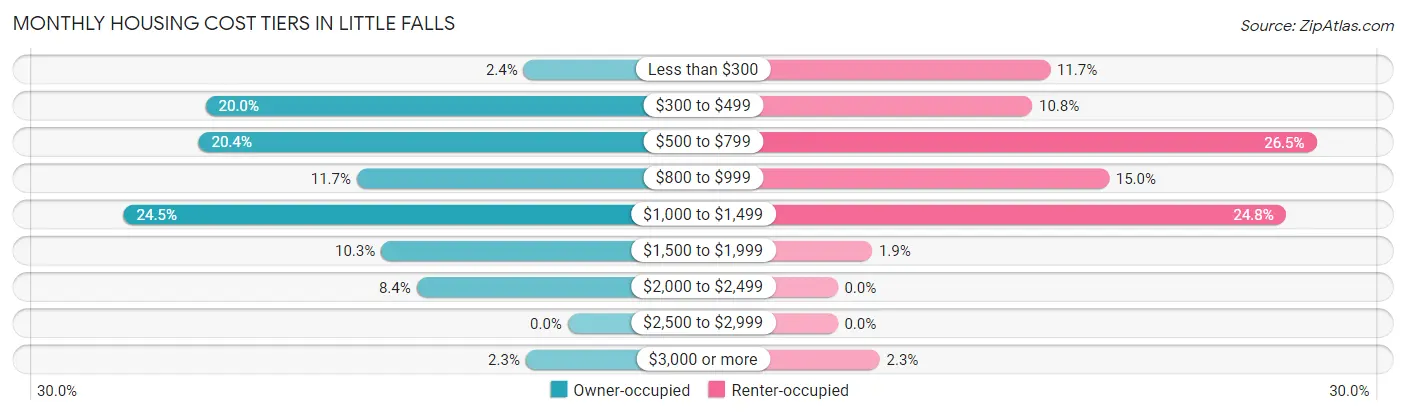
| Monthly Cost | Owner-occupied | Renter-occupied |
| Less than $300 | 62 (2.4%) | 166 (11.7%) |
| $300 to $499 | 508 (20.0%) | 152 (10.7%) |
| $500 to $799 | 518 (20.4%) | 374 (26.5%) |
| $800 to $999 | 296 (11.7%) | 212 (15.0%) |
| $1,000 to $1,499 | 623 (24.5%) | 350 (24.7%) |
| $1,500 to $1,999 | 262 (10.3%) | 27 (1.9%) |
| $2,000 to $2,499 | 212 (8.4%) | 0 (0.0%) |
| $2,500 to $2,999 | 0 (0.0%) | 0 (0.0%) |
| $3,000 or more | 59 (2.3%) | 33 (2.3%) |
| Total | 2,540 (100.0%) | 1,414 (100.0%) |
Physical Housing Characteristics in Little Falls
Housing Structures in Little Falls
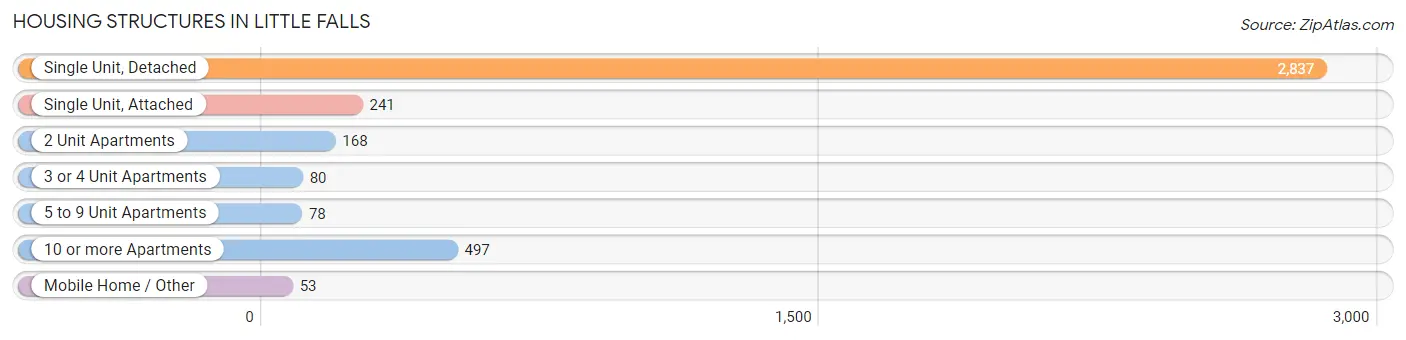
| Structure Type | # Housing Units | % Housing Units |
| Single Unit, Detached | 2,837 | 71.8% |
| Single Unit, Attached | 241 | 6.1% |
| 2 Unit Apartments | 168 | 4.3% |
| 3 or 4 Unit Apartments | 80 | 2.0% |
| 5 to 9 Unit Apartments | 78 | 2.0% |
| 10 or more Apartments | 497 | 12.6% |
| Mobile Home / Other | 53 | 1.3% |
| Total | 3,954 | 100.0% |
Housing Structures by Occupancy in Little Falls
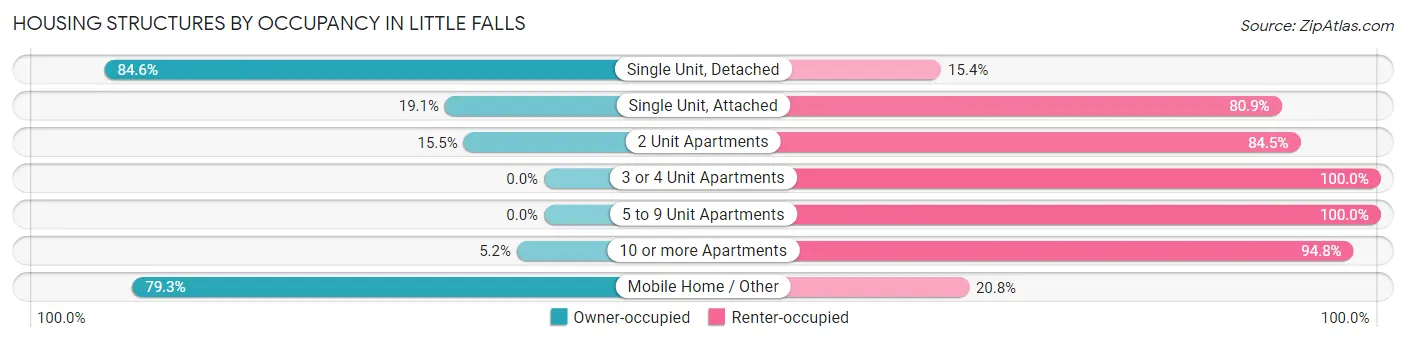
| Structure Type | Owner-occupied | Renter-occupied |
| Single Unit, Detached | 2,400 (84.6%) | 437 (15.4%) |
| Single Unit, Attached | 46 (19.1%) | 195 (80.9%) |
| 2 Unit Apartments | 26 (15.5%) | 142 (84.5%) |
| 3 or 4 Unit Apartments | 0 (0.0%) | 80 (100.0%) |
| 5 to 9 Unit Apartments | 0 (0.0%) | 78 (100.0%) |
| 10 or more Apartments | 26 (5.2%) | 471 (94.8%) |
| Mobile Home / Other | 42 (79.2%) | 11 (20.7%) |
| Total | 2,540 (64.2%) | 1,414 (35.8%) |
Housing Structures by Number of Rooms in Little Falls
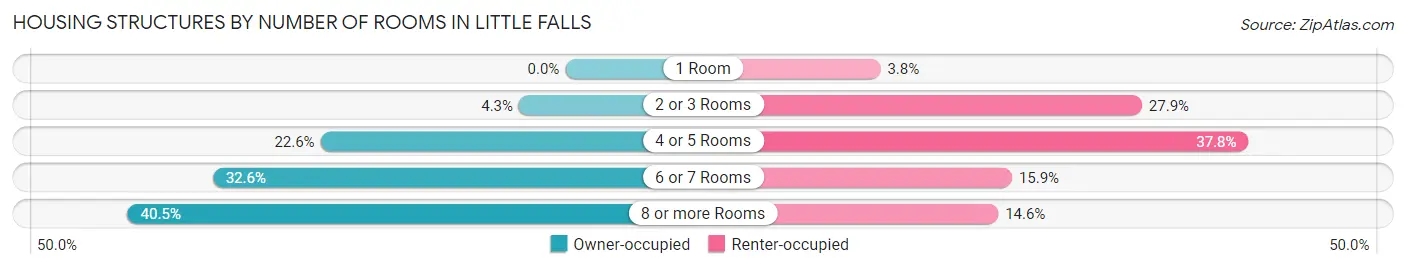
| Number of Rooms | Owner-occupied | Renter-occupied |
| 1 Room | 0 (0.0%) | 53 (3.7%) |
| 2 or 3 Rooms | 109 (4.3%) | 395 (27.9%) |
| 4 or 5 Rooms | 575 (22.6%) | 534 (37.8%) |
| 6 or 7 Rooms | 828 (32.6%) | 225 (15.9%) |
| 8 or more Rooms | 1,028 (40.5%) | 207 (14.6%) |
| Total | 2,540 (100.0%) | 1,414 (100.0%) |
Housing Structure by Heating Type in Little Falls
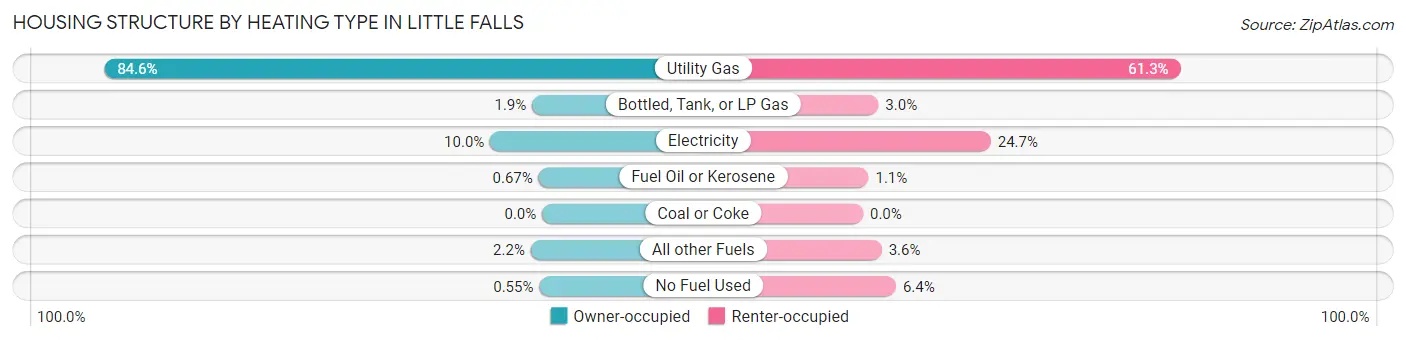
| Heating Type | Owner-occupied | Renter-occupied |
| Utility Gas | 2,149 (84.6%) | 867 (61.3%) |
| Bottled, Tank, or LP Gas | 49 (1.9%) | 42 (3.0%) |
| Electricity | 255 (10.0%) | 349 (24.7%) |
| Fuel Oil or Kerosene | 17 (0.7%) | 15 (1.1%) |
| Coal or Coke | 0 (0.0%) | 0 (0.0%) |
| All other Fuels | 56 (2.2%) | 51 (3.6%) |
| No Fuel Used | 14 (0.5%) | 90 (6.4%) |
| Total | 2,540 (100.0%) | 1,414 (100.0%) |
Household Vehicle Usage in Little Falls
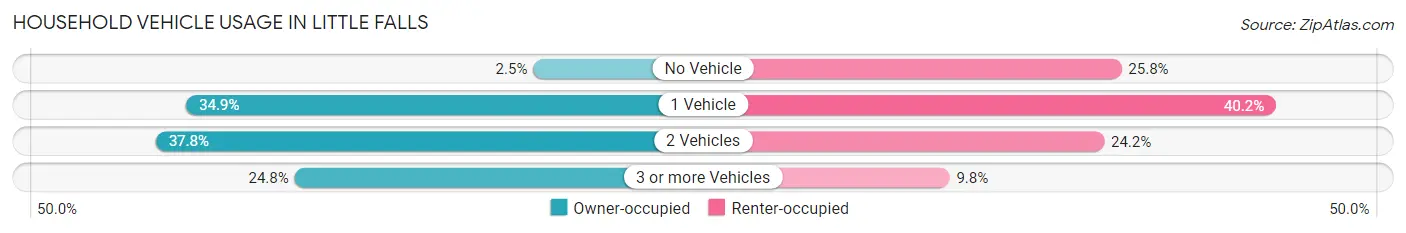
| Vehicles per Household | Owner-occupied | Renter-occupied |
| No Vehicle | 64 (2.5%) | 365 (25.8%) |
| 1 Vehicle | 887 (34.9%) | 569 (40.2%) |
| 2 Vehicles | 959 (37.8%) | 342 (24.2%) |
| 3 or more Vehicles | 630 (24.8%) | 138 (9.8%) |
| Total | 2,540 (100.0%) | 1,414 (100.0%) |
Real Estate & Mortgages in Little Falls
Real Estate and Mortgage Overview in Little Falls
| Characteristic | Without Mortgage | With Mortgage |
| Housing Units | 970 | 1,570 |
| Median Property Value | $183,300 | $165,400 |
| Median Household Income | $35,260 | $251 |
| Monthly Housing Costs | $472 | $35 |
| Real Estate Taxes | $2,337 | $28 |
Property Value by Mortgage Status in Little Falls
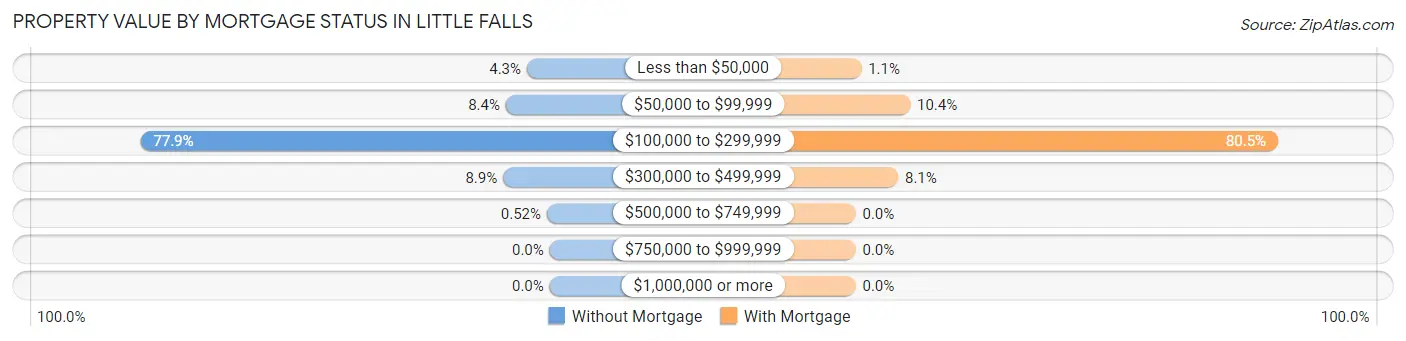
| Property Value | Without Mortgage | With Mortgage |
| Less than $50,000 | 42 (4.3%) | 17 (1.1%) |
| $50,000 to $99,999 | 81 (8.4%) | 163 (10.4%) |
| $100,000 to $299,999 | 756 (77.9%) | 1,263 (80.4%) |
| $300,000 to $499,999 | 86 (8.9%) | 127 (8.1%) |
| $500,000 to $749,999 | 5 (0.5%) | 0 (0.0%) |
| $750,000 to $999,999 | 0 (0.0%) | 0 (0.0%) |
| $1,000,000 or more | 0 (0.0%) | 0 (0.0%) |
| Total | 970 (100.0%) | 1,570 (100.0%) |
Household Income by Mortgage Status in Little Falls
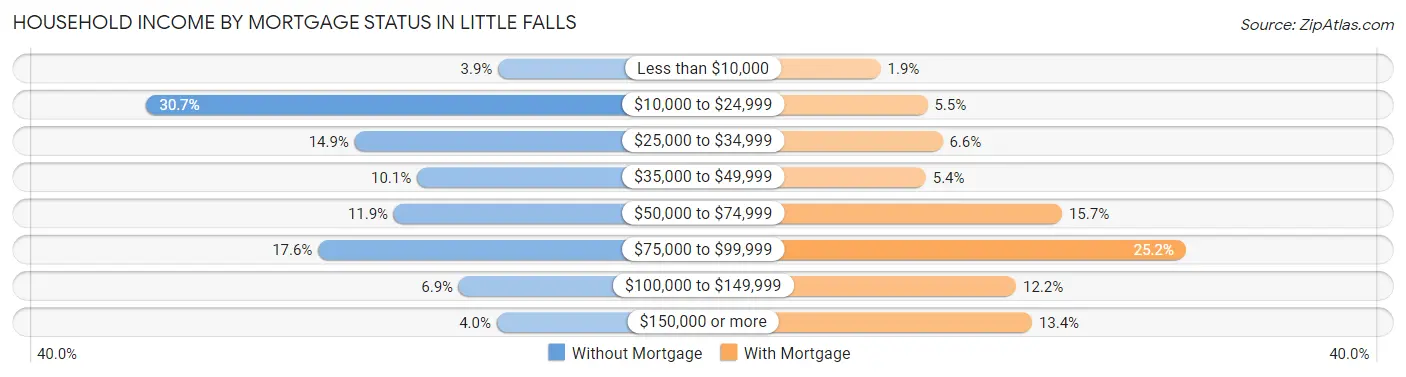
| Household Income | Without Mortgage | With Mortgage |
| Less than $10,000 | 38 (3.9%) | 30 (1.9%) |
| $10,000 to $24,999 | 298 (30.7%) | 86 (5.5%) |
| $25,000 to $34,999 | 144 (14.8%) | 104 (6.6%) |
| $35,000 to $49,999 | 98 (10.1%) | 84 (5.3%) |
| $50,000 to $74,999 | 115 (11.9%) | 247 (15.7%) |
| $75,000 to $99,999 | 171 (17.6%) | 395 (25.2%) |
| $100,000 to $149,999 | 67 (6.9%) | 192 (12.2%) |
| $150,000 or more | 39 (4.0%) | 211 (13.4%) |
| Total | 970 (100.0%) | 1,570 (100.0%) |
Property Value to Household Income Ratio in Little Falls
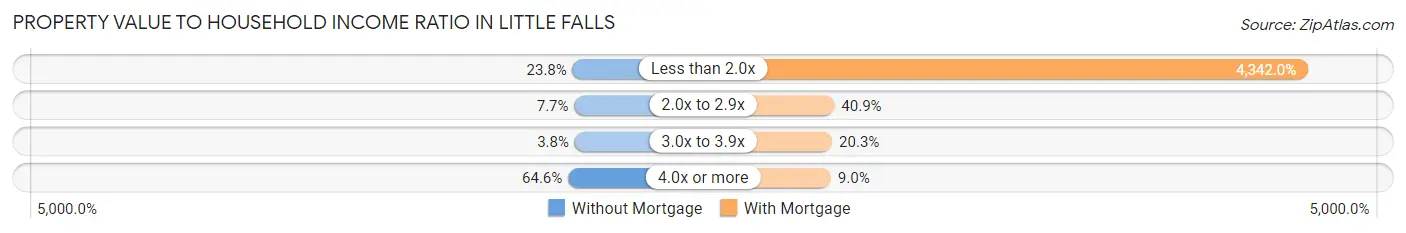
| Value-to-Income Ratio | Without Mortgage | With Mortgage |
| Less than 2.0x | 231 (23.8%) | 68,169 (4,342.0%) |
| 2.0x to 2.9x | 75 (7.7%) | 642 (40.9%) |
| 3.0x to 3.9x | 37 (3.8%) | 318 (20.3%) |
| 4.0x or more | 627 (64.6%) | 141 (9.0%) |
| Total | 970 (100.0%) | 1,570 (100.0%) |
Real Estate Taxes by Mortgage Status in Little Falls
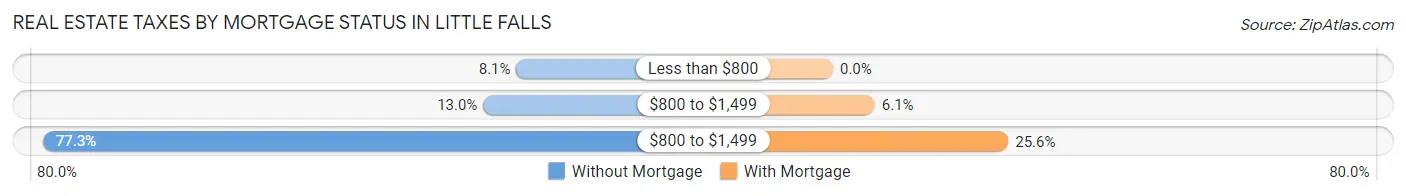
| Property Taxes | Without Mortgage | With Mortgage |
| Less than $800 | 79 (8.1%) | 0 (0.0%) |
| $800 to $1,499 | 126 (13.0%) | 96 (6.1%) |
| $800 to $1,499 | 750 (77.3%) | 402 (25.6%) |
| Total | 970 (100.0%) | 1,570 (100.0%) |
Health & Disability in Little Falls
Health Insurance Coverage by Age in Little Falls
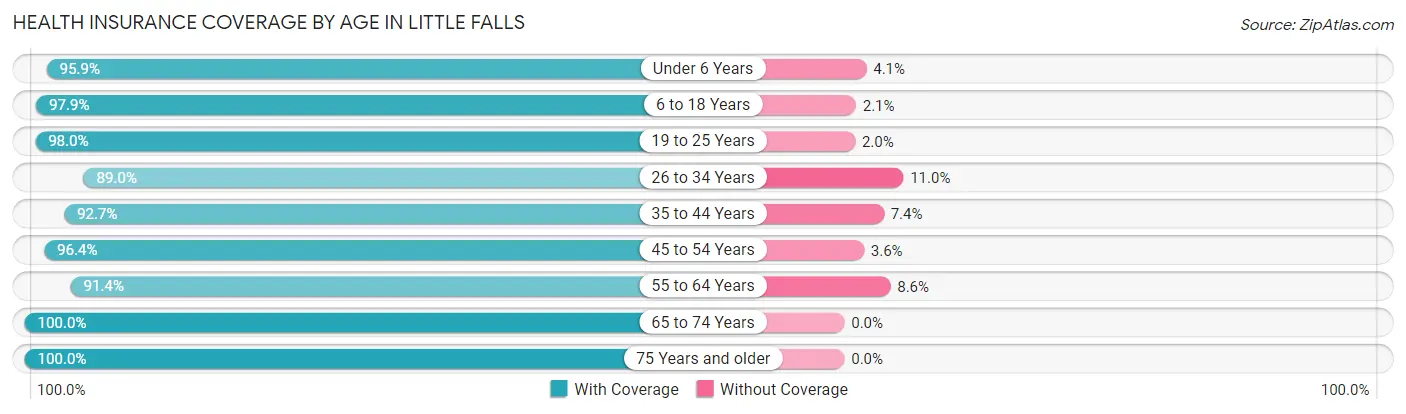
| Age Bracket | With Coverage | Without Coverage |
| Under 6 Years | 702 (95.9%) | 30 (4.1%) |
| 6 to 18 Years | 1,278 (97.9%) | 28 (2.1%) |
| 19 to 25 Years | 690 (98.0%) | 14 (2.0%) |
| 26 to 34 Years | 988 (89.0%) | 122 (11.0%) |
| 35 to 44 Years | 971 (92.6%) | 77 (7.3%) |
| 45 to 54 Years | 635 (96.4%) | 24 (3.6%) |
| 55 to 64 Years | 1,033 (91.4%) | 97 (8.6%) |
| 65 to 74 Years | 1,098 (100.0%) | 0 (0.0%) |
| 75 Years and older | 1,042 (100.0%) | 0 (0.0%) |
| Total | 8,437 (95.6%) | 392 (4.4%) |
Health Insurance Coverage by Citizenship Status in Little Falls
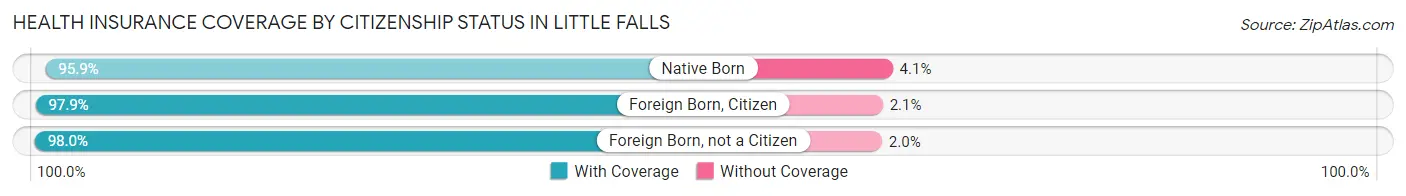
| Citizenship Status | With Coverage | Without Coverage |
| Native Born | 702 (95.9%) | 30 (4.1%) |
| Foreign Born, Citizen | 1,278 (97.9%) | 28 (2.1%) |
| Foreign Born, not a Citizen | 690 (98.0%) | 14 (2.0%) |
Health Insurance Coverage by Household Income in Little Falls
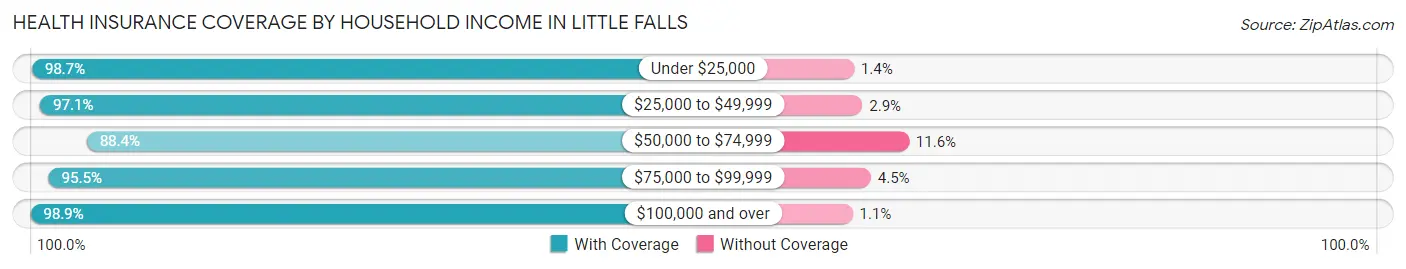
| Household Income | With Coverage | Without Coverage |
| Under $25,000 | 1,537 (98.7%) | 21 (1.3%) |
| $25,000 to $49,999 | 1,761 (97.1%) | 53 (2.9%) |
| $50,000 to $74,999 | 1,677 (88.4%) | 221 (11.6%) |
| $75,000 to $99,999 | 1,248 (95.5%) | 59 (4.5%) |
| $100,000 and over | 2,010 (98.9%) | 22 (1.1%) |
Public vs Private Health Insurance Coverage by Age in Little Falls
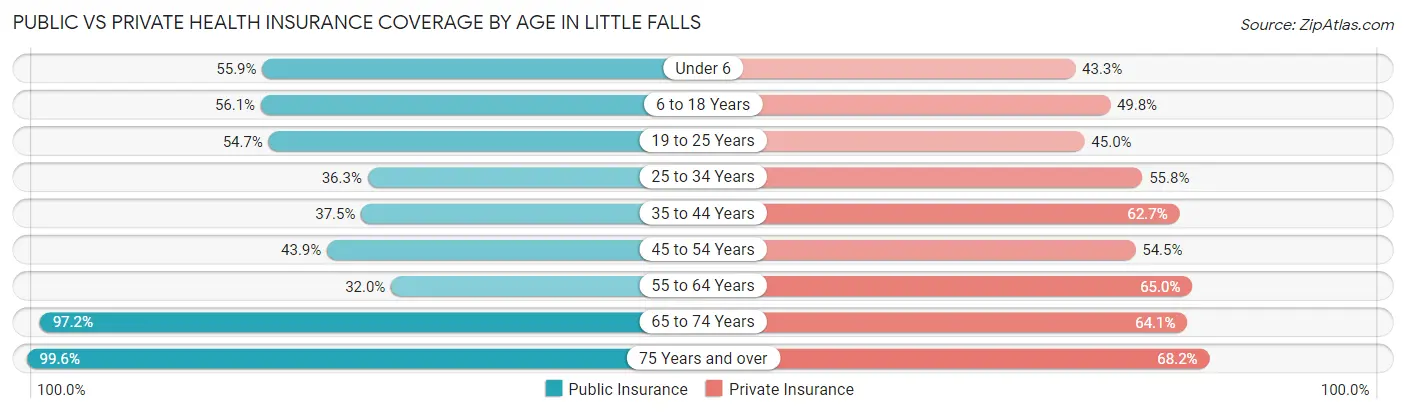
| Age Bracket | Public Insurance | Private Insurance |
| Under 6 | 409 (55.9%) | 317 (43.3%) |
| 6 to 18 Years | 733 (56.1%) | 650 (49.8%) |
| 19 to 25 Years | 385 (54.7%) | 317 (45.0%) |
| 25 to 34 Years | 403 (36.3%) | 619 (55.8%) |
| 35 to 44 Years | 393 (37.5%) | 657 (62.7%) |
| 45 to 54 Years | 289 (43.9%) | 359 (54.5%) |
| 55 to 64 Years | 361 (32.0%) | 735 (65.0%) |
| 65 to 74 Years | 1,067 (97.2%) | 704 (64.1%) |
| 75 Years and over | 1,038 (99.6%) | 711 (68.2%) |
| Total | 5,078 (57.5%) | 5,069 (57.4%) |
Disability Status by Sex by Age in Little Falls
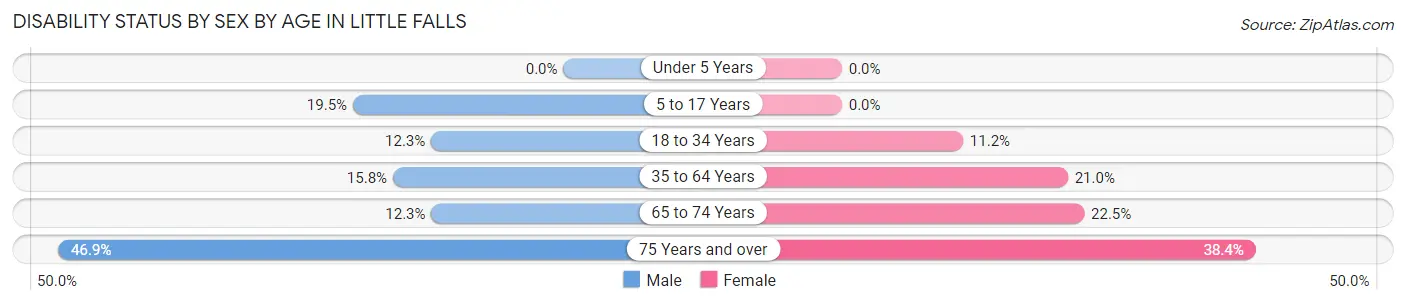
| Age Bracket | Male | Female |
| Under 5 Years | 0 (0.0%) | 0 (0.0%) |
| 5 to 17 Years | 140 (19.5%) | 0 (0.0%) |
| 18 to 34 Years | 112 (12.3%) | 107 (11.2%) |
| 35 to 64 Years | 215 (15.8%) | 310 (21.0%) |
| 65 to 74 Years | 49 (12.2%) | 157 (22.5%) |
| 75 Years and over | 159 (46.9%) | 270 (38.4%) |
Disability Class by Sex by Age in Little Falls
Disability Class: Hearing Difficulty
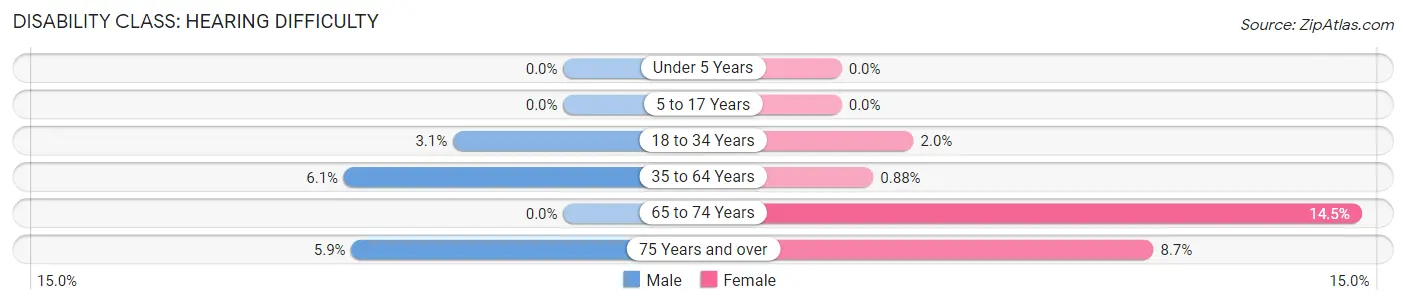
| Age Bracket | Male | Female |
| Under 5 Years | 0 (0.0%) | 0 (0.0%) |
| 5 to 17 Years | 0 (0.0%) | 0 (0.0%) |
| 18 to 34 Years | 28 (3.1%) | 19 (2.0%) |
| 35 to 64 Years | 83 (6.1%) | 13 (0.9%) |
| 65 to 74 Years | 0 (0.0%) | 101 (14.5%) |
| 75 Years and over | 20 (5.9%) | 61 (8.7%) |
Disability Class: Vision Difficulty
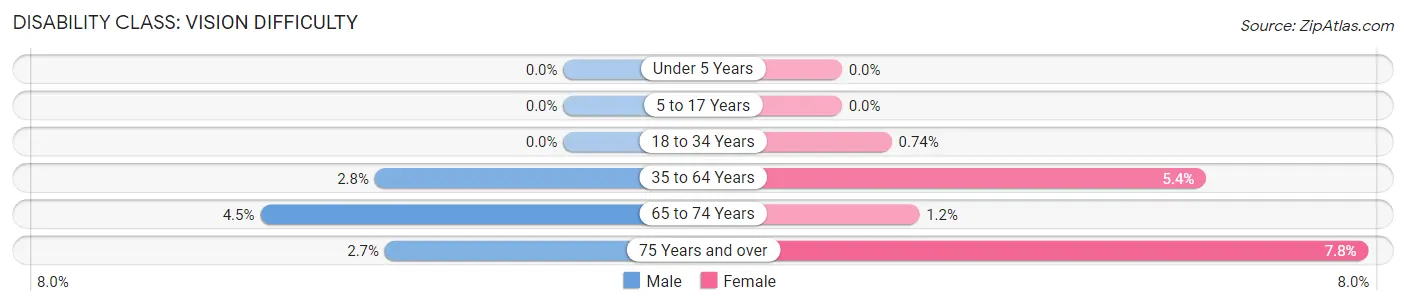
| Age Bracket | Male | Female |
| Under 5 Years | 0 (0.0%) | 0 (0.0%) |
| 5 to 17 Years | 0 (0.0%) | 0 (0.0%) |
| 18 to 34 Years | 0 (0.0%) | 7 (0.7%) |
| 35 to 64 Years | 38 (2.8%) | 80 (5.4%) |
| 65 to 74 Years | 18 (4.5%) | 8 (1.1%) |
| 75 Years and over | 9 (2.6%) | 55 (7.8%) |
Disability Class: Cognitive Difficulty
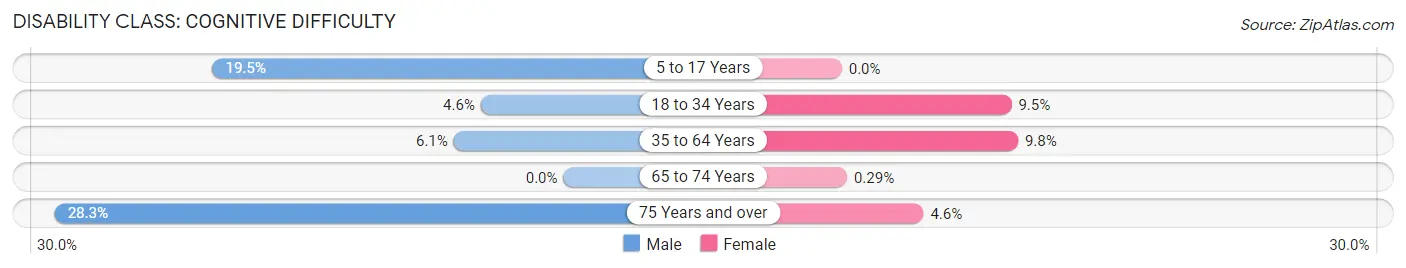
| Age Bracket | Male | Female |
| 5 to 17 Years | 140 (19.5%) | 0 (0.0%) |
| 18 to 34 Years | 42 (4.6%) | 90 (9.5%) |
| 35 to 64 Years | 83 (6.1%) | 145 (9.8%) |
| 65 to 74 Years | 0 (0.0%) | 2 (0.3%) |
| 75 Years and over | 96 (28.3%) | 32 (4.5%) |
Disability Class: Ambulatory Difficulty
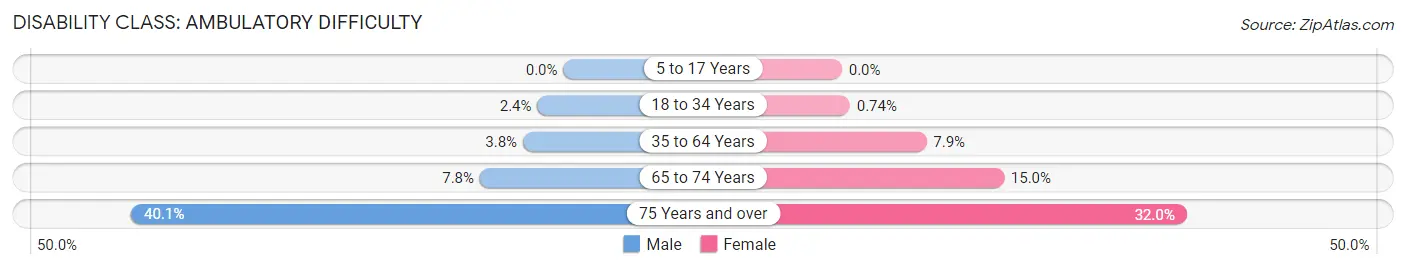
| Age Bracket | Male | Female |
| 5 to 17 Years | 0 (0.0%) | 0 (0.0%) |
| 18 to 34 Years | 22 (2.4%) | 7 (0.7%) |
| 35 to 64 Years | 51 (3.7%) | 116 (7.9%) |
| 65 to 74 Years | 31 (7.7%) | 105 (15.0%) |
| 75 Years and over | 136 (40.1%) | 225 (32.0%) |
Disability Class: Self-Care Difficulty
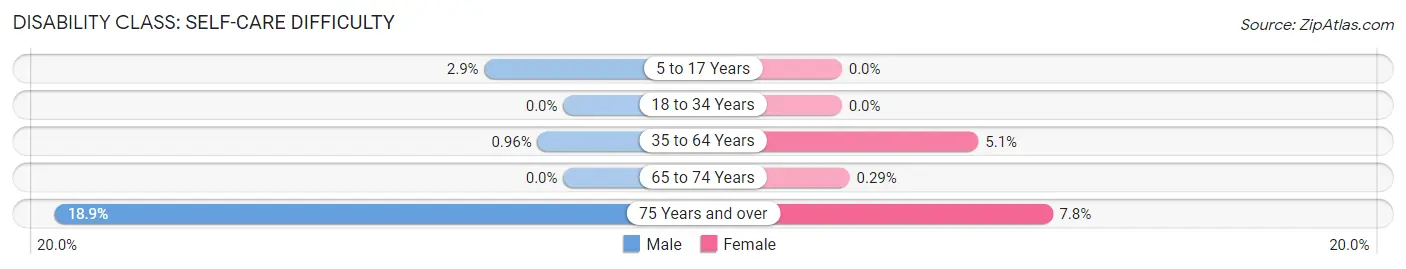
| Age Bracket | Male | Female |
| 5 to 17 Years | 21 (2.9%) | 0 (0.0%) |
| 18 to 34 Years | 0 (0.0%) | 0 (0.0%) |
| 35 to 64 Years | 13 (1.0%) | 75 (5.1%) |
| 65 to 74 Years | 0 (0.0%) | 2 (0.3%) |
| 75 Years and over | 64 (18.9%) | 55 (7.8%) |
Technology Access in Little Falls
Computing Device Access in Little Falls
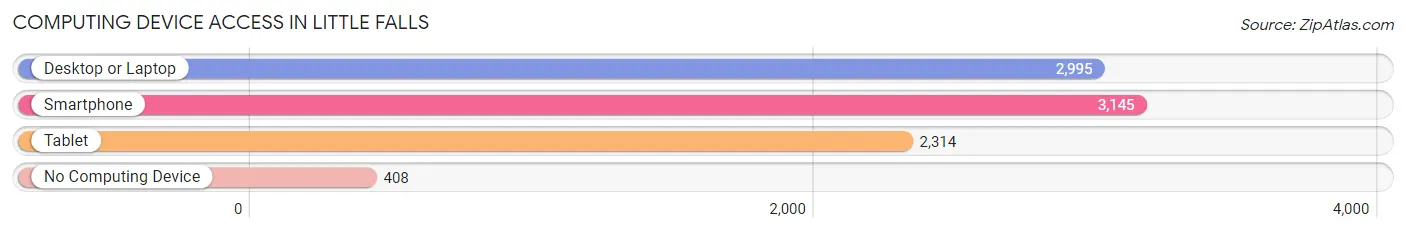
| Device Type | # Households | % Households |
| Desktop or Laptop | 2,995 | 75.7% |
| Smartphone | 3,145 | 79.5% |
| Tablet | 2,314 | 58.5% |
| No Computing Device | 408 | 10.3% |
| Total | 3,954 | 100.0% |
Internet Access in Little Falls
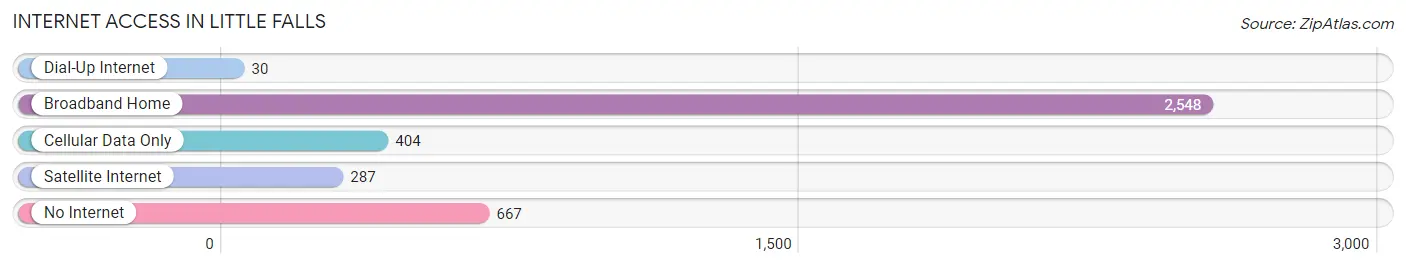
| Internet Type | # Households | % Households |
| Dial-Up Internet | 30 | 0.8% |
| Broadband Home | 2,548 | 64.4% |
| Cellular Data Only | 404 | 10.2% |
| Satellite Internet | 287 | 7.3% |
| No Internet | 667 | 16.9% |
| Total | 3,954 | 100.0% |
Little Falls Summary
History
Little Falls, Minnesota is a city located in Morrison County, Minnesota, United States. The city is situated on the banks of the Mississippi River and is the county seat of Morrison County. The city was founded in 1848 by Charles Flandrau, a fur trader and explorer. The city was named after a waterfall on the Mississippi River, which was known as “Little Falls” by the local Native American tribes.
Little Falls was originally a trading post for the fur trade, but it quickly grew into a thriving community. The city was incorporated in 1856 and was the first city in Morrison County. The city was a major hub for the lumber industry in the late 19th century, and it was also a major stop on the Great Northern Railway.
The city was also the site of a major battle during the U.S.-Dakota War of 1862. The Battle of Little Falls was fought between the U.S. Army and the Dakota Sioux. The U.S. Army was victorious and the Dakota Sioux were forced to retreat.
Geography
Little Falls is located in central Minnesota, approximately 90 miles northwest of Minneapolis. The city is situated on the banks of the Mississippi River and is surrounded by rolling hills and forests. The city has a total area of 8.2 square miles, of which 8.1 square miles is land and 0.1 square miles is water.
The city has a humid continental climate, with cold winters and warm summers. The average temperature in January is 16°F and the average temperature in July is 75°F. The average annual precipitation is 33 inches.
Economy
Little Falls is a small city with a population of 8,343 as of the 2010 census. The city’s economy is largely based on agriculture, manufacturing, and tourism. The city is home to several large employers, including the Little Falls Hospital, the Little Falls Public Schools, and the Little Falls Community College.
The city is also home to several small businesses, including restaurants, retail stores, and service providers. The city is also home to several tourist attractions, including the Charles A. Lindbergh Historic Site, the Little Falls Dam, and the Great River Arts Center.
Demographics
As of the 2010 census, the population of Little Falls was 8,343. The racial makeup of the city was 95.2% White, 0.7% African American, 0.7% Native American, 0.7% Asian, 0.2% Pacific Islander, 1.2% from other races, and 1.5% from two or more races. Hispanic or Latino of any race were 3.2% of the population.
The median income for a household in the city was $41,944, and the median income for a family was $50,917. The per capita income for the city was $20,845. About 8.2% of families and 11.2% of the population were below the poverty line, including 15.2% of those under age 18 and 8.2% of those age 65 or over.
Common Questions
What is Per Capita Income in Little Falls?
Per Capita income in Little Falls is $29,248.
What is the Median Family Income in Little Falls?
Median Family Income in Little Falls is $62,045.
What is the Median Household income in Little Falls?
Median Household Income in Little Falls is $44,455.
What is Income or Wage Gap in Little Falls?
Income or Wage Gap in Little Falls is 37.7%.
Women in Little Falls earn 62.3 cents for every dollar earned by a man.
What is Inequality or Gini Index in Little Falls?
Inequality or Gini Index in Little Falls is 0.45.
What is the Total Population of Little Falls?
Total Population of Little Falls is 9,084.
What is the Total Male Population of Little Falls?
Total Male Population of Little Falls is 4,138.
What is the Total Female Population of Little Falls?
Total Female Population of Little Falls is 4,946.
What is the Ratio of Males per 100 Females in Little Falls?
There are 83.66 Males per 100 Females in Little Falls.
What is the Ratio of Females per 100 Males in Little Falls?
There are 119.53 Females per 100 Males in Little Falls.
What is the Median Population Age in Little Falls?
Median Population Age in Little Falls is 40.8 Years.
What is the Average Family Size in Little Falls
Average Family Size in Little Falls is 2.8 People.
What is the Average Household Size in Little Falls
Average Household Size in Little Falls is 2.2 People.
How Large is the Labor Force in Little Falls?
There are 4,045 People in the Labor Forcein in Little Falls.
What is the Percentage of People in the Labor Force in Little Falls?
55.5% of People are in the Labor Force in Little Falls.
What is the Unemployment Rate in Little Falls?
Unemployment Rate in Little Falls is 6.0%.